
Abstract
Background:
Death in hospital rather than at home is becoming more prevalent, even among terminally ill patients receiving home-based care. Identifying trends in places of death is crucial to care policy, especially for aging populations as in Taiwan.
Aim:
To identify changes in the places of natural death of Taiwanese individuals for various causes of death.
Design:
A population-based observational study was conducted.
Setting:
Anonymous data for the period 2000–2020 from the Death Database of Taiwan's National Center for Health Statistics Data were obtained and analyzed.
Results:
In 2000, 60.1% of natural deaths occurred in the home, whereas in 2020, this percentage was only 36.8%; conversely, the percentage of deaths in hospital increased from 34.4% in 2000 to 56.1% in 2020. Deaths in a nursing home or long-term care facility were found to account for only 3.8% of all natural deaths in 2020. Dementia was the cause of death for which the proportion of institutional deaths was highest, although this proportion was <10% for most years. We applied the joinpoint regression model to estimate trend changes in places of death. During the study period, the places of death in Taiwan changed significantly, the average annual percent changes for hospital deaths over the 21-year period was 2.54% (confidence interval [CI]: 2.04 to 3.03), and for home deaths was −2.69% (CI: −3.26 to −2.13).
Conclusions:
The detailed findings of this national study can offer insight into potential future clinical burdens and lead to better health policy decisions for Taiwan.
Introduction
Analysis of where people die can help improve the quality of care for the terminally ill.1,2 It can also serve as an evidence base for health policy in end-of-life care.3,4 For people die in the hospital, the hospital staff's training in hospice palliative care should be strengthened to prevent overmedication and aggressive intervention for patients at the end of life. To support people who wish to die at home, the adequacy of existing community resources and long-term care facilities for end-of-life care has been the focus of considerable research.
Previous research has reported that the distributions of place of death vary across countries, and more than half of all deaths occur in hospitals.5–8 Reyniers et al. 9 reported that South Korea, in Asia, has a higher proportion of hospital death (73.6%) for patients dying from dementia in 2007 compared with other countries. The percentage of deaths in institutions among elderly people is increasing each year.6–8 In the United Kingdom, where hospice care is most developed, more than half of terminal patients wish to die at home.
However, according to the 2021 statistics published by the U.K. Department of Health, 44.3% of terminally ill patients die in a hospital, <27.3% die at home, and 21.3% die in a nursing home. Similar changes have been found in studies done in other countries.3,10,11
The author's 2008 study conducted in Taiwan discovered that 61.8% of cancer deaths occurred at home and 36.4% in a hospital or clinic. 12 Because of its low fertility rate and the longevity of its citizens, Taiwan became an ageing society (with the proportion of people aged 65 years or older >14%) in 2018 and will become a superaged society (>20%) in 2025, representing a mere eight-year progression from an aging society to a superaged society. 13 Sustaining National Health Insurance, which has been implemented in Taiwan since 1995, will be a major challenge for Taiwan in the near future, and appropriate policies must be formulated immediately.
To meet the needs of the elderly in an aging society, the National Health Insurance expanded the target group of palliative care to non-cancer patients and implemented a new payment mechanism. In April 2016, Taiwan proposed a community homecare integration plan. In addition to home care services, primary care physicians and community nurses are encouraged to provide hospice home visits. 14
Place of death is a major determinant of the experience of patients and their families. The details on a death certificate provide the most extensive information on place of death, despite having some limitations. 15 To assess changes in where Taiwanese patients die, we analyzed data from the 2000–2020 Death Database of the National Center for Health Statistics. This study aimed at providing a macrolevel analysis of trends in the place of death for people dying from various diseases in Taiwan and at recommending future measures and policies for an aging society.
Methods
This population-based observational study analyzes Vital Statistics in Taiwan for the period 2000–2020. The study used the annual Vital Statistics data regularly published by the Ministry of Health and Welfare in Taiwan, a database that collects information on deaths across the country and provides natural death data by gender, diagnosis, and place of death. 16 Each case has only one code of the main cause of death, which refers to the “underlying” cause of death.15,16
Following the death of a Taiwan resident, the main cause of death and place of death were recorded by a doctor. Local health clinics compile the records and then report them to the Ministry of Health and Welfare after conducting credibility checks. The data in this study are available at: https://www.mohw.gov.tw/np-128-2.html In this study, death from external causes was excluded.
Before 2007, the Ministry of Health and Welfare in Taiwan used the International Classification of Diseases, Ninth Revision (ICD-9) classification codes 17 to classify causes of death. From 2008 onward, there was a complete change to using the International Classification of Diseases, Tenth Revision (ICD-10) classification codes 18 to classify causes of death. Thus, dementia, senility, and degenerative neurological diseases were not recognized as potential causes of death before 2008.
In this study, we consistently employed the ICD-10 coding rules as the basis for classifying causes of death. The following cause of death codes were used: malignant neoplasm, ICD-10 codes C00–C97; heart disease, ICD-10 codes I00–I52; pneumonia, influenza, and bronchiolitis, ICD-10 codes J10–J21; cerebral vascular disease, ICD-10 codes I60–I69; diabetes mellitus, ICD-10 codes E10–E14; renal disease, ICD-10 codes N17, N18, N28, and I10–I15; chronic pulmonary disease, ICD-10 codes J40–J47; liver disease, ICD-10 codes K70, K73, and K74; dementia, ICD-10 codes F01–F03 and G30; sepsis, ICD-10 codes A40 and A41; senility, ICD-10 codes R54; and neurodegenerative disease, ICD-10 codes G12, G20, and G21. Place of death was defined according to the place named on the death certificate and classified as hospital (hospital or clinic), own home, other premises, or, since 2014, a long-term care facility.
Statistical analysis
The natural death rate is expressed as crude death rate per 100,000 people and is equal to the total number of all natural deaths divided by the mid-year population multiplied by 100,000. This study uses percentages to express the proportion of locations where natural deaths occurred, calculated by dividing the number of deaths at different locations by the total number of natural deaths that occurred in that year.
This study used joinpoint regression analysis to estimate trends in the death rate and proportions of places of death, determine the annual percent changes (APCs) between points of change and their confidence intervals (CIs). The average APC (AAPC) over the entire period was also used to compare differences in mortality trends between sex, place of death, and diagnostic subgroups.
The upper threshold for the number of joinpoints in the analysis was set at 3. A p-value less than the significance level (α = 0.05) indicates that the slope is significantly different from zero. This study used Microsoft Excel 2017 (Microsoft Corporation, Redmond, WA) and the Joinpoint Regression Program, version 4.6.0.0. 19 to perform statistical processing of the data.
The APCs between points of change and their CIs were determined using joinpoint regression analysis. The slope, where p < 0.05 was defined as the significance level, was significantly different from zero.
To compare differences in mortality trends between sex, place of death, and diagnosis subgroups, we estimated the AAPC over the entire period.
Ethics approval
This study was an observational study using anonymous and publicly available data. There were no interventions, and no personal data were collected for this study. Therefore, there was no requirement to obtain informed consent. This study was approved by the Institutional Review Board of Taipei Veterans General Hospital (2020-07-003BC).
Results
Table 1 shows the annual number of natural deaths in Taiwan over the past 20 years, increasing from 114,763 in 2000 to 162,490 in 2020. Taiwan became an aged society in 2018 (percentage of those aged 65 or older >14%). With the aging of the population, the natural death rate increased by 171.3, from 517.31 to 689.04 deaths per 100,000 population (Table 1).
Number of Deaths and Share of Deaths by Sex, Cause of Death, and Place of Death in Selected Years and Change in Percentage Points and Absolute Numbers (2000–2020)
The crude death rate per 100,000 population equals the total number of deaths divided by the mid-year population and multiplied by 100,000.
Over the 20-year period from 2000 to 2020, the crude death rates for various causes of death increased significantly, especially for deaths due to dementia; pneumonia, influenza, or bronchiolitis; chronic pulmonary disease; heart disease; and renal disease, for which the death rate increased significantly by 294.8%, 231.8%, 107.0%, and 102.8%, respectively. However, for patients who died of cerebral vascular disease and liver disease, the death rate decreased by 16.6% and 27.9% respectively. Dementia began to be listed as a cause of death in 2008, and the number of patients who died of dementia was found to have increased from 2.22 to 12.95 per 100,000 in just 13 years.
Malignant neoplasm accounted for 27.4% of all natural deaths in 2000 and 30.8% in 2020. The other most common causes of death in 2020 were heart disease (12.6%); pneumonia, influenza, or bronchiolitis (8.6%); cerebral vascular disease (7.3%); and diabetes mellitus (6.3%). Deaths caused by dementia or senility accounted for only 3.3% of all natural deaths in 2020.
During the study period, the places of death in Taiwan changed significantly. The number of home deaths decreased slightly (by 9074, or 13%), whereas the number of people dying in hospitals increased by 52,697, or 134%. In 2000, 60.1% of natural deaths occurred at home (Fig. 1), whereas in 2020, this percentage was only 36.8%; the percentage of deaths in hospital increased from 34.4% in 2000 to 56.1% in 2020. In 2012, hospitals surpassed homes as being the most common place of death in Taiwan.
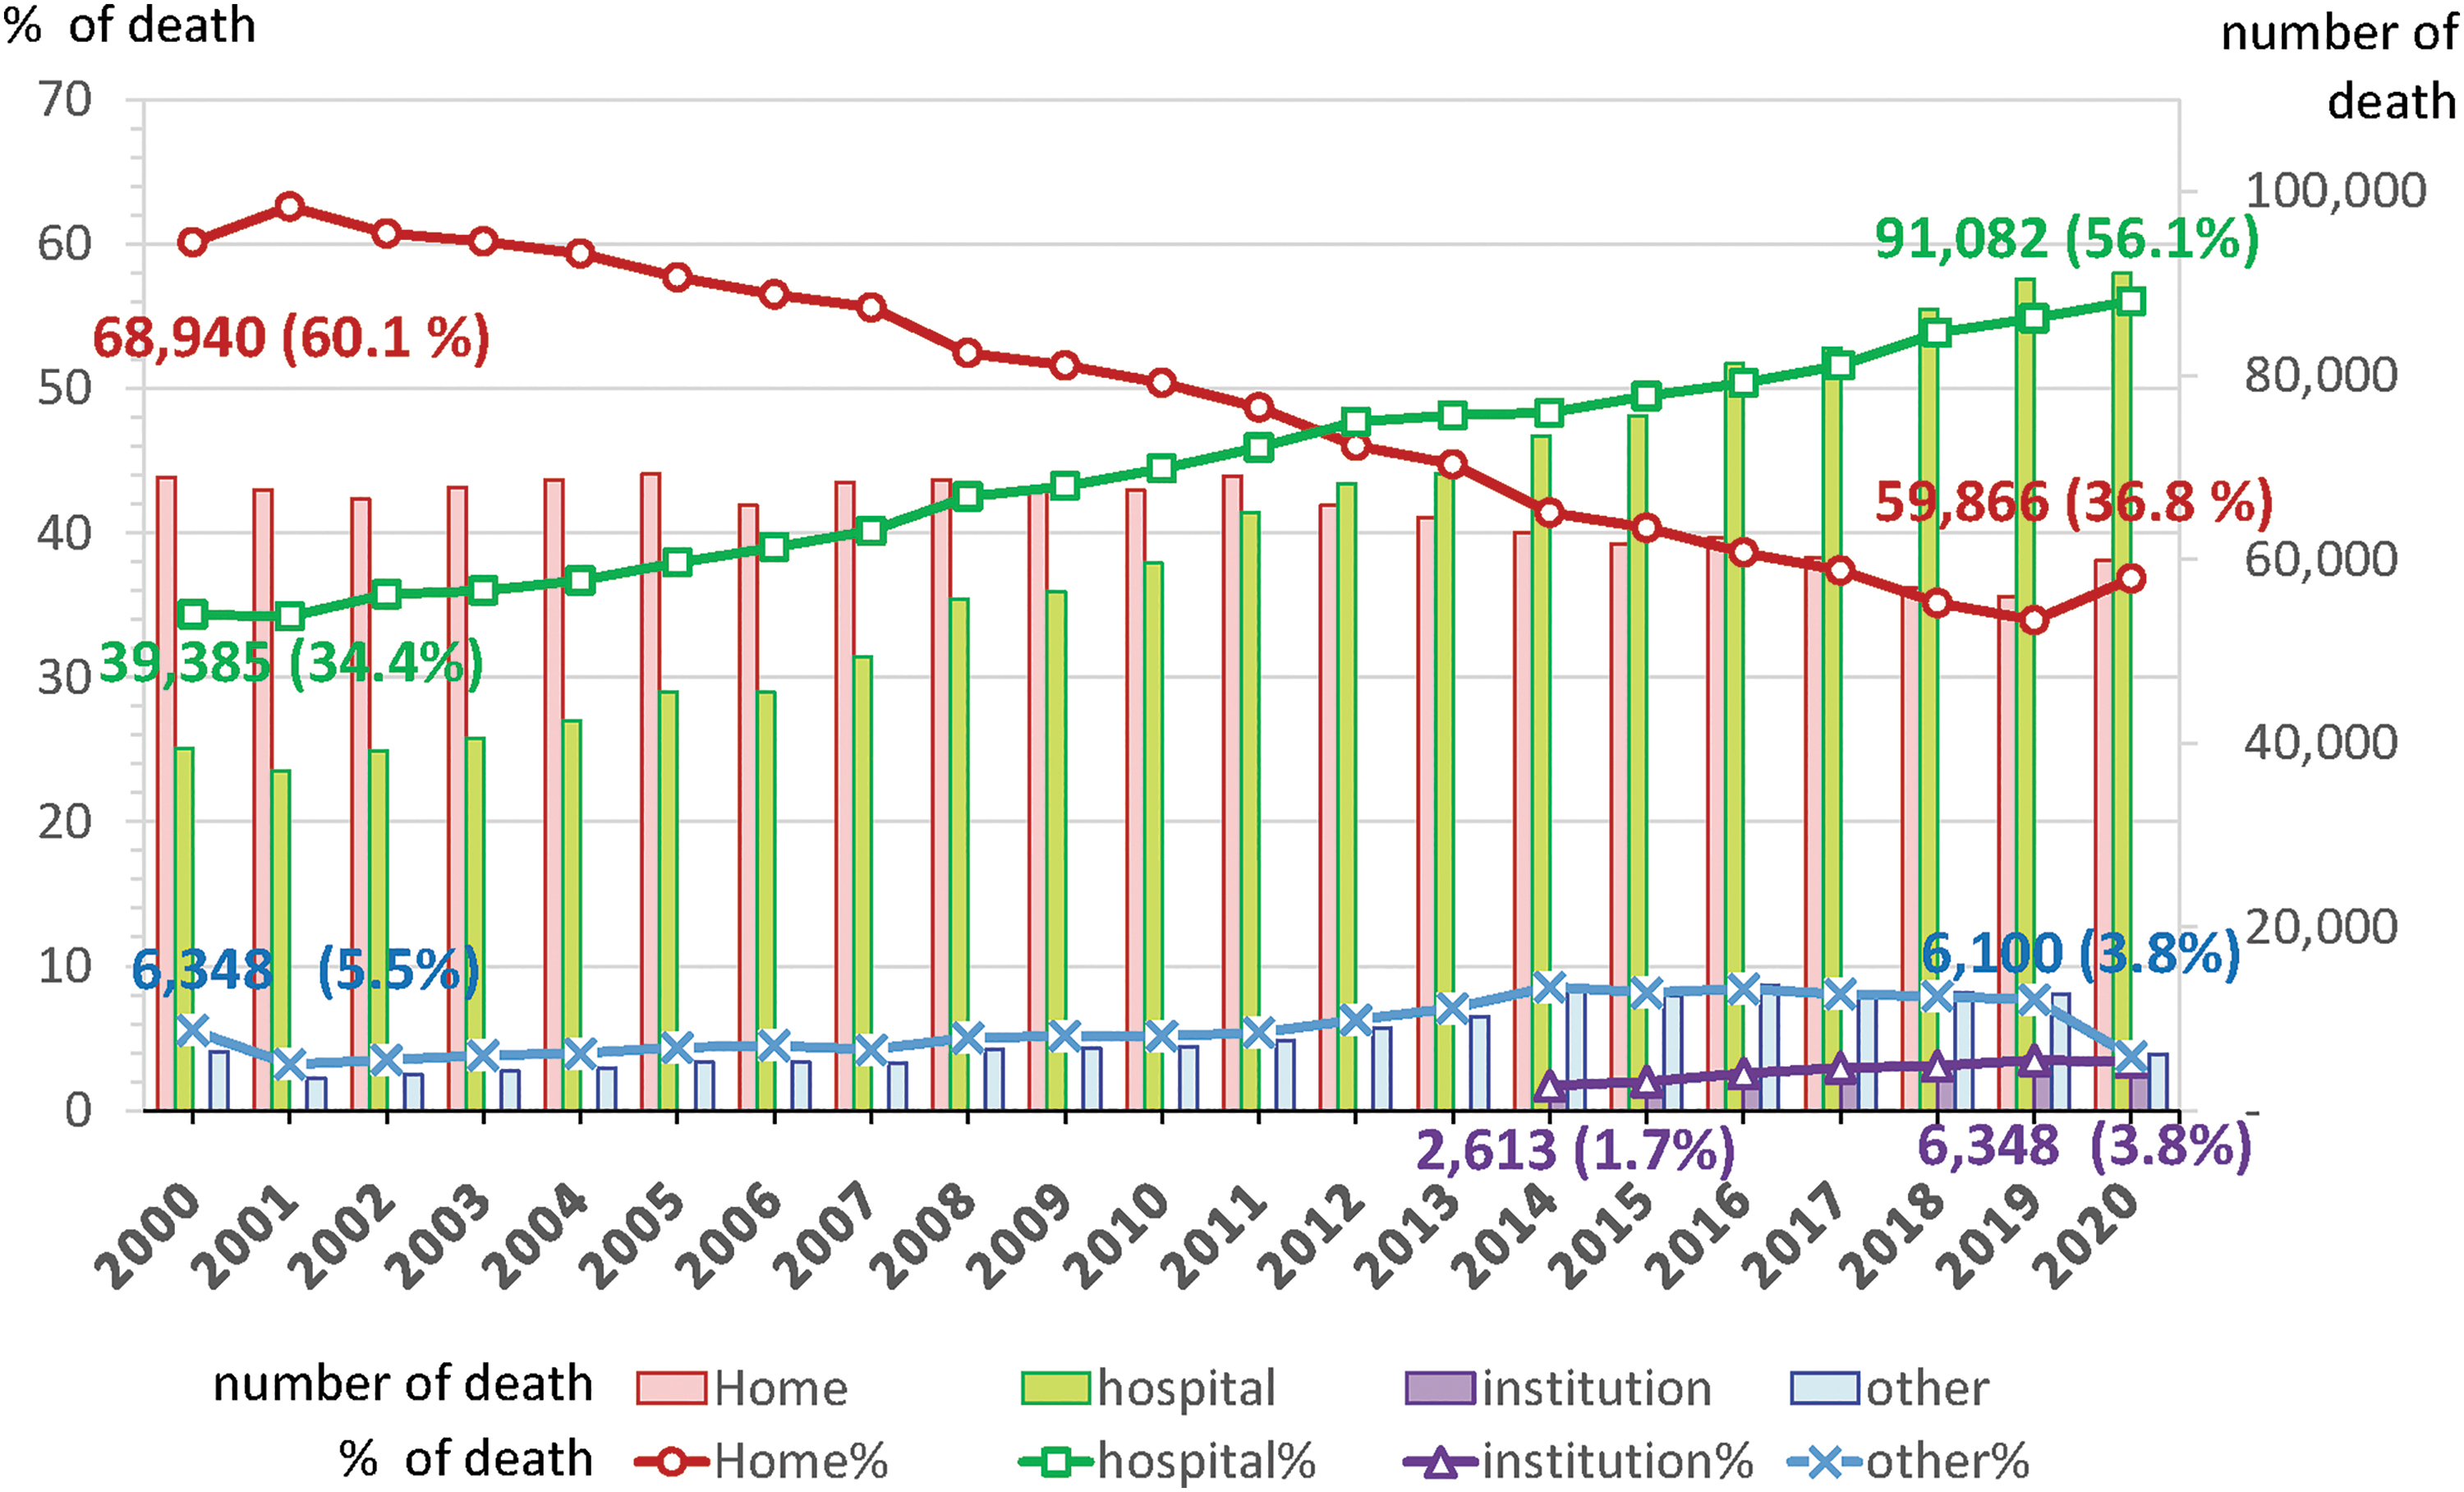
Change in the place of natural death in terms of number and percentage during 2000–2020 in Taiwan.
If a resident died in an institution, the place of death was previously classified as “other location.” Since 2014, Taiwan has designated “nursing home or long term care facility” as a possible registered place of death (institution). However, in 2020, deaths in institutions accounted for only 3.8% of all natural deaths (Fig. 1).
We applied the joinpoint regression model to estimate the trend in places of death by using joinpoint, the APC, and the AAPC. Table 2 shows the joinpoint regression of trends in the place of death over the past 21 years.
Joinpoint Regression of Trends in Place of Death by Sex, 2000–2020
Indicates that the APC or the AAPC is significantly different from zero at the alpha = 0.05 level.
If the AAPC is within one segment, the t-distribution is used. Otherwise, the normal (z) distribution is used.
AAPC, average annual percent change; APC, annual percent change; CI, confidence interval.
The AAPC for home deaths over the 21-year period was −2.69% (CI: −3.26 to −2.13), and the AAPC in hospital deaths was 2.54% (CI: 2.04 to 3.03). The percentage of home deaths initially decreased slightly at a rate of 1.38 percentage points per year and then fell significantly—4.13 percentage points per year—in the next 12 years (2007–2018); continuing decline has not been observed in the past 3 years, and the trend appears to be reversing (0.72%). This pattern of change was discovered for both men and women, except that the downward trend for women between 2004 and 2011 was slightly weaker than that for men.
The percentage of deaths in hospitals continually increased for both sexes over the past 20 years, particularly between 2004 and 2012, during which time it increased significantly increase at an average rate of 3.3% per year. Between 2012 and 2015, the increase in the percentage of hospital deaths, particularly among men, appears to have slowed, but after 2015, it continued to rise at an average annual rate of 2.73% for both sexes. The trend in the percentage of deaths in institutions was strongest between 2014 and 2017, with the trend not significant between 2017 and 2020.
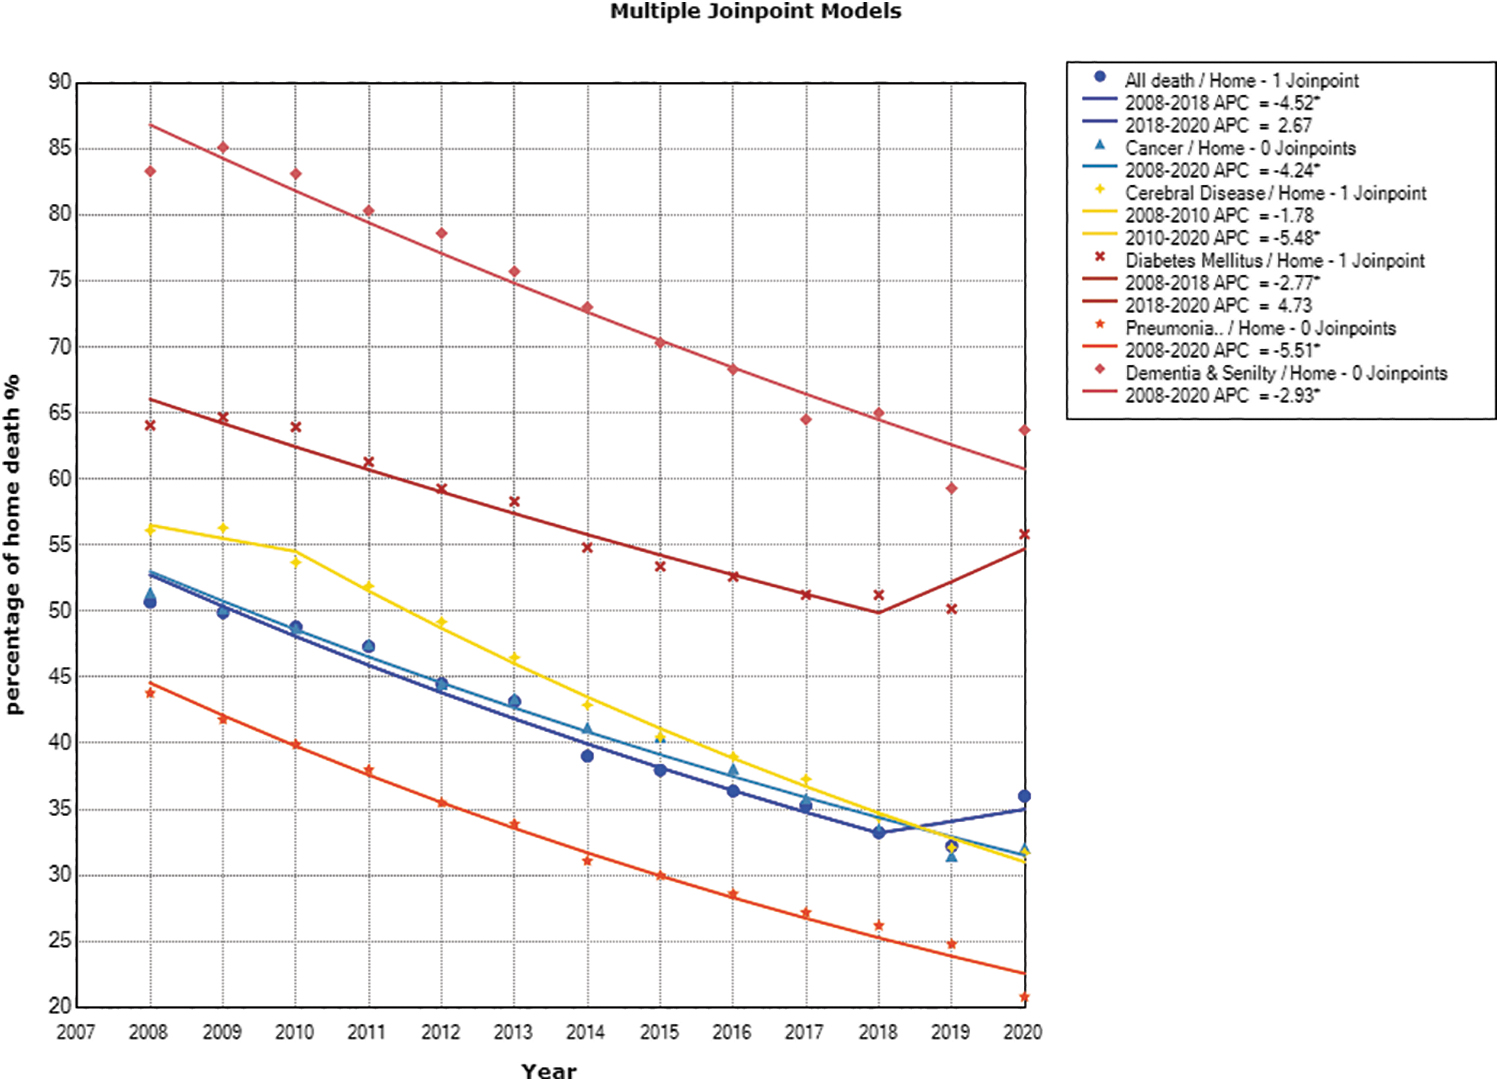
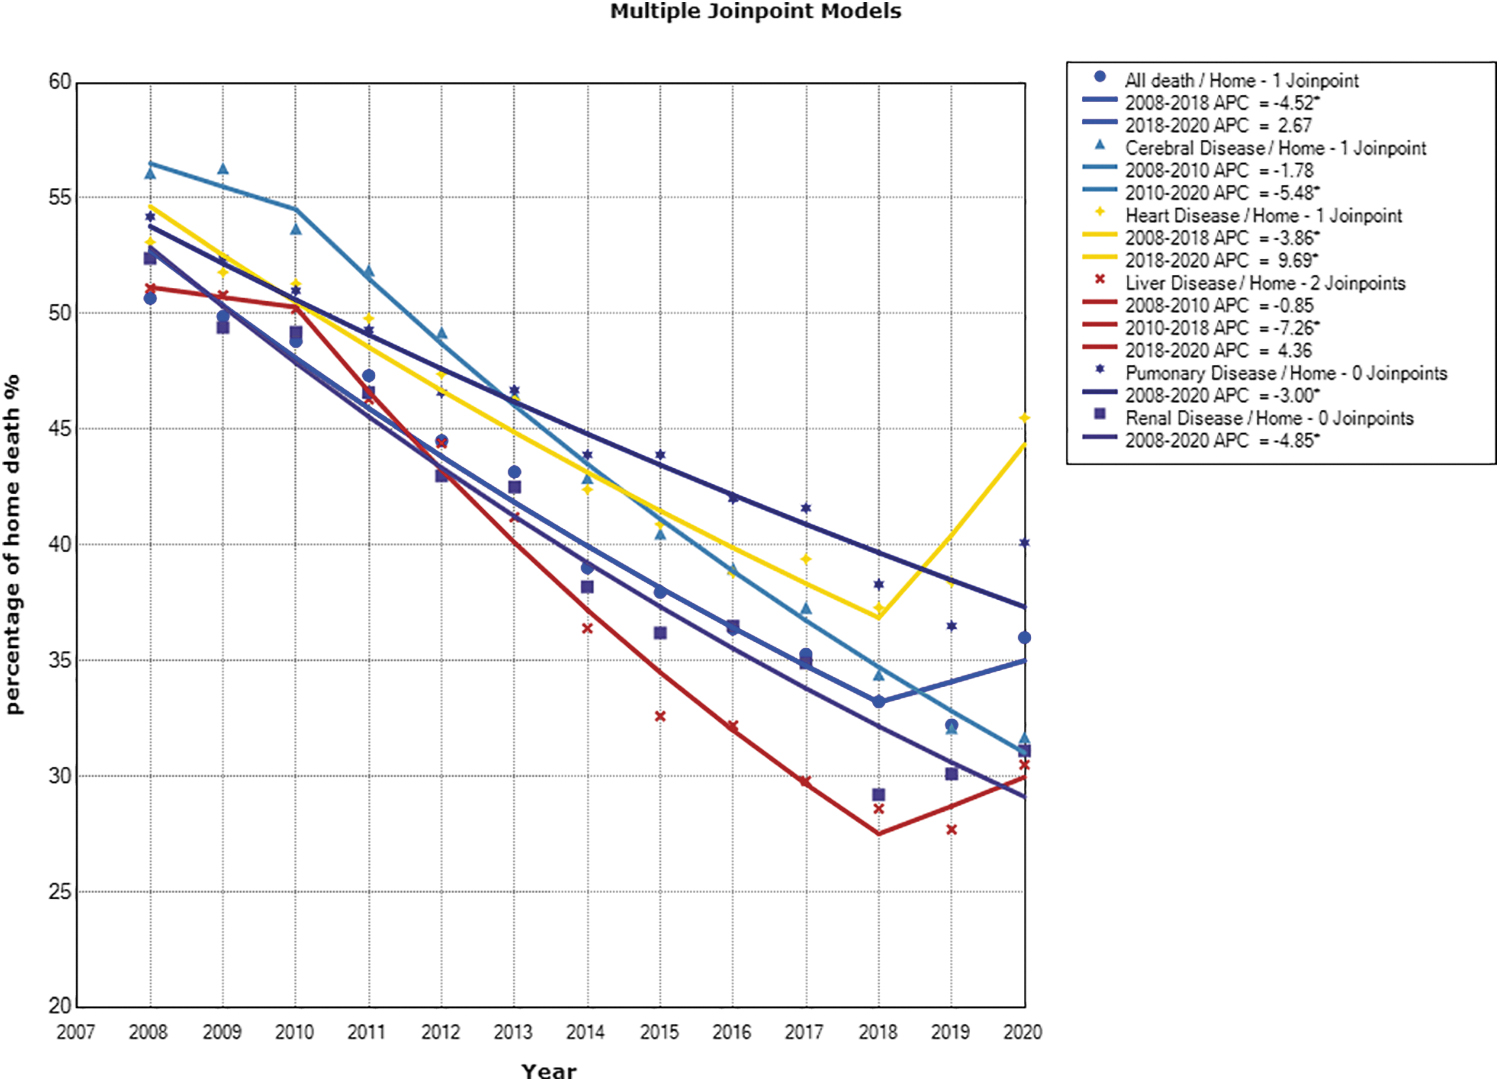
Table 3 and Figures 2 and 3 show the trend analysis of place of death. The AAPC of home deaths during 2008–2020 for all natural deaths was −3.36% (95% CI: −4.49 to −2.22). The largest change in the percentage of home deaths was discovered for people dying of pneumonia, influenza, or bronchiolitis; cerebral vascular disease; renal disease; liver disease; and malignant neoplasm, for which the AAPCs were −5.51% (95% CI: −5.99 to 5.03), −4.88% (95% CI: −5.61 to −4.14), −4.85% (95% CI: −5.51 to −4.19), −4.36% (95% CI: −6.42 to −2.26), and −4.24% (95% CI: −4.61 to −3.87), respectively.
Change in the home death among those dying from chronic organ failure in terms of percentage during 2008–2020 in Taiwan. The figure compares the trend of home deaths among those with chronic organ failure over the study period, highlighting the gradual decline in the percentage of home deaths.
Change in the home death among those dying from malignancy, cerebrovascular diseases, diabetes, pneumonia, dementia, and senility in terms of percentage during 2008–2020 in Taiwan. The figure illustrates the variation in the trend of home deaths among different disease groups over the study period, providing insights into the impact of disease-specific factors on end-of-life care and health policy.
Joinpoint Regression of Trends in Home Deaths by Main Cause of Death, 2008–2020
Indicates that the APC or the AAPC is significantly different from zero at the alpha = 0.05 level.
If the AAPC is within one segment, the t-distribution is used. Otherwise, the normal (z) distribution is used.
For the conditions for which the home death percentage was highest, dementia and senility, decreases and shifts were identified with an AAPC of −2.93% (95% CI: −3.38 to −2.48); this group also had the highest institution death rate, with an AAPC of 5.61% from 2014 to 2020. The least decrease in the percentage of home deaths during 2008–2020 was discovered for people dying of diabetes, for which the AAPC was −1.56% (95% CI: −2.41 to −0.70).
The percentage of home deaths in patients dying of heart disease tended to decrease (−3.86%) until 2018, after which it exhibited an upward trend (9.69%). A weak negative trend (−0.85%) for home deaths caused by liver disease in the first few years of the investigated period shifted to a significant negative trend during 2010–2018 with an APC of −7.26%. After 2018, there seems to have been a reversal; the percentage of home deaths increased at an average rate of 4.36% per year, but the change was not significant. No similar trends were found in other main causes of death (Fig. 3).
The change in the classification of the place of death may have influenced the trend changes. We performed a sensitivity analysis by including “nursing home or long-term care facility” in the “other location” category. The results showed that the change in classification did not significantly affect the trend changes observed in our study.
Discussion
During the study period, the places of death in Taiwan changed significantly, the AAPC for hospital deaths over the 21-year period was 2.54% (CI: 2.04 to 3.03), and the AAPC in home deaths was −2.69% (CI: −3.26 to −2.13). These changes have important policy implications for the future of health care in Taiwan. The observed change in the distribution of deaths highlights the importance of ensuring adequate support for end-of-life care in both hospital and community settings.
As more people die in hospitals, it is important to ensure that hospitals are equipped to provide the highest quality of care to terminally ill patients. This could include improving end-of-life care and increasing the availability of palliative care services. The decreasing trend in deaths at home suggests that there may be a need for policies to support end-of-life care at home. Such policies could include increasing the availability of hospice care services and facilitating family carers to provide appropriate care for terminally ill patients at home.
The high percentage of home deaths in Taiwan (60.1%) in 2000, compared with only 10%–30% in other countries, is probably a result of the country's culture surrounding death. In Taiwanese culture, if someone dies outside their home, their body will not be permitted to enter the house. This tradition motivates families to bring patients home from hospital when death is imminent, leading to a special category of patient discharge titled “impending death discharge.”
In a retrospective study of hospice care in Taiwan from 2007 to 2010, about 23.4%–30.1% of terminal patients chose impending death discharge. Their death certificates would be categorized as death at home. 20 Because our study was based on death registration certificates, identifying the proportion of such discharges was not possible. The influence of traditional customs on place of death has gradually diminished as society has become industrialized. This factor unrelated to policy may have contributed to the decrease of home death in Taiwan. Confirmation of this would require a more detailed analysis of an enrollee's last hospital admission.
The present study shows that the mortality rate increase varies by cause of death for an aging population. Because of medical advances, life expectancy has increased. The causes of natural death have changed; patients dying of malignant tumors accounted for 30.8% of all natural deaths in 2020.
Significant increases in the numbers of deaths due to chronic lung disease, heart disease, chronic liver and kidney disease, dementia, and pneumonia associated with old age have also been discovered. In view of the need for end-of-life care for patients with non-cancerous diseases, Taiwan's National Health Insurance extended hospice and palliative care to patients with chronic organ failure in September 2009 as a result of health policy adjustments.
Changes in the percentages for various causes of death during the study period reflect the effectiveness of measures designed to prevent liver and cerebrovascular disease and to control diabetes in Taiwan. However, the numbers of deaths due to pneumonia and sepsis increased each year during the investigated period. Death trends due to pneumonia may be affected by the epidemic of infectious diseases, including COVID-19.
In Taiwan, where the number of confirmed COVID-19 cases was relatively low as of December 31, 2020 (799 cases and 7 deaths), the effect of COVID-19 on pneumonia mortality may be limited. 21 The increase in deaths from pneumonia and sepsis is partly due to the aging population, but another possible reason is misclassification of cause of death. 22
In Taiwan, ∼12.95 deaths from dementia per 100,000 people occurred in 2020. This was only 3.3% of all natural deaths. Compared with other countries, Taiwan, with more than 16% of its population over the age of 65 years, is highly likely to underestimate the number of deaths caused by dementia. Some studies have reported that many patients with advanced dementia who develop pneumonia in their final days are classified as being died of pneumonia instead of dementia. 23 In future, there must be a consensus among doctors regarding the cause of death.
Community-based home integration programs in Taiwan were proposed in April 2016. The program includes increasing the payments of home visits by 1.5 times and encouraging home care medical staff to receive education and training in hospice palliative care. It is hoped that this will increase the number of professionals willing to provide hospice home visits to terminally ill patients.
The good news is that the home death rate has stopped declining and appears to have been increasing since 2018. Given that the percentage of home deaths for heart disease trended downward until 2018 (−3.86%) and upward thereafter (9.69%), the policy appears to have contributed to an increase in home deaths of patients who died of heart disease.
The percentage of home deaths due to cerebrovascular disease appears to be showing signs of reversal after reaching a low in 2018; the proportion of deaths at home has increased, but the change has not been significant. Regarding the potential impact of health policies on the observed changes in place of death trends, future studies should examine the causal relationship between health policies and end-of-life care outcomes.
Despite the increasing number of patients with dementia receiving home-based hospice care, the home death rate of patients with dementia declined from 64.6% in 2008 to 42.0% in 2020, with the AAPC being −2.93% for the investigated period. The percentage of hospital deaths for patients with dementia in Taiwan remains high at >45%.
A nursing or long-term care facility could be recorded as a place of death from 2014, however the institutional deaths accounted for only 3.8% of all natural deaths by 2020 in Taiwan. Dementia is the cause of death for which the proportion of institutional deaths is highest; except for the 13.7% and 13.6% of institutional deaths of patients with dementia in 2016 and 2017, respectively, the percentage of patients with dementia who died in institutions was lower than 10% in recent years, which is different from the trend in other countries over the past decade.9,24
A comparative study of 16 European countries found that in countries with particularly well-developed long-term care organizations, terminally ill patients had fewer hospital admissions before death and a higher share of out-of-hospital deaths. 3
To meet the needs of the elderly in an aging society, Taiwan's second national Long-Term-Care Plan (LTC Plan 2.0) was implemented since 2017. 25 LTC Plan 2.0 expanded the target groups for services and also implemented new payment mechanisms. 26 The plan focuses on subsidized community-based and home-based long-term care but does not support end-of-life care in any facility. Elderly residents living in institutions on this basis are likely to be admitted to hospital in their final days. This may be one reason for the decrease in institutional deaths over the past three years in Taiwan.
Improvements in institutional care and the ability to care for the terminally ill are key components of public health policy. Since the enactment of Taiwan's Patient Autonomy Act, people are increasingly considering dying in a long-term care facility because they do not want to burden their family in their final days. 27
As the number of people with dementia who choose to die in long-term care facilities increases, the quality of care in these facilities should become an important public health concern. There is a need to further understand the end-of-life preferences of the Taiwanese population and, in particular, to seriously consider future policies related to the care of patients with advanced dementia. 28
Strengths and Limitations
The strengths of this study include the nationwide database of death certificates and the use of joinpoint regression models for trend analysis. APC and AAPC were employed to estimate changes in place of death, providing internationally comparable values. Through the analysis, we obtained the impact of changes in policies and causes of death on the place of death in Taiwan during 2000 to 2020.
However, this study has certain limitations. ICD-10 codes were used in this study, but the validity of these cause of death categories could not be determined, especially for patients who died at home, and would be influenced by the availability of adequate clinical information to the physician certifying the diagnosis; this should be verified by linking to relevant clinical data in the future. In this study, the percentage for a place of death is a relative indicator because the percentages sum to 100%; the percentages should be used with the raw data to make appropriate inferences.
Place of death does not necessarily reflect the actual place of terminal care. In the final stage, terminal patients who have been in a long-term care facility may be transferred to and die in a hospital. Age at death is an important variable associated with hospital deaths.29,30 However, due to limitations in the original data, age at death was not included as a variable in our analysis.
The observed increase in the number of deaths in our study may be influenced by several factors, such as an aging population and limited hospital bed capacity. The likelihood of dying in a hospital setting may be affected by the total number of deaths because hospital resources are limited and some critically ill patients may not receive timely and appropriate care. Therefore, our results should be interpreted in the context of these limitations.
In addition, there were only 19 COVID-19 deaths in Taiwan in 2020. The COVID-19 pandemic led to significant changes in health care utilization and other societal factors that may have influenced mortality trends in other ways. 21 Despite these limitations, this national study has clear implications, giving insight into potential future clinical burdens, and may lead to better health policy decisions for Taiwan.
Footnotes
Authors' Contributions
M.-H.L. and T.-J.C. conceived and designed for this study; M.-H.L. carried out the analyses and drafted the manuscript; Y.-J.C. revised the manuscript; and all the authors approved the final version of the manuscript.
Funding Information
This study was supported by grants from the National Science Council (MOST 109-2314-B-075-059) and Taipei Veterans General Hospital (V110C-107).
Author Disclosure Statement
The authors declare that there are no conflicts of interest.