
Abstract
Background:
High-quality end-of-life care has the potential to improve clinical outcomes and reduce costs but is underutilized in the United States.
Objectives:
This study describes a unique partnership between an insurer and a provider to enhance the quality, availability, and access to palliative services.
Design:
A retrospective cohort analysis of insurance claims data for patients receiving palliative care compared to a matched cohort not receiving palliative care services from 2019 through 2022. Using difference-in-differences with paired t-tests, the relationship between palliative care and health care outcomes was determined.
Participants and Setting:
Highmark Medicare Advantage members in the United States, with 614 members in the treatment group matched with 614 in the control group.
Results:
Outcomes demonstrated a total savings of $4,526,408 through reductions in costs for the treatment group compared to the control group for total cost of care ($7,160, p < 0.001), inpatient stays ($5,672, p < 0.001), outpatient visits ($229, p = 0.010), professional claims ($1,243, p < 0.001), and pharmacy fills ($17, p = 0.010). The treatment group had lower skilled nursing facility ($1,049, p < 0.001) and inpatient rehabilitation facility ($216, p = 0.015) costs. The treatment group had higher rates of hospice care (83.7% in the treatment compared to 50.2%, p = 0.002) but had lower lengths of stay (four days compared to five, p < 0.001).
Conclusions:
Collaborative investment in a palliative program by a payor and provider system shows significant financial savings for an insurer when patients receive evidence-based palliative care near the end of life.
Key Message
Given the current financial pressures on provider systems and the national imperative to improve care, experience, and cost, this study tests a collaborative method between payors and providers to build a sustainable palliative program. This approach improved the quality of care for patients and reduced costs.
Background
Health care in the United States is in a clinical, financial, and operational crisis.1–3 The United States is currently the most expensive health system in the world, with $4.3 trillion in spending in 2021. 4 There is a specific high-cost population of Americans, which includes those living the last part of their lives, those with acute illness, and those who have high-cost chronic disease. 5 It is expected that the next few decades will be historic in the number of older adults living with complex diseases and an explosion of personalized treatment options.6,7 To improve the quality of care, patient and provider experience, and decrease the cost of care, there is an understanding that significant changes are needed 8 in how we deliver medical care for the chronically ill and those in the final stages of life.6,9,10 The consensus view is that this is only achievable if providers and systems are compensated for the value of the care they provide, rather than the amount of service administered, termed “value-based” care.11–13 There is evidence of models of care where value-based reimbursement (e.g., bundled payments) or risk-based capitated payments (e.g., Program of All-Inclusive Care for the Elderly) lead to improved outcomes.14,15 Although there has been some adoption of shared saving models (Medicare Shared Saving Program) and value-based contracting, standardization and implementation challenges persist due to resource restrictions and operational legacies. 12
End-of-life care has been a focus of reform due to the fragmentation, high utilization, and poor outcomes in the last years of life. Approximately 25% of all Medicare outlays are for the last year of life, unchanged over the previous 20 years.15,16 Costs at the end of life are often due to discrepancies between patient expectations and the outcome of care. Palliative care was developed in response to this mismatch between patient goals and treatment. As a foundational component of high-quality, effective health care delivery, it weighs the risks and benefits of likely treatment outcomes, including morbidity and side effects, with patients’ goals of care to influence clinical decision-making. 17 Although palliative care has been shown to reduce fragmentation, improve outcomes, and reduce expenditures, it is still underutilized nationally.18–20 Notably, not all patients who may benefit from these services are receiving palliative care. This lack of utilization may be due, in part, to a misalignment of provider incentives that reward volume of patients seen and procedures completed, traditional health system economics that do not account for value-based contribution of patient-centered and anticipatory care, and a lack of resources and options for patients who request supportive services.5,21–23
As a result of these traditional accounting methodologies,21,22,24 palliative care is often considered expensive without a “return on investment” for health care systems. For those that have invested in palliative care, there are no standard methodologies to quantify the contribution of the intervention in the overall cost of an episode of care, thereby increasing the belief that an investment in palliative care may not be sustainable financially. More recent studies have documented that hospital palliative care programs have been associated with significant cost savings.24,25 However, due to the financial complexities and traditional accounting methods, many provider systems are caught in an unfavorable economic dilemma, unable to prove the financial case. Scaling palliative care requires significant up-front investment, including infrastructure, recruiting, training, analytics, and finance. 26 This effort may take years to prove a return on investment and requires long-term commitment and stability among leadership.
This study describes a unique partnership between an insurance payor and a health care provider network to enhance the quality, availability, and access to palliative services. Due to the novelty of this collaboration and inconsistent terminology in the industries, the authors clarify verbiage used in this study as follows—“the payor” or “the plan” represents an insurance company, “health care delivery system” for providers, and patients as “members.” This study examines a cohort of members attributed to the same health insurer, allowing a link to hospital services provided during an inpatient stay and subsequent services provided by any provider to longitudinal submitted claims. In addition, the intervention in this study is provided by an inpatient palliative care service. As a result, the patient population studied is closer to the end of life than typical palliative care populations. This study uses death on hospice as an outcome not traditionally used for a palliative cohort.
This study outlines a four-year approach that included a needs assessment of a health system, investment needed, and analytic consultation to fast-track the development of a palliative service. The collaborative and unique approach allowed the team to take a holistic economic view to develop a plan that would lead to improved clinical outcomes for care recipients and decrease costs for both the provider and the payor systems. Leveraging data from these investments, this study aimed to determine whether a payor-provider partnership in care for seriously ill patients near the end of life can lead to cost savings through improved clinical care—including increased palliative consultation and hospice utilization, response to a best practice alert, and professional development of a workforce.15,27
Design
Data source
The primary data source for this retrospective cohort analysis was administrative health care claims data from Highmark Inc., a large Blue Cross Blue Shield licensee located in the eastern United States. Highmark Inc. is part of a broader integrated payor-provider health system, known as Highmark Health, that includes Highmark Inc. and Allegheny Health Network—a 14 hospital and 2600 physician health system in Western Pennsylvania.
Intervention design
A team of palliative care experts from both the payor and provider sides of the integrated health system was assembled to perform a palliative needs assessment of the provider system based on five domains, including current staffing, access to care, educational materials, information technology infrastructure, and leadership support. A business case was created that included (1) appropriate staffing levels for each hospital based on the nationally recognized guidelines; 28 (2) a timeline to provide access to palliative care in the hospital, outpatient clinic, and home; (3) evidence-based educational programs to upskill the workforce, including an online curriculum and a standardized patient-centered communication course; (4) electronic medical record updates that included flow sheets, best practice alerts, and improved technology to curate and store advance directives; and (5) dedicated time to develop key leadership roles. Within year one, the operational and financial structures were established, and eight initiatives were implemented. By the end of year 2, leading indicators provided evidence to continue the business case to achieve appropriate staffing and access.
Patient population and data collection period
The treatment group consisted of Highmark Medicare Advantage members who had their first inpatient palliative consultation at an Allegheny Health Network (AHN) hospital from January 1, 2019, to May 31, 2022. The control group was comprised of Highmark Medicare Advantage members who had a palliative-eligible admission but did not have a consult during such admission during the same time. A palliative-eligible admission was defined by having a diagnosis of incurable cancer, neurodegenerative conditions with specific comorbidities, or chronic organ failure associated with a specific utilization pattern within two years of the date of admission. Members were excluded if (a) they did not have continuous health plan enrollment six months before and through the death date, (b) they had previous history with palliative care prior to the intervention, and (c) they had anchor admissions at a post-acute care facility. A CONSORT diagram showing patient inclusion is shown in Figure 1. This study focused on members who receive a palliative consult within 30 days of death, due to the practice pattern of late consults seen in acute care facilities and the need for an adequately sized sample for analysis.
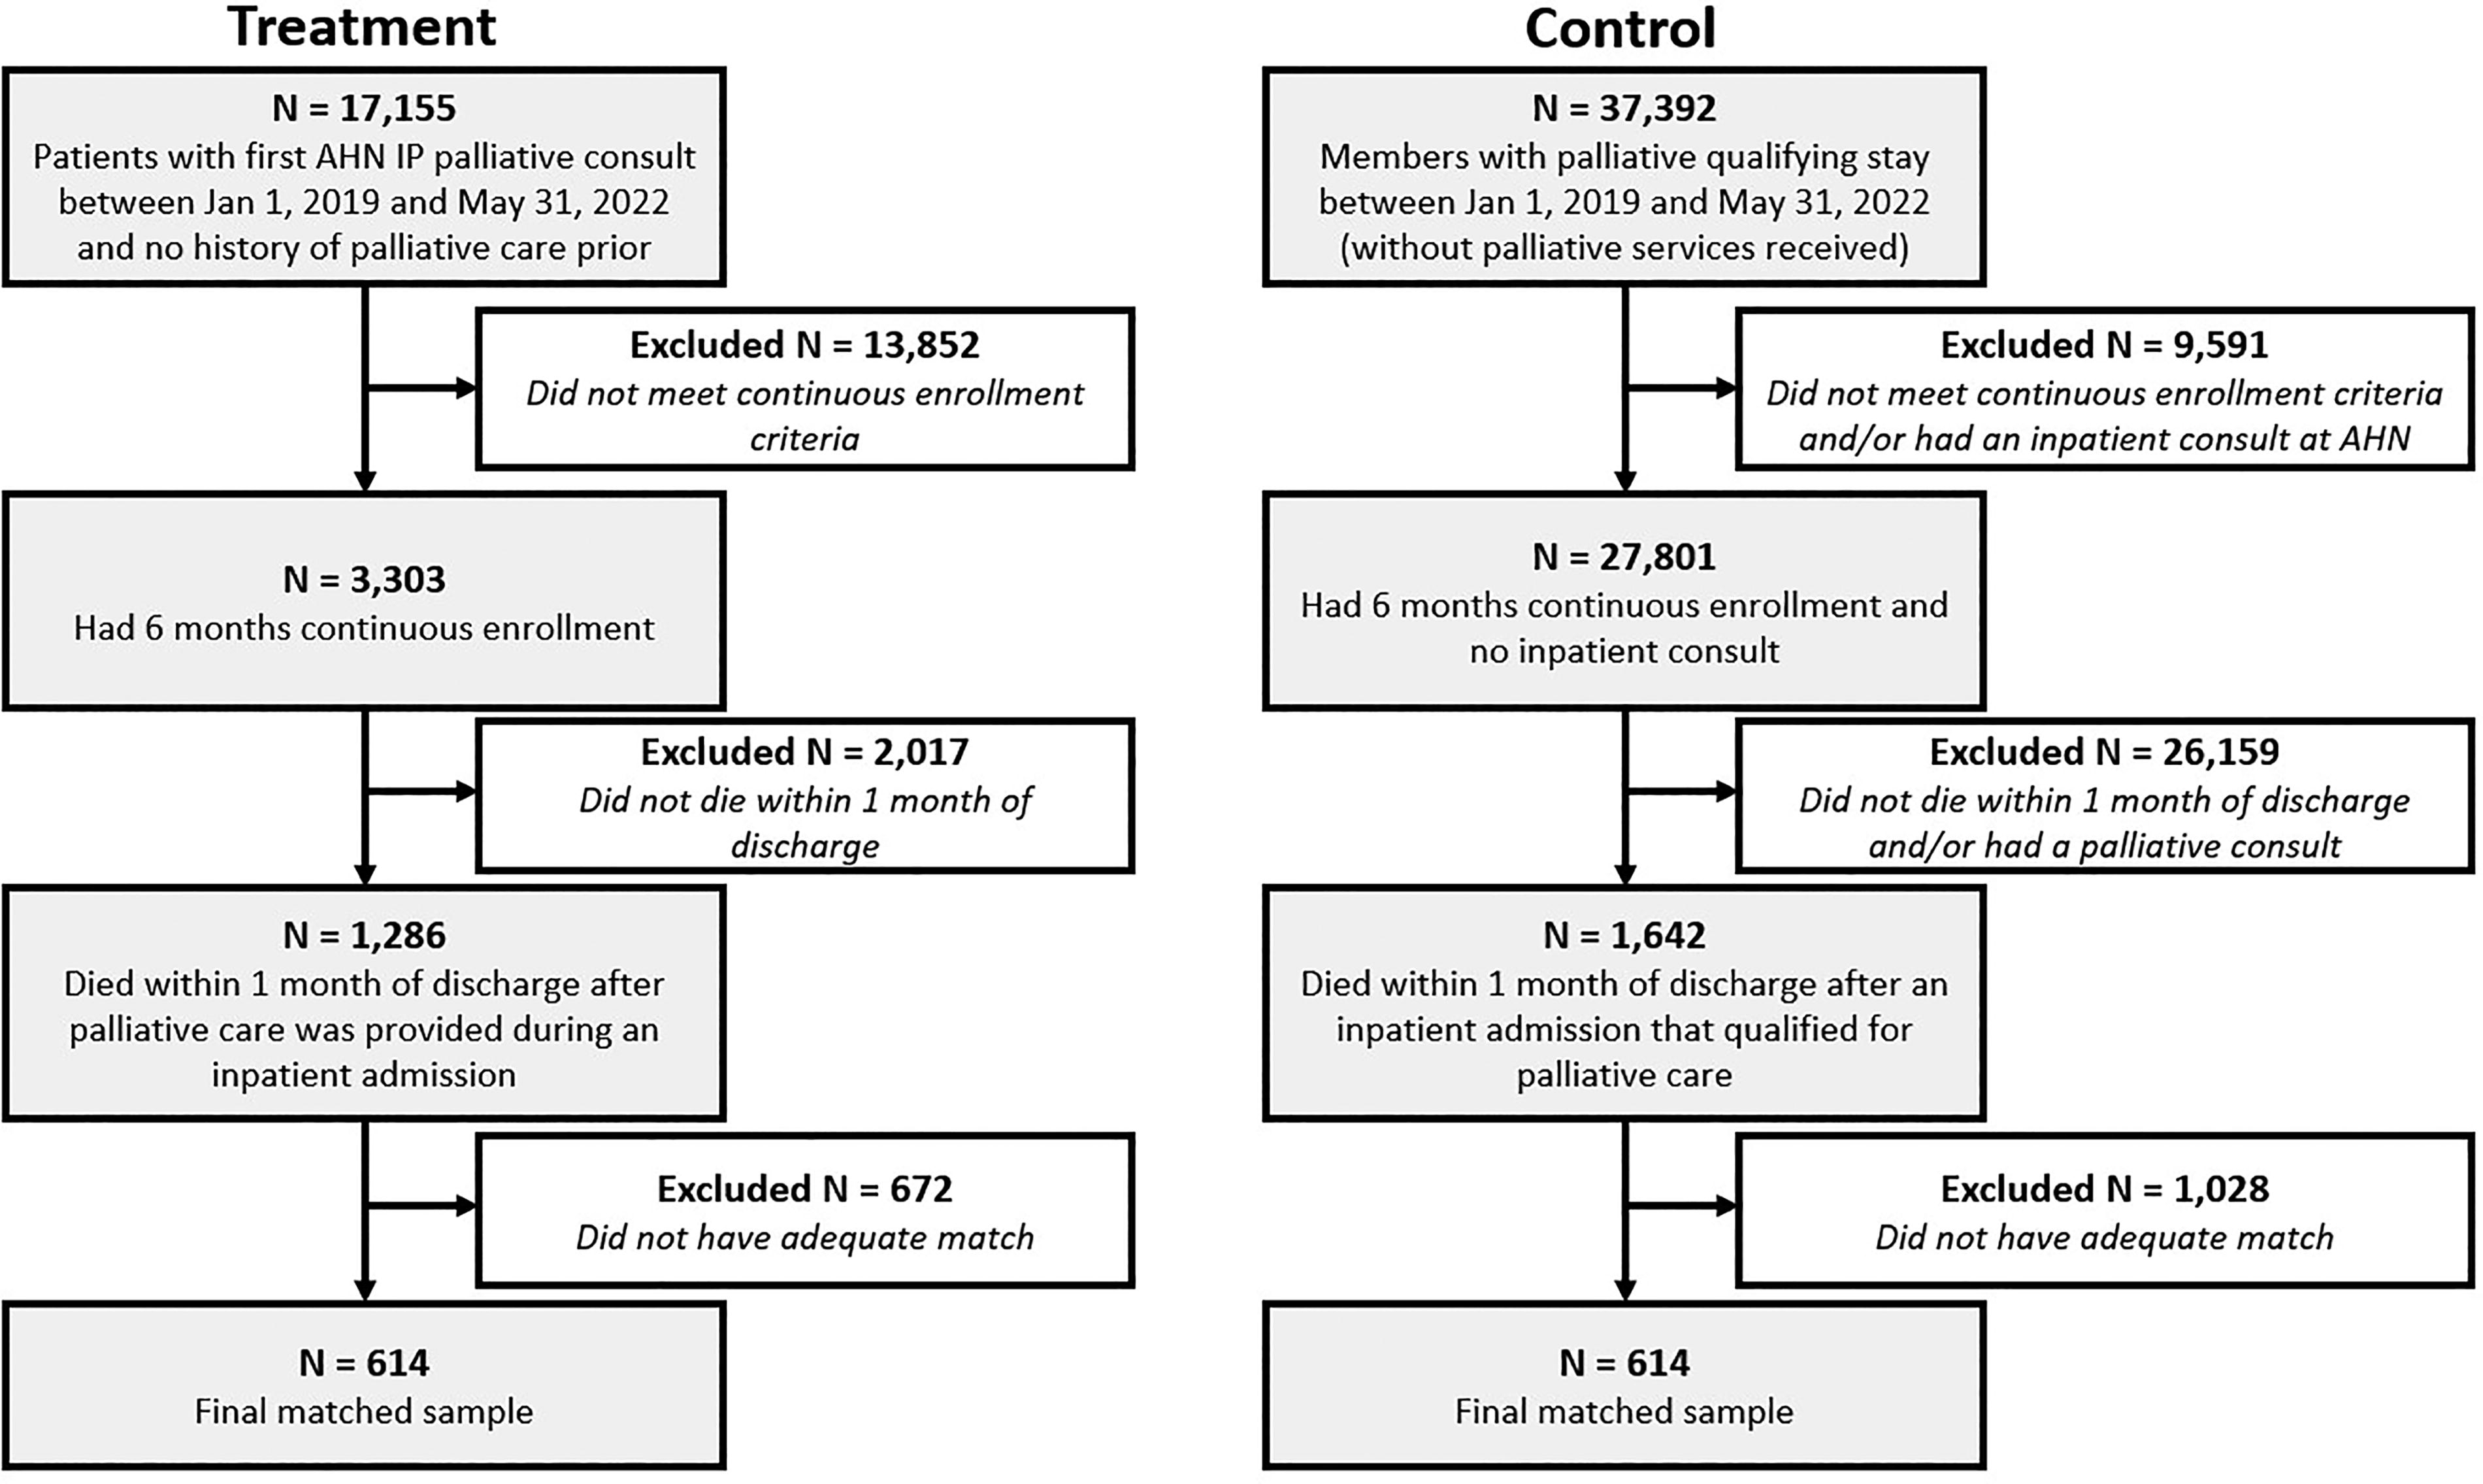
Flow Diagram Showing Selection Process.
Measures
Patient characteristics
We extracted the age, gender, region, risk scores, member conditions, social vulnerability index 29 and each Healthcare Effective Data and Information Set measure 30 for each patient. We also extracted indicators of comorbid conditions (e.g., hypertension, substance abuse, depression, dementia), indicators of COVID-19 diagnosis, indicators of baseline care management and insurance coverage, baseline levels of frailty, 31 and baseline levels of health care utilization. Lastly, we used third-party (e.g., Experian) estimates of poverty, income, education, and household conditions.
Health care and financial outcomes
Outcomes were all measured from the payor perspective using claims data. Outside of AHN, we do not have access to provider data, so we were not able to comprehensively measure patient quality outcomes. In addition, using payor data allows us to include utilization at any provider system to see all services on members’ palliative journeys. The primary outcome was the change in total cost of care per member to the insurer using negotiated allowed amounts. Allowed costs for the payor include inpatient and outpatient charges, physician fees, and drug costs, all of which were tracked separately as secondary outcomes. Inpatient costs were further separated into skilled nursing facilities, long-term acute care hospitals, and inpatient rehabilitation facilities. Of note, hospice costs are excluded, as hospice is provided as a benefit through traditional Medicare. However, hospice admissions and LOS on hospice were tracked as a proxy for quality of care in the absence of other clinical data. For each outcome, the average costs during the six-month baseline period were compared to the average costs from inpatient discharge date to death, limited to a maximum of 30 days by study design to focus on acute palliative care interventions.
Propensity score matching
Insurance claims
We used the first inpatient admission for each group (i.e., treatment and control) and performed propensity score matching on age, gender, attribution to an AHN-based primary care provider, risk scores, insurance coverage, member conditions during baseline, time from the patient’s first palliative diagnosis to the admission, social needs (Social Vulnerability Index) 29 at the time of the admission, COVID-19 diagnosis, and participation in any care management programs. Treated members were matched to control members on a 1:1 basis using a greedy matching algorithm to create pairs of observations with similar probability of treatment. The treatment-control matched pairs were included for the remaining analyses (see Fig. 1).
Data analyses
Program formation
The palliative care program was assessed on four domains, including staffing/access, leadership, education, and technology. Staffing assessed the total number of necessary full-time employees for hospital coverage to achieve 8% of admissions seen by the palliative care service. Leadership included the amount of time necessary for program administration and ongoing support. Education included the need and goals for educational courses provided and taken. Technology included the tracking of tools that enabled proper care pathways, patient identification, and data collection.
Patient characteristics and outcomes
Descriptive statistics were calculated for the patient characteristics and clinical outcomes stratified by group and were compared between groups with chi-square tests or t-tests depending on the distribution of the variable. To estimate the cost savings effect of treatment, a difference-in-differences analysis was used. We confirmed the parallel track assumption was met by inspecting plots of the outcomes over time split out by treatment and control group. To test for differences, we used unadjusted paired t-tests, and a series of adjusted linear mixed effects regression models—one for each outcome—were used. The models included interactions between time and group after accounting for the propensity score matches and baseline characteristics (i.e., comorbidities, age, and gender) were used. These additional covariate adjustments were used to further reduce any differences between the groups at baseline. Random intercepts by matched pairs and member identifier were included to adjust for matching and repeated measures. Results for total cost of care were calculated after capping outlier values. Measurements for total cost of care in the pre- and post-periods that were greater than two standard deviations above the mean were capped at two standard deviations above the mean to reduce the influence of extreme data points. This process was performed separately for the treatment and control groups and for the pre- and post-cost of care. Less than 4% of records were considered outliers and adjusted accordingly. These adjusted pre- and post-cost values were then used to calculate the change in total cost of care for that member.
Results
Program formation
The program’s administration was based in the clinical transformation office of the parent organization, Highmark Health. This structure allowed for collaboration and the appropriate administrative support to both the health plan and provider system to drive the program forward. In 2018, the provider’s palliative and supportive care division was staffed by 14 full-time employees, covering six hospitals, reaching approximately half of the required full-time employees necessary for serving 8% of the population in these hospitals. By 2022, this increased to 27 full-time employees, covering eight hospitals, which was enough full-time employees to serve 8% of the population for these hospitals. The inpatient palliative service was designed according to industry recommendations. Teams consisted of physicians, advanced practice providers, nurses, social workers, and chaplain. Visit frequency by each team member was determined by clinical need and interdisciplinary assessment and tracked by date of consultation. Table 1 highlights the training and education associated with establishing the program from 2018 to 2023. Over those years, over 14,000 online courses were taken across the health system, 365 providers were trained in communication using a nationally recognized evidence-based program, and 16 internal facilitators were trained for program sustainability. During this period, several tools were implemented to help administration of the program, including (1) electronic medical record enhancements in 2019 with flowsheets built to track data (2019); (2) best practice alert for palliative consults during an inpatient stay (2019); (2) launch of an electronic platform to create and curate physician’s orders for life-sustaining treatment (2020); and (4) best practice alert for advance care planning during the annual wellness visit based on acuity (2021).
Education and Training Counts over Time
Patient characteristics
Figure 1 shows the selection of patients and the resulting numbers after the propensity score matching procedure. Importantly, covariate balance was improved for all variables in the matching process. All absolute standardized differences were <0.1, indicating balance, except for age group (0.13) and diagnosis at index admission (0.27). Although larger than 0.1, the matching process still improved balance across age groups and the 16 possible admitting diagnosis categories, as evidenced by reductions in based on absolute standardized difference estimates compared with the unmatched sample. Furthermore, when assessing the age of the matched sample instead of age groups, a favorable absolute standardized difference of 0.035 was achieved. Matched members included 48% of observations in the treatment group; data loss was due to the inability to find a suitable match in the control group. The final sample for analyses was 614 in the treatment group matched with 614 in the control group (see Fig. 1).
Table 2 presents the patient characteristics stratified by group for the matched cohorts. As shown, there were few significant differences between the groups after propensity score matching. The only difference was in region, with the treatment group living more in the Western Pennsylvania region than the control. However, their census tract-level SDOH data show that they are from areas with similar poverty levels (9% making approximately $31,000 a year), with around 6% of the population being racial minorities and around 15% having a disability. The sample included 51% females, where the vast majority have pharmacy coverage (98%). In addition, nearly 50% have dementia, 36% have depression, 94% have hypertension, and nearly 50% have cancer (see Supplementary Table S1 for more information on comorbid conditions and social vulnerability data).
Descriptive Statistics of the Matched Sample Stratified by Group
p value based on chi-square test for categorical variables and t-test for continuous variables. Statistics reported for continuous variables are median (interquartile range). Data presented are unweighted.
Clinical and financial outcomes
Financial outcomes
Both paired t-tests and linear mixed effects regression models were used to determine cost savings and differences in health care utilization between the groups (see Table 3). Patients saw reductions in costs for the treatment group compared to the control group after matching and regression adjustment for total cost of care (adjusted $7,372, p < 0.001) and an overall adjusted savings of $4,256,408, including reductions in inpatient stays (adjusted $5,826, p < 0.001), professional claims (adjusted $1,296, p < 0.001), and pharmacy claims (adjusted $26, p = 0.010). The treatment group had significantly lower skilled nursing facility costs (adjusted $1,038, p < 0.001) and inpatient rehabilitation facility costs (adjusted $221, p = 0.015). There was no difference between groups in long-term acute care costs (adjusted $68, p = 0.490) and outpatient visits (adjusted $224, p = 0.11).
Cost Comparisons between Matched Treatment and Control Cohorts
Difference refers to the difference between (a) baseline and follow-up (column header) and (b) treatment and control (row label). Analyses are unweighted. Adjusted difference (and p value) estimated from linear mixed effects models adjusted for diabetes, coronary arterial disease, chronic heart failure, hypertension, COPD, chronic kidney disease, asthma, end-stage renal disease, cancer, osteoporosis, rheumatoid arthritis, multiple sclerosis, inflammatory bowel disease, lupus, cerebral palsy, hemophilia, cystic fibrosis, amyotrophic lateral sclerosis, thyroid, human immunodeficiency virus, depression, anxiety, other behavioral health, substance abuse, dementia, Parkinson’s disease, COVID-19, year, age, and gender.
Health care outcomes
Patients in the treatment group had higher rates of hospice care (83.7% in the treatment group compared to 50.2% in the control, p = 0.002) but had lower lengths of stay (M = 4 days compared to M = 5 days, p = 0.002). The treatment group had fewer major medical events (0.17 per member compared to 0.47, p < 0.001). There were no differences in care management between the groups during follow-up (12.1% compared to 13.2%, p = 0.547). There were no changes in pharmacy coverage between the groups (98.1% compared to 98.1%, p = 0.833). Frailty levels increased slightly for both groups, with no differences between the groups during follow-up (both groups above 99%, p = 0.705).
Discussion
Main findings
Results of this study highlight that investment in a palliative program can produce a significant reduction in the total cost of care for patients who receive evidence-based palliative care near the end of life. Particularly beneficial are cost savings for inpatient encounters with the health care system. This is likely due to the program being hospital-based, leading to increased hospice transitions, notwithstanding shorter stays. Previous work suggested similar savings (e.g., $6,900 in hospital costs, $4,908 in intensive care costs), although with a different population during the early 2000s.4,13,26,27,32 These savings across populations and time periods are noteworthy.
What this study adds
Previous work suggested that hospital systems may absorb up to 50% of costs by providing palliative care with the appropriate interdisciplinary team, 26 demonstrating a barrier to quality care when living with serious illnesses. This study presents a unique model that incorporates financial support from both payors and providers to improve access to hospital-based palliative services. This grants more affordable adoption of palliative care for providers and accelerates the ability to apply value-based care and provide care that is typically not supported through a fee-for-service arrangement to enhance the current experience for patients and families.33,34 From the payor perspective, the total cost of care has decreased for a high-risk population and has remained financially sustainable based on claims savings, demonstrating that investment in clinical solutions can transform the health care experience and lower costs. This is advantageous to members who receive goal-concordant care at the end of life, and these savings may be passed on to all members through maintenance of premiums. For this specific provider, the relationship has given hospital administration financial confidence to move forward with this transition while confronting other financial challenges. Overall, the study demonstrates how palliative care has a positive impact on achieving the triple aim, including the quality, availability, and cost of care at the end of life. This approach, taken by additional payors, is a pathway to provide palliative services to members who use high-volume hospitals with low palliative care availability.
Strengths and limitations
This study reports cost savings to the health system from the payor’s perspective using claims data. Because information on pain and non-pain symptoms, satisfaction, and caregiver experience is not consistently available for analysis from claims, future analyses will include expanded clinical data.
Propensity score matching was used to align treatment and control groups; however, unmeasured confounders may exist. The treatment group was limited to AHN facilities, prompting a greater number of control group members who reside outside of Western Pennsylvania. This was accounted for by including attribution to an AHN primary care provider and SDOH variables measured by census tract in the matching process to remove area-related imbalances. Data on hospital system specifics and their trauma certification was not available, revealing a matching limitation.
Study data included patients who accepted palliative care consult offers. Measurement restrictions prevented exposure to a difference in patients open to this approach. In addition, providers’ decision-making bias was possible for those consulting in palliative care and those who do not for clinically similar patients. Emphasizing that caution should be used before generalizing the outcome to all seriously ill patients. As health plans use a population health approach to segment their members and customize benefits, there is a subset of seriously ill patients who are open to palliative care who must be quantified and addressed accordingly. Furthermore, this cohort was matched on severity of illness, but functional decline as a predictor of hospitalization was not accounted for. 35
This study is an inpatient analysis with patients close to the end of life. As practice patterns evolve and more members receive care earlier in their clinical journey, future analyses can investigate the impact of palliative care on members with longer survival lengths. It could be valuable to assess the financial and empirical impact of palliative care initiated early and consistently in patient-centered health care. As the program matures and early consult volume increases, it is critical to consider long-term influences on clinical experience, utilization, and cost.
Conclusion
There is increased pressure on health systems to build services that were traditionally not adequately reimbursed in a “fee for service” model but develop significant value-add in cost and experience as payment reforms evolve. This model demonstrates the potential of a holistic economic view, integrating savings to the provider and payor when calculating revenue generation and savings for a palliative program. Given the current financial pressures on provider systems and the imperative to lower costs and improve quality, our data demonstrates a creative and collaborative method for payors to support the foundational work required to create sustainable palliative programs. Partnerships with payors are a way to accelerate the growth of palliative programs and emphasize the positive impact on members, providers, and payors. Further study and responsible policies are essential for rapid growth, and outside investments lead to consistent, high-quality clinical outcomes and evidence that early intervention produces the same desired outcomes.
Footnotes
Acknowledgments
The authors want to acknowledge both Justin Engleka, CRNP, and Neha Goel, BA for their work in concept implementation and tracking. Their work drove the integration of many of the solutions and drove adoption of the model across theenterprise.
Dr. Elizabeth Chow and the AHN Division of Supportive and Palliative Care for their dedication and excellent patient care.
Data Management and Sharing
Data used for this study include private medical information and proprietary administrative data that cannot be shared publicly by Highmark Health’s data governance and Allegheny Health Network’s Institutional Review Board.
Ethical Considerations
The study was approved by the Allegheny Health Network’s Institutional Review Board.
Authors’ Contributions
E.J.: Substantial contribution to the concept or design of the work, drafted the article, approved the version to be published, and have participated sufficiently in the work to take public responsibility for appropriate portions of the content. E.H.: Substantial contribution to the concept or design of the work, acquisition, analysis or interpretation of data, revised the article critically for important intellectual content, approved the version to be published, and have participated sufficiently in the work to take public responsibility for appropriate portions of the content. A.A.: Acquisition, analysis or interpretation of data, revised the article critically for important intellectual content, approved the version to be published, and have participated sufficiently in the work to take public responsibility for appropriate portions of the content. A.S.: Acquisition, analysis or interpretation of data, drafted the article, approved the version to be published, and have participated sufficiently in the work to take public responsibility for appropriate portions of the content. A. H.-H.: Substantial contribution to the concept or design of the work, acquisition, analysis or interpretation of data, revised the article critically for important intellectual content, approved the version to be published, and have participated sufficiently to take public responsibility for appropriate portions of the content. T.B.: Acquisition, analysis, or interpretation of data, drafted the article, approved the version to be published, and have participated sufficiently in the work to take public responsibility for appropriate portions of the content.
Author Disclosure Statement
No competing financial interests exist.
Funding Information
No funding was received for this article.
References
Supplementary Material
Please find the following supplemental material available below.
For Open Access articles published under a Creative Commons License, all supplemental material carries the same license as the article it is associated with.
For non-Open Access articles published, all supplemental material carries a non-exclusive license, and permission requests for re-use of supplemental material or any part of supplemental material shall be sent directly to the copyright owner as specified in the copyright notice associated with the article.