
Abstract
Background:
Other than skin cancer, breast cancer is the most common cancer in the United States. Lower uptake of mammography screening is associated with higher rates of late-stage breast cancers. This study aims to show geographic patterns in the United States, where rates of late-stage breast cancer are high and persistent over time, and examines factors associated with these patterns.
Materials and Methods:
We examined all primary breast cancers diagnosed among all counties in 43 U.S. states with available data. We used spatial cluster analysis to identify hot spots (i.e., spatial clusters with above average late-stage diagnosis rates among counties). Demographic and socioeconomic characteristics were compared between persistent hot spots and those counties that were never hot spots.
Results:
Of the 2,599 counties examined in 43 states, 219 were identified as persistent hot spots. Counties with persistent hot spots (compared with counties that were never hot spots) were located in more deprived areas with worse housing characteristics, lower socioeconomic status, lower levels of health insurance, worse access to mammography, more isolated American Indian/Alaska Native, Black, or Hispanic neighborhoods, and larger income disparity. In addition, persistent hot spots were significantly more likely to be observed among poor, rural, African American, or Hispanic communities, but not among poor, rural, White communities. This analysis includes a broader range of socioeconomic conditions than those included in previous literature.
Conclusion:
We found geographic disparities in late-stage breast cancer diagnosis rates, with some communities experiencing persistent disparities over time. Our findings can guide public health efforts aimed at reducing disparities in stage of diagnosis for breast cancer.
Introduction
Other than skin cancer, breast cancer is the most common cancer in the United States. The 5-year relative survival rate among women with breast cancer has trended upward over time among all population groups. 1 Improvements in breast cancer survival reflect advances in treatment, as well as in early diagnosis of cancers as a result of public health initiatives for screening.
Breast cancer screening reduces breast cancer mortality by increasing detection of cancer at earlier stages when it is easier to treat. 2 Lower uptake of mammography screening is associated with higher rates of late-stage breast cancers and higher morbidity and mortality rates. 3 Women diagnosed with breast cancer at regional stage have a 5-year survival rate of 82.3%. However, the 5-year survival rate among women diagnosed with distant disease is only 24.5%. 4 In a national study covering most breast cancer cases from 2004 to 2009, 31% of new cases were diagnosed at a late stage, defined as regional or distant disease, where the overall burdens of higher morbidity and mortality rates are worse. 5 Rates of late-stage diagnoses for breast cancer in the United States vary across states, 5,6 and those states with higher percentages (34%–36%) of late-stage diagnoses during 2004–2009 were Texas, Arkansas, Oklahoma, Louisiana, Mississippi, Alabama, and Utah. 5
Understanding features of the geographic locations where rates of advanced stage diagnoses are high and persistent over time can help identify areas where increased breast cancer control efforts might be targeted. Previous geographic studies, which have ranked states in terms of late-stage breast cancer diagnosis rates, examined the geospatial predictors of late-stage rates in multilevel models, and provided data about places where the predicted rates are higher (in the upper quantile) across the United States. 5,7 We focus on late-stage (regional and distant stage combined) diagnosis rates and identify U.S. counties where rates of late-stage breast cancers are high and persistent over time during two periods (2004–2009 and 2010–2014). We used actual, not predicted, rates to define these areas across most of the United States. This research is unique in its methodology and comprehensive in its geographic scope given available data on official cancer statistics from the U.S. government. The results are descriptive, not confirmatory, and suggest regions where further study may be warranted to explain underlying causal mechanisms.
Materials and Methods
Data sources and measures
We examined breast cancer data from the United States Cancer Statistics (USCS) database during two intervals (2004–2009 and 2010–2014). The USCS database is a population-based surveillance system of cancer registries providing the official government statistics on cancer. 8 The USCS database includes information on demographics (age, sex, race, and ethnicity), tumor characteristics, and geographic location (U.S. county) of residence at the time of diagnosis. We received access to county geocodes approved to researchers (for only 43 states) who perform their analyses at a National Center for Health Statistics Research Data Center. 9 Seven states (Kansas, Missouri, Illinois, Michigan, Minnesota, Hawaii, and Alaska) and Washington, DC were excluded from the analysis because county-level data were not available.
All women who had a first primary diagnosis of breast cancer were included in the analysis. About 5% of cases with unknown cancer stage and <1% that were identified by death certificate and autopsy only were excluded. After case exclusions, the study included 1,073,595 cases during 2004–2009 and 957,348 cases during 2010–2014. These breast cancer cases were diagnosed in 2,599 counties within the 43 states.
The outcome variable of interest was the rate of late-stage breast cancer cases diagnosed in each county of the 43 states included in the study. County was the smallest geographic unit permissible to study with these restricted USCS data. Rate of late-stage diagnoses was defined by combining cases classified as regional or distant. The USCS database used the Collaborative Stage Data Collection System to derive the Surveillance, Epidemiology, and End Results (SEER) Summary Stage 2000 for diagnosis years 2004 and later, 10 which we also used to assess our outcome. The late-stage breast cancer rates examined were the percentage of regional stage and distant stage disease combined out of all breast cancer cases in each county.
We added multiple, county-level, contextual (county-related socio-ecological conditions) factors derived from various sources to the USCS data and described them in Table 1. These factors were used to assess whether counties identified as high-rate clusters (hot spots) that persisted over time were different from counties not identified as persistent hot spots. Two variables reflect access to breast health care: the number of registered mammography facilities per capita adult women and the percentage of the adult population aged 40–64 years without health insurance. We also included population density as a robust measure of the location of counties in relation to the urban–rural continuum.
Definitions and Sources of All Measures and Factors Used in Analyses of Geographic Disparities in Late-Stage Breast Cancer Diagnosis Rates
BC, breast cancer; AI, American Indians; AN, Alaskan Natives; API, Asians/Pacific Islander; SAHIE, Small Area Health Insurance Estimates.
The diversity index was included to reflect the extent of segregation into cultural enclaves within census tracts. This measure, as originally defined by Massey and Denton, 11 varies from 0 (perfectly even: all subunits/tracts have the same racial and ethnic residential composition as the larger area) to 1 (perfectly uneven: all subunits/tracts have only one population group). In addition, we included isolation indices, defined for each race or ethnicity according to Massey and Denton. 11 These measures reflect the likelihood that members of a specified race or ethnicity come into contact with other members of the same race or ethnicity, and range from 0 to 1. A “zero” would indicate no likelihood of contact with others of one's own race or ethnicity, whereas a “one” would indicate highly likely contact, based on residential race or ethnic patterns (not actual contact information). This variable is continuous with the likelihood ranging from 0 to 1. We also examined housing characteristics and county typology codes describing different types of living and economic environments. Additional examined characteristics included area poverty, persistent poverty, and measures for uninsured and unemployed adults. Persistent poverty identifies counties that have remained poor for two decades and reflects a more pervasive measure than a simple poverty rate at a single point in time.
Analytic methods
For the analysis, we combined regional and distant stage to identify U.S. counties where rates of late-stage breast cancers are high and persistent over time, and examined factors associated with these patterns. We first used the Global Moran's Index (Moran's I) test to identify clusters of counties with higher than average rates of late-stage breast cancer diagnoses among areas of the 43 states. Positive spatial autocorrelation shows that closer places are more similar to one another than to places farther away. A positive Moran's I test indicates that there is some clustering somewhere in the data.
A Moran's I statistic indicating clustering is followed by using GeoDa software (version 1.12) to do an assessment of local spatial autocorrelation patterns with Local Indicators of Spatial Association (LISA) tests. These tests, described by Anselin, 12 were used to identify hot spots where the observed rate in each local area was higher than the expected rate. The LISA test statistics were calculated for each county and period to identify the locations of clusters of counties with either higher or lower late-stage breast cancer rates than the average of all the counties included in the analysis. We performed the cluster analyses by using a p-value of <0.01 and used a “queen” contiguity matrix to describe all adjacent counties with boundaries or vertices coinciding with the county in question.
GeoDa's LISA test results identified the counties located at the center of each multicounty cluster only by using mapping and internally created categorical variables. The GeoDa map results traditionally show the high-rate (hot spot) and low-rate (cool spot) cluster centers (Maps in Fig. 1a, b). However, the full spatial clusters include both the center and the adjacent counties, defined by the Queen contiguity-based weights matrix as spatial neighbors. 12 To capture the full cluster, we used the Queen weights (consistent with other studies) 13 to create an indicator variable for every neighboring county around the cluster center. Although only cluster centers are given in Figure 1a and b, the full cluster is given in Figure 1c.
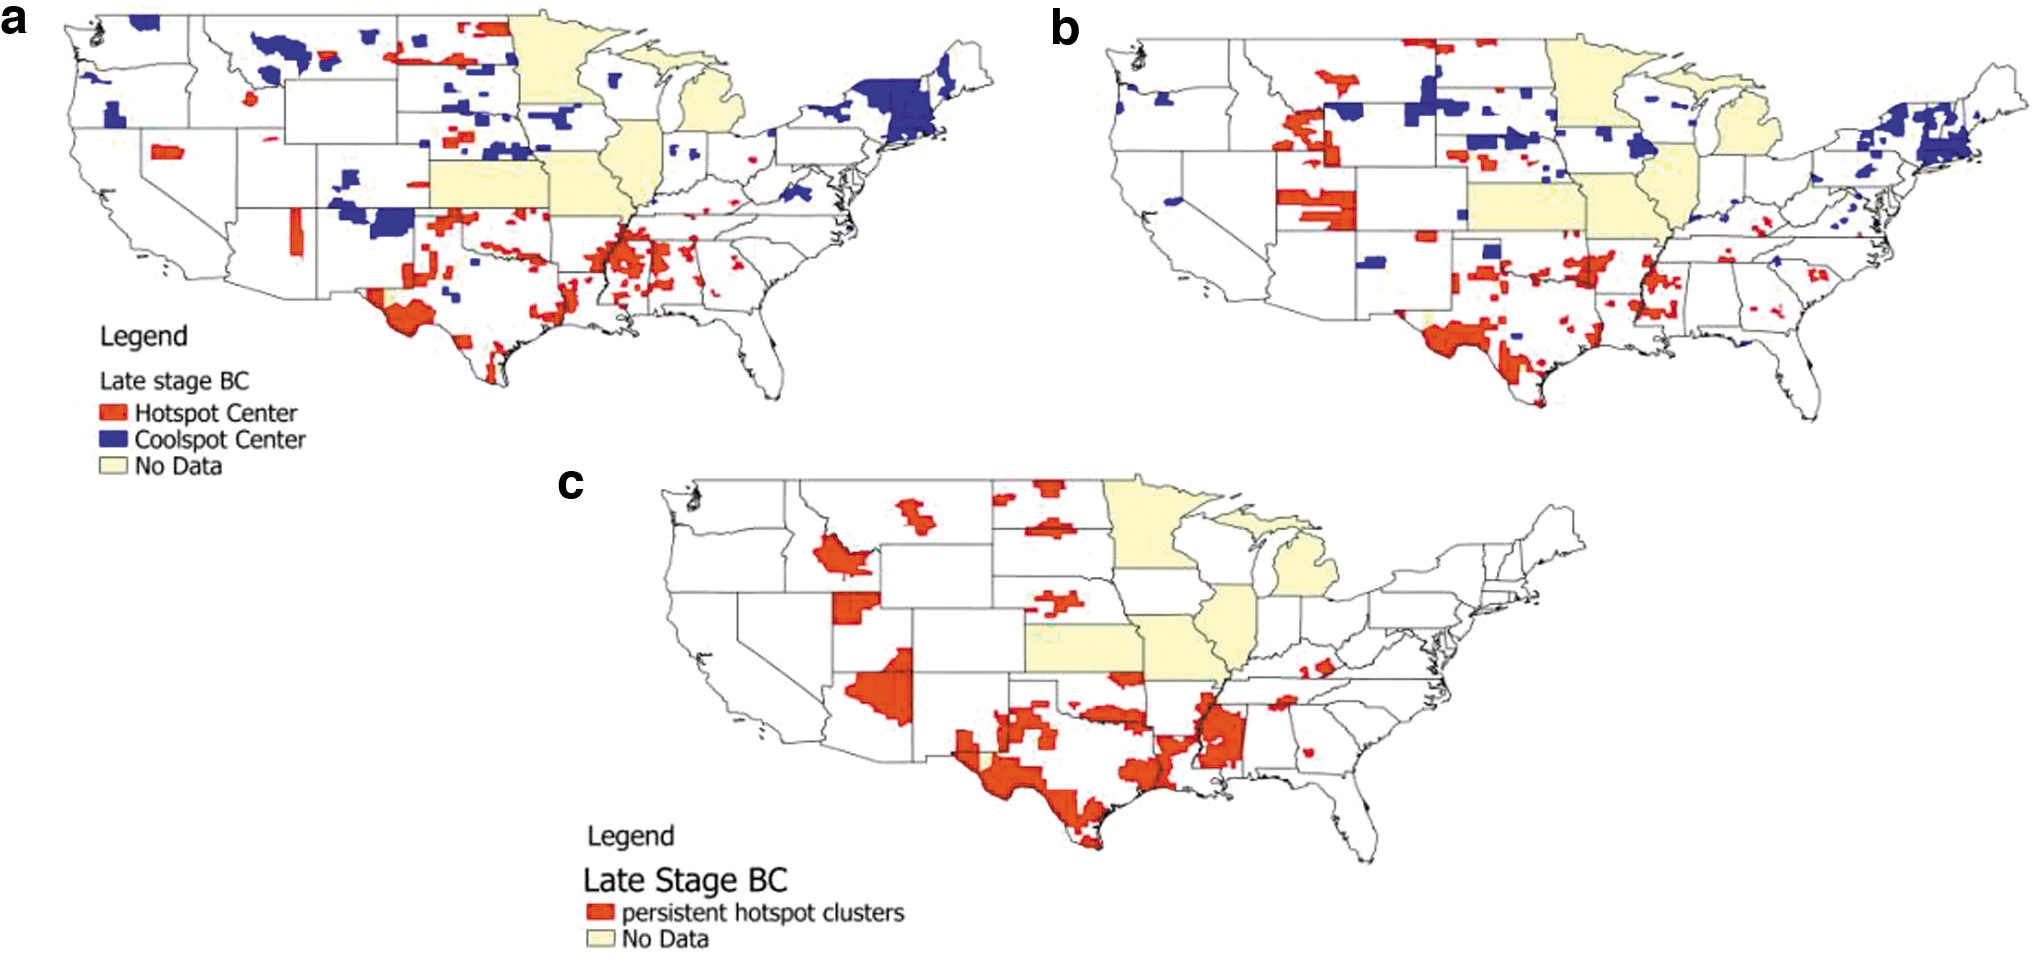
Geographic disparities in clustering of late-stage.a Breast cancer diagnosis rates and their persistence over time.
To examine temporal trends in the spatial clustering of the outcome rates, we compared the full set of counties identified as the local clusters during 2004–2009 with those during 2010–2014. Counties that were part of a hot spot during both periods were classified as being persistently high. Similarly, counties with no spatial cluster during both spans were classified as persistently nonclustered.
Persistent hot spots were compared with areas where there were no hot spots during either period (always vs. never a hot spot) by using the county-level contextual factors. To assess differences among local areas, we compared the means of the proportions of the contextual factors' characteristics among counties with persistent hot spots with those that were never hot spots. The contextual factors in these comparisons were performed only with data from the period 2010–2014 (e.g., using the later period Diversity Index rather than earlier period Index). Results using the earlier period for contextual factors were qualitatively the same. For each factor, differences in the proportions or percentages across the two area types for late-stage breast cancer were assessed with the simple t-test of two sample means assuming unequal variances. 14 The t-statistics themselves are a standardized difference. 15 Thus, the larger test statistics reflect greater standardized changes more so than smaller results.
Results
Hot spot maps
The Global Moran's I statistics were all statistically significant, indicating that there were pockets of local spatial autocorrelation (clustering) over the geographic area for late-stage stage breast cancer outcome and during both periods (p < 0.01). In other words, the significant Moran's I test indicates that there was spatial correlation among some neighboring counties but does not indicate where these counties are located. Over the geographic area, there was no spatial dependence (i.e., null hypothesis), which we rejected with a significance level of <1%. LISA statistics that were performed found many hot spots and cool spots in the outcome of late-stage breast cancer. Maps (Fig. 1a, b) for each period show abundant hot spots. The centers of the spatial clusters in these maps are depicted with counties colored red (hot spot center) and blue (cool spot center). Persistent hot spots (i.e., counties that were hot spot members during both periods) and their spatial neighbors (i.e., the entire cluster), are given in Figure 1c.
Following these results, we focused on the hot spots. We examined differences between “never” hot spots and “always” hot spot clusters by comparing means across contextual variables. We used a standard t-test statistic. The classification of clustered counties as “never” or “always” was based on whether they were present in the two intervals (2004–2009 and 2010–2014).
The difference between the mean values was calculated by subtracting the mean of the “always” group from the mean of the “never” group and performing a two-sided test for equal means. A negative t-test statistic indicates that a “never clustered” counties mean was lower than an “always clustered” counties mean. A positive test statistic indicates that a “never clustered” counties mean was higher than an “always clustered” counties mean. No statistically significant difference between means of contextual variables is indicated with a shade of gray.
Results for late-stage breast cancer are given in Table 2. Counties that were persistent hot spots had higher concentrations of American Indian and Hispanic women and lower concentrations of non-Hispanic white women in the breast cancer sample than counties that were never hot spots. Compared with counties that were never hot spots, counties in persistent hot spots had higher concentrations of adults with no high school or equivalent education and lower concentrations of people with graduate or professional degrees. These counties also had higher isolation indices for African Americans and Hispanics and lower isolation indices for non-Hispanic Whites, Asians, and Pacific Islanders. In addition, persistent hot spot counties had higher income disparity, higher concentrations of poor English language ability, and higher percentages of uninsured individuals. In addition, mean mammography facilities per capita and penetration of managed care insurance were lower in persistent hot spots. Persistent hot spots were also more likely to be persistently poor counties, with higher poverty levels and higher proportions of poor, rural African Americans or poor, rural Hispanics; to have lower proportions of poor, urban non-Hispanic Whites; to have proportionately more crowded housing; to have proportionately more emphasis on farming; and to have higher population loss to outmigration (a signal of decline).
t-Tests a of Equal Means of County Descriptive Variables Over Two Groups of Counties that Reflect Different Area Types As Regards Hot Spots for Late-Stage Breast Cancer
All two-sided t-test statistics are significant at p < 0.01, unless bolded values.
SD, standard deviation.
Discussion
There were two key contributions of this study. (i) Of the 2,599 total counties examined, there were 269 counties identified as persistent hot spots and 1,800 counties identified as never being a hot spot for late-stage breast cancer diagnoses. (ii) Inhabitants of counties with persistent hot spots (compared with counties that were never hot spots) were located in significantly more deprived areas with worse housing characteristics, lower socioeconomic status, lower levels of health insurance, worse access to mammography, more isolated American Indian/Alaska Native, African American, or Hispanic neighborhoods, and larger income disparity.
This study examined a broader range of socioeconomic conditions than seen in previous literature, and results suggest that deprivation, lower levels of health insurance, and worse access to mammography are more prevalent in areas with higher rates of late-stage diagnoses. The findings are consistent with previous findings from existing studies. Existing studies have identified both personal and contextual risk factors related to late-stage breast cancer diagnosis, focusing on one or a few states. These factors included race or ethnicity, being unmarried, having fewer routine health care visits, having more comorbidities, being older, lower use of mammography screening, and being insured under Medicare fee-for-service as compared with Medicare managed care plans. 16 –25
Area-level contextual factors in the literature have included lower household income and educational attainment. 19 –22 A study by Haas et al. 26 reported that residential isolation of racial or ethnic groups in combination with area-level income mediated the likelihood of a late-stage breast cancer diagnosis among older women across the SEER program populations. Specifically, researchers found that African American or Hispanic women who lived in low-isolation and low-income areas (i.e., below 75th percentile isolation and median income of <200% of the federal poverty threshold, respectively) have a higher probability of a late-stage breast cancer diagnosis than non-Hispanic White women.
Previous studies used a combination of traditional multilevel analysis and mapping to show geographic areas that have higher risk of late-stage breast cancer. 27 –31 For example, Gumpertz et al. 28 found that, in Los Angeles County, advanced breast cancer diagnoses were more likely among areas that had a larger proportion of racial or ethnic groups or low-median household incomes. A study by MacKinnon et al. 29 used spatial cluster analysis to identify areas with higher than expected incidence of late-stage diagnosis. They then used logistic regression on the binary area type (clustered, not clustered) to examine associations between these variable and contextual factors. They found that areas with severe or near poverty and lower mammography use were more likely to be located in the clusters of higher-than-expected incidence of late-stage breast cancer.
Similarly, several recent articles have used multilevel modeling with characteristics of residential isolation by race or ethnicity to predict counties with the largest late-stage breast cancer diagnosis rates. 7,32,33 These rankings and underlying data can be used to identify places with greater need for additional study and potential for evidence-based intervention. Other studies focused on the effect of residential segregation, 34 variations across the states, 5 and how both residential segregation and state-level regulations help predict late-stage breast cancer incidence. 7 In general, the national-level effect estimates 7 masked the underlying variability found when examining states separately for evidence of isolation effects within states. 34 The spatial analysis performed in this article also highlights the local variability.
There are limitations to the research conducted here related to the requirements and sufficiency of cancer data available to researchers. However, we use the most comprehensive, population-based, geographically explicit data available. There are restrictions on the use of the data and reporting of results, and the county is the smallest geographic level defined. Lists of counties identified or drawing of actual county boundaries in maps is prohibited. Using a smaller or larger geographic unit would produce different patterns of clusters with the LISA test method. Thus, results are sensitive to the geographic units available for analysis.
The main limitations of many previous studies of late-stage breast cancer diagnoses are related to their limited geographic scope. Our study limitations include the exclusion of seven states because of the lack of permissions to use county-level descriptors in their outcomes data. The LISA local spatial clustering statistics highlight clusters with high rates of late-stage breast cancer diagnosis relative to the complete set of counties in the data set. Thus, it is possible that adding some or all the missing states would change the observed patterns of spatial clusters.
In addition, this study is descriptive rather than confirmatory, and proposes no causal structures. However, the scope of this study is wider than most other studies conducted to date in terms of the factors studied. The proper interpretation of these factors is as a group of descriptors that characterize those places with persistent hot spots. Ranking of the likely effects of various factors is beyond the scope of the methods used here and would require multivariate modeling.
Given these limitations, the availability of population-based cancer data spanning decades and covering expansive geographies and geographic detail represents a valuable resource. We hope this article will encourage other researchers to use these data. Future work might explore drivers of higher rates in hotspot areas, including possible differences in screening and follow-up.
Conclusion
We found geographic disparities in late-stage breast cancer diagnosis rates, with some communities experiencing persistent disparities over time. Results from this study can be one of several tools to guide the design and implementation of plans by state and local cancer control programs to prevent and control late-stage breast cancer. This information can be used in combination with other data for organized breast cancer screening programs, such as the National Breast and Cervical Cancer Early Detection Program, whose aim is to provide low-income, uninsured, and medically underserved women access to timely breast and cervical cancer screening and diagnostic services. 35 Identifying hot spots and persistent hot spots for late-stage stage breast cancer among certain communities can enhance public health initiatives to identify and diagnose breast cancer at earlier stages.
Footnotes
Acknowledgments
The findings and conclusions in this article are those of the authors and do not necessarily represent the official position of the National Cancer Institute, the National Institutes of Health, Georgia State University, or the Centers for Disease Control and Prevention.
Author Disclosure Statement
No competing financial interests exist.
Funding Information
Funding support for L.R.M. was provided by the Center for Disease Control and Prevention (Interpersonal Agreement No. 16IPA1604431). The National Program of Cancer Registries contributed funds to cover the standard Research Data Center fees for researchers conducting analyses under approved research projects. Funding support was also provided for data development by L.R.M. under a National Cancer Institute Grant (2R01CA126858).