
Abstract
Although many explanations have been proposed for drug resistance to isothiazolones, the scope of cellular and physiological changes associated with this resistance remains unclear. In this study, comparative proteomic profiles of Pseudomonas aeruginosa ATCC9027 (WT) and an induced strain of Pa-R, which showed resistance to Kathon (a type of isothiazolone), were characterized using two-dimensional electrophoresis and matrix-assisted desorption/ionization time-of-flight mass spectroscopy. The results showed that a total of 16 proteins were successfully identified, among which 5 proteins were upregulated and 11 proteins were found to be repressed in Pa-R. At the same time, there were 14 proteins that contributed to metabolic processes, 1 protein (ATP-binding component of ATP-binding cassette [ABC] transporter) was the cellular component, and 1 protein (LolA) exhibited a transporter activity. The respective gene expression patterns of all the identified proteins in both Pa-R and WT were also evaluated by quantitative real-time polymerase chain reaction and shown to consistently correlate with those deduced from the proteomic results. Moreover, the resistant levels of Pa-R and WT could be affected by temperature and pH. Additionally, Pa-R exhibited coresistance and cross-resistance to other types of antimicrobial agents. Our results suggest that the resistant levels of P. aeruginosa to isothiazolones could be affected by extracellular factors and the resistance features are a complex system.
Introduction
P
Isothiazolones, such as benzisothiazolone (BIT), N-methylisothiazolone (MIT), and 5-chloro-N-methylisothiazolone (CMIT), are heterocyclic chemical compounds and widely applied to control bacteria, 43 fungi, 54 and algae 29 in industrial, medical, and agricultural settings. 60 Isothiazolones were thought to interact oxidatively with accessible thiols such as glutathione and cysteine within the cells 15 resulting in inhibition of metabolism and loss of viability. 57 Most of 14 C-radiolabeled isothiazolone biocides were uptaken into bacteria or yeast and distributed in the cell envelope, but failed to demonstrate specific target proteins for the biocides. 13 In addition, it has been proven that transferases, oxidoreductases, isomerases, ligases, hydrolases, growth factor receptors, 31 or even mouse fibroblast cells 1 can be inhibited by these microbiocides (summarized in Table 1).
It has been proposed that outer membrane proteins (OMPs) contribute to isothiazolone resistance. A 35 kDa OMP was detectable in wild cells of P. aeruginosa but not in isothiazolone-resistant ones. 7 Similarly, a mass of about 42 kDa OMP, which was believed to be a porin (known as OprD), was missing in methylchloroisothiazolone (MCI)-resistant isolates of P. aeruginosa. 10 In addition, a T-OMP in P. aeruginosa PAO1 was also found from isothiazolone-exposed preparations, but not resistance-induced cultures passaged in the absence of biocide. 58 There were also some different profiles of OMPs between an isothiazolone-resistant BC-IR, induced from a wild-type Burkholderia cepacia, and an isolated B. cepacia (BC-327), which was separated from industrial contamination samples. 62 All of the above results indicate that OMPs play a crucial role in isothiazolone resistance. Unfortunately, little attention was paid to the total proteins of the cell.
As we all know, it is quite important to completely elucidate the resistant properties and mechanisms of industrial biocides, including isothiazolones, for optimizing their practical application. 57 Therefore, an isothiazolone-resistant strain was first induced from the wild-type strain of P. aeruginosa under laboratorial conditions. Then, the total intracellular proteins of induced strain and its parental strain were extracted and identified through two-dimensional (2D) gel electrophoresis and matrix-assisted laser desorption/ionization time-of -flight mass spectrometry (MALDI-TOF-MS). At the same time, the resistant properties of induced strain were also studied. Our results may partly clarify the resistance features and molecular insights of P. aeruginosa to isothiazolones and instruct the correct practical application of this type of biocides.
Materials and Methods
Bacterial strain and chemical reagents
The wild-type P. aeruginosa ATCC9027 (denoted as WT in this article) was obtained from the American Type Culture Collection (ATCC) and routinely grown in the M9 minimal salts medium 25 containing 1 g L−1 NH4Cl, 11 g L−1 Na2HPO4·7H2O, 3 g L−1 KH2PO4, 5 g L−1 NaCl, 120 mg L−1 MgSO4, 10 mg L−1 CaC12, and 4 g L−1 glucose at 37°C in a shaking incubator with 120 revolutions per minute (rpm). A commercial product of Kathon (a representative of isothiazolone) was composed of a 3:1 (volume:volume, v:v) ratio of CMIT and MIT at a final concentration of 14% total active ingredient and purchased from Guangdong Dimei Biology Technology Co., Ltd. In addition, all other chemicals used in this study were of analytical grade and purchased from Sigma Chemical Co. unless otherwise indicated.
Susceptibility determination
The minimum inhibitory concentration (MIC) of P. aeruginosa to Kathon was assayed according to the previously described method with slight modifications. 9 Briefly, various amounts of the stock solution of Kathon were diluted in the M9 minimal medium to give a range of appropriate concentrations and ∼2×10⁷ colony forming unit (cfu) ml−1 inoculum density of a fresh culture of P. aeruginosa was added into the above medium with equal volume giving a finally biocide concentration as follows: 5, 10, 20, 40, 60, 80, 100, and 120 mg L−1. After culturing at 37°C for 24 hr, the MIC of P. aeruginosa was estimated as the lowest concentration of Kathon, which inhibited visible growth, respectively. All the above experiments were independently conducted in triplicate.
Induction of resistant strain
The inducement of resistance in P. aeruginosa to Kathon was performed according to the previously reported method with minor modifications. 7 Briefly, the WT strain was first subcultured in the M9 medium supplemented with 0.5 μg ml−1 of Kathon. After culturing at 37°C for 24 hr, the culture was then transferred into a fresh M9 medium containing increasing Kathon whose concentration was increased by 0.5 μg ml−1 until the subcultures could not grow within 48 hr. Also, the final cells at the highest concentration of Kathon were considered as the resistant strain and termed as Pa-R.
Bacterial growth assay
The growth assay was carried out in a total volume of 250 μl in a Bioscreen C microtiter plate (Labsystems) using an initial bacterial density of about 2×10⁴ cfu ml−1. Bacterial growth was monitored by measuring optical density (OD) at 600 nm with periodic shaking for 36 hr at 37°C in a Bioscreen C analysator (Labsystems) according to the manual instruction. This assay was conducted at least thrice at different days.
Effect of nutritional and environmental factors on the MIC
To assay the effects of nutritional conditions on MIC of WT and Pa-R, overnight cultures were inoculated into the fresh M9 or LB medium containing different concentrations of Kathon, respectively, and cultured for 24 hr at 37°C in a shaking incubator with 120 rpm. In addition, the MIC was also evaluated as the lowest concentration of Kathon that inhibited visible growth. Overnight cultures were also inoculated into the fresh M9 medium to give a bacterial concentration of 0.05 (OD600) and incubated at 27°C, 32°C, and 42°C, respectively. The pH values of the M9 medium were adjusted to 3, 5, 9, and 11, and then mixed with bacterial suspension. All the above mixtures were cultured in a shaking incubator for 24 hr, and the MIC was estimated as the lowest concentration that could inhibit visible growth.
Cross-resistance studies
Aliquots of 2 ml 108 cfu ml−1 overnight cultures of WT and Pa-R were transferred into fresh tubes containing 2 ml M9 liquid medium and different biocides so that the final concentration of biocides reached the points as follows: BIT (10, 20, 40, 60, 80, 100, 120, 140, 160, 180, 200, or 220 mg L−1), MIT (10, 20, 40, 60, 80, 100, 120, 140, 160, 180, 200, or 220 mg L−1), H2O2 (2.5, 5, 10, 20, 40, 80, 160, 320, or 640 mM), sodium hypochlorite (0.12%, 0.24%, 0.47%, 0.94%, 1.86%, 3.75%, or 7.5% [v:v]), benzalkonium chloride (2.5, 5, 10, 20, 40, 80, 160, 320, or 640 mg L−1), and glacial acetic acid (2.5%, 5%, 10%, 20%, 40%, or 80% [v:v]). The mixtures were incubated at 37°C for 24 hr with shaking at 120 rpm. Also, the MIC was expressed as the lowest concentration of biocides that inhibited visible growth.
Intracellular protein extraction
WT and Pa-R were cultured in the M9 medium without any antimicrobial agents at 37°C for 24 hr, respectively. In addition, the cells were then harvested by centrifugation at 5,000 rpm for 10 min at 4°C with 20 mM Tris-HCl buffer, pH 7.0, containing 5 mM EDTA and 5 mM MgCl2 and the supernatants were discarded. Then, the cell pellets were suspended in a lysis buffer containing 8 M urea, 4% CHAPS, and 20 mM dithiothreitol. The lysates were centrifuged at 18,000 rpm, and the supernatants were stored at −20°C until further analysis. The protein concentration was determined using a BCA Protein Assay Reagent Kit (BestBio) with bovine serum albumin as a standard according to the manufacturer's instructions.
Two-dimensional gel electrophoresis
Two-dimensional gel electrophoresis was performed essentially according to the previously described method 22 with minor modifications. Briefly, ReadyStrip IPG Strips (Bio Rad) with a nonlinear gradient from pH 3 to 10 (17 cm) were rehydrated overnight at 20°C with 200 μg of the above extracted total proteins in 0.2% Bio-Lyte ampholyte, 8 M urea, 2 mM tributyl phosphine, 2% ampholytes pH 3–10, 2% CHAPS, and traces of bromophenol blue. The first dimension of electrophoresis was conducted with a PROTEAN isoelectric focusing system (Bio Rad) based on the manufacturer's instructions under the following conditions: step 1, 250 V for 20 min; step 2, increased to 8,000 V over 2.5 hr; and step 3, 8,000 V for a total of 30,000 V/hr. After isoelectric focusing, the strips were then placed into an equilibration buffer consisting of 50 mM Tris-HCl, 2% SDS, 30% glycerol, 2 mM TBP, 6 M urea, pH 6.8 and subsequently conducted with the above same solution without TBP but supplemented with 2.5% iodoacetamide and traces of bromophenol blue for 2×15 min, respectively. The second dimensional separation was performed on an IPGphor electrophoresis system (Bio Rad) using a vertical sodium dodecyl sulfate–polyacrylamide gel electrophoresis (SDS-PAGE) containing 12% acrylamide resolving gels. Gels were stained by Coomassie Bright Blue R-250, then scanned with Image Scanner (Bio Rad), and analyzed with Image-Master 2D Elite 5.0 software (GE Healthcare) for qualitative and quantitative analysis of protein spots visualized on 2D gels. The above 2D gel electrophoresis was conducted thrice and the best results were recorded. A statistical analysis was performed with Student's t-test (95% confidence interval) or a threshold of 1.5-fold change, which ensured only significant changes in the value of protein spots, was taken into consideration.
MALDI-TOF-MS assay
Differential expression protein spots were manually excised from 2D gels and digested in the gel with trypsin (Promega). Peptides were mixed with 10 mg/L solution of α-cyano-4-hydroxycinnamic acid and deposited on the sample plates. Samples were allowed to dry and analyzed by MALDI-TOF-MS (Voyager-DE; Perseptive Biosystems). Monoisotopic peptide masses obtained from mass spectra were considered for protein identification using the MS-fit program and searching in the NCBInr protein database using MASCOT (Matrix Science). Peptide masses were used to identify the open reading frames encoding the proteins obtained from NCBI. The following parameters were used in the searches: protein molecular mass range from 800 to 4,000 Da, trypsin digestion, one max missed cleavage, fragment ion mass tolerance of ±100 ppm, and variable modification of oxidation.
Protein functional classification
Additionally, all of the differentially expressed proteins were submitted to the gene ontology (GO) analysis website (www.geneontology.org) to identify their functional classification, including biological processes, molecular functions, and cellular components.
Reverse transcription polymerase chain reaction analysis
WT and Pa-R were cultured in the M9 liquid medium, respectively. After 24 hr, the total RNAs of the two strains were isolated using a TRNzol Reagent (Tiangen) and then subjected to DNase I (Promega) treatment to remove DNA contamination. Subsequently, the cDNA synthesis was conducted using a Quantscript RT Kit (Tiangen) according to the manufacturer's directions. mRNA levels were measured using two-step relative reverse transcription polymerase chain reaction (RT-PCR) with the SuperReal PreMix SYBR Green (Tiangen) on a Mastercycler® ep realplex (Eppendorf) following the user's guides. Relative mRNA amounts and expression ratios of selected genes of all the changed proteins identified from 2D electrophoresis were normalized to the expression of 16S rRNA amounts (internal control), and fold changes were calculated using the 2−ΔΔCt method. 35 All RT-PCRs were performed in triplicate. In addition, the primers used for RT-PCRs are listed in Table 2.
The primers were designed using Beacon Designer 7.0 and synthesized at the Beijing Genomics Institute.
RT, reverse transcription.
Results
Alternation of bacterial growth curves and MIC
Under successive induction with sublethal concentration of Kathon in the M9 liquid medium, a resistant strain of Pa-R was successfully obtained. The growth curves of WT and Pa-R were determined using a Bioscreen C analysator (Labsystems), respectively, and the results are shown in Fig. 1. The values of OD600 sharply enhanced during the first 10 hr to reach 0.86 (WT) and 0.75 (Pa-R), respectively. Subsequently, WT was continuously grown until 22 hr following a decrease for the next 14 hr. However, there was not a great change of OD600 for Pa-R from 10 to 24 hr, which was followed by a slight decrease of OD600 for the next 12 hr. The results of growth assay indicated that Pa-R grew more slowly than WT.
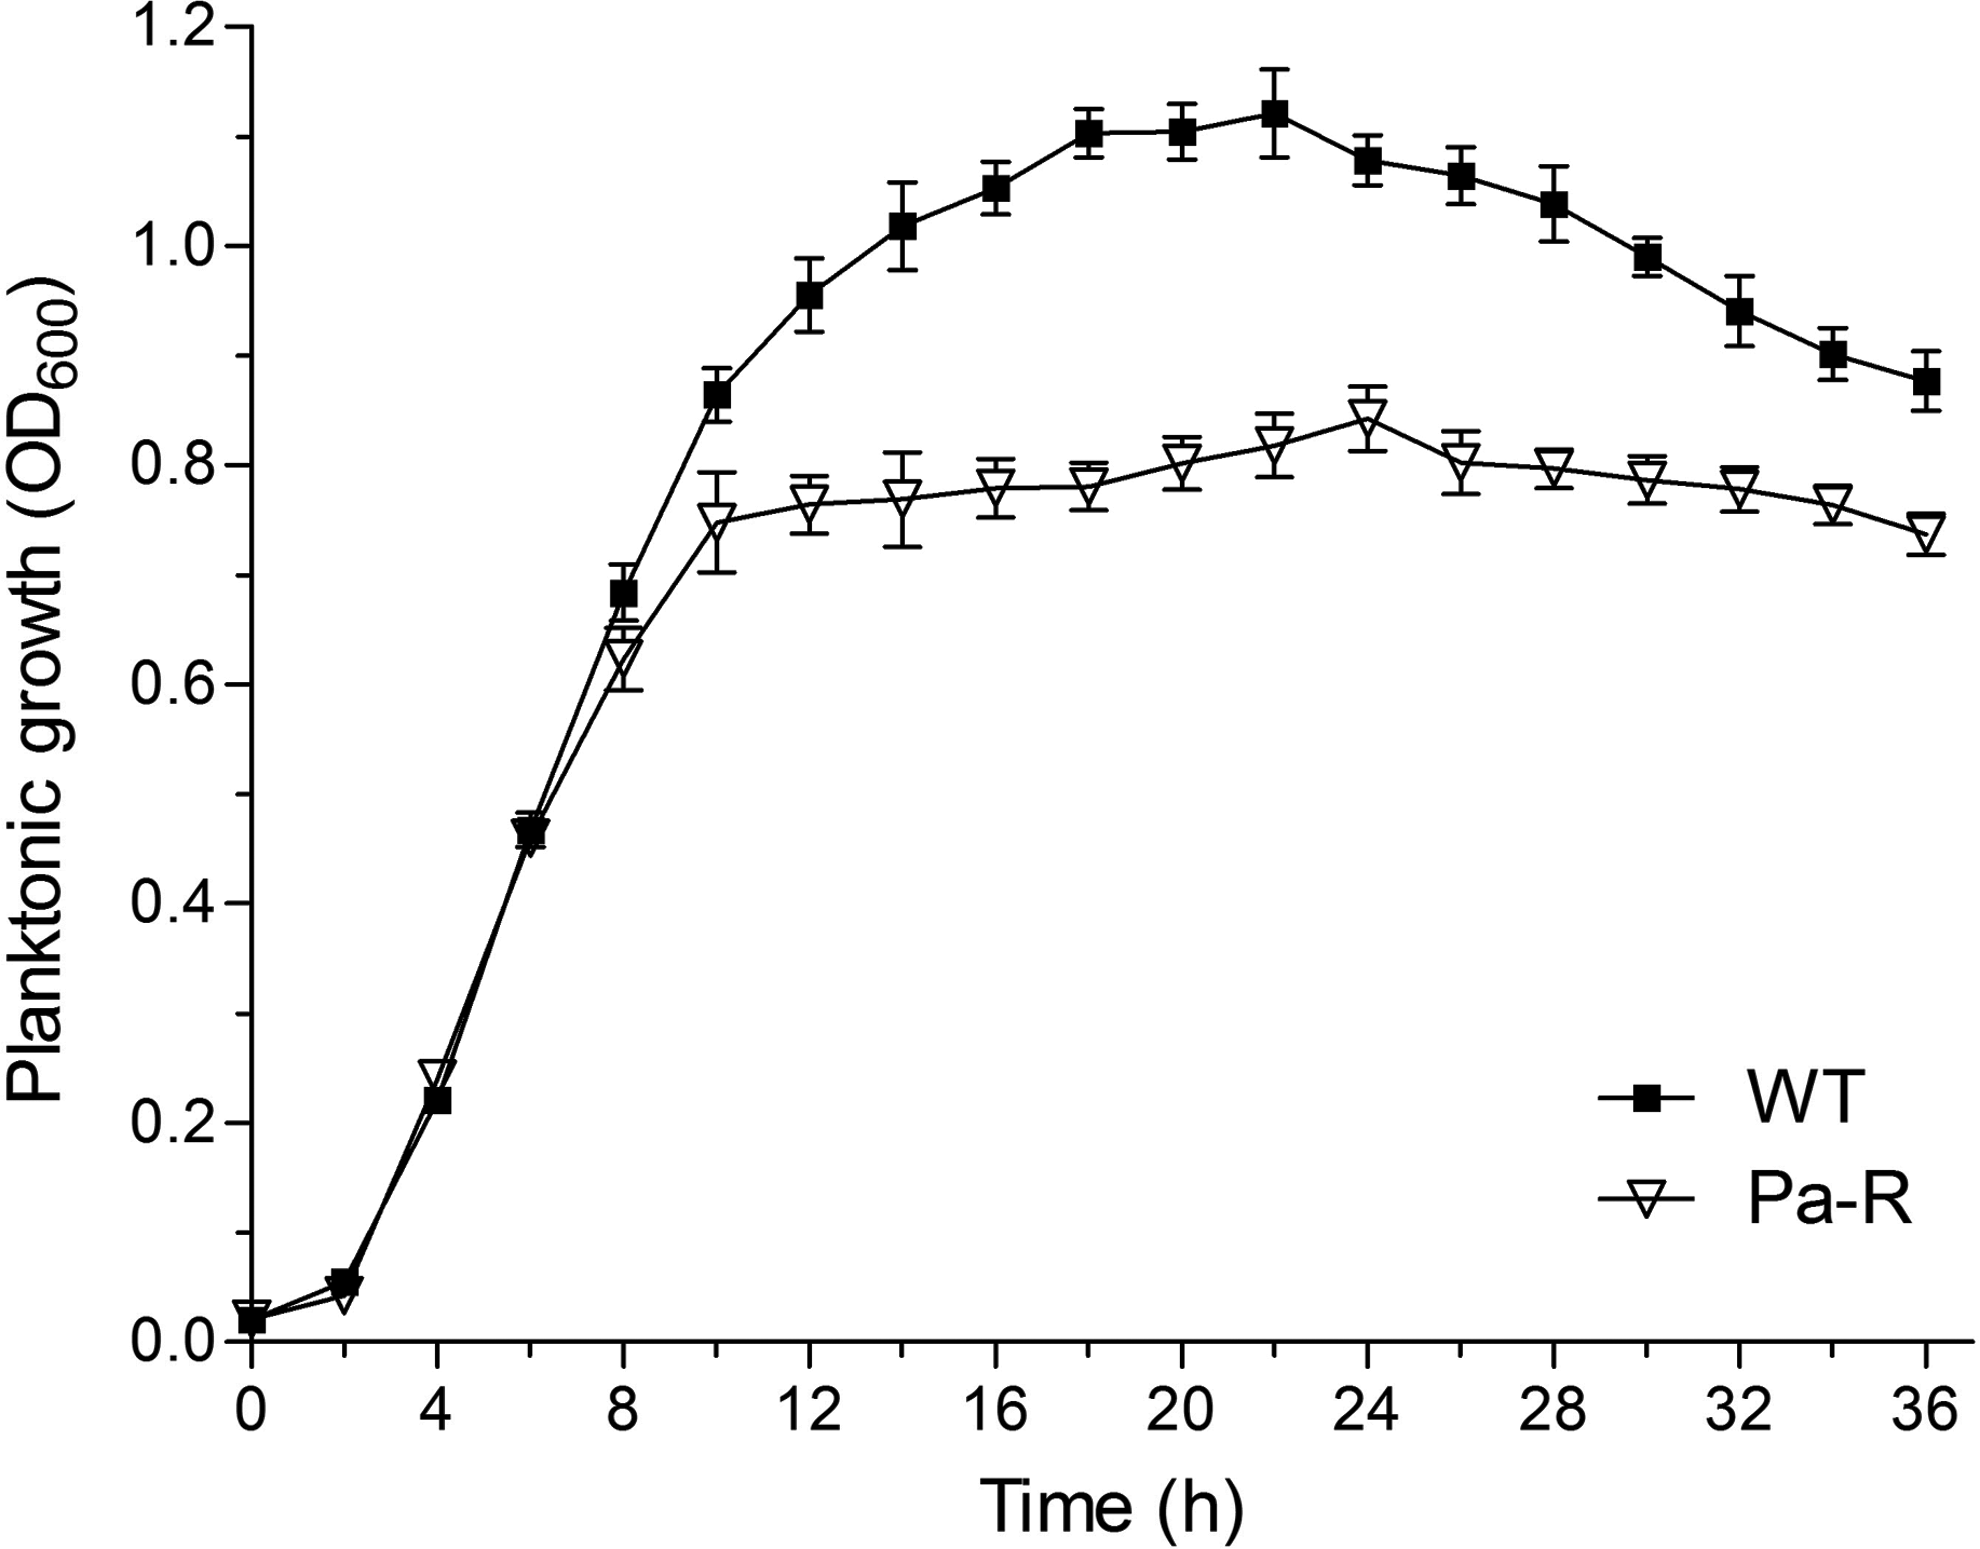
Growth curves of Pseudomonas aeruginosa WT and Pa-R cultivating in 1×M9 medium at 37°C for 36 hr.
At the same time, the MICs of both WT and Pa-R under different conditions were also evaluated and the results are listed in Table 3. No matter in the M9 or LB medium, the MICs of WT and Pa-R at 37°C were 10 and 40 μg ml−1, respectively. The MICs of both strains increased with the reduction of temperature, but the maximal values appeared at 32°C. Moreover, the MICs were not affected by a higher temperature (42°C). In addition, the MIC of WT could not be influenced by different pH of the medium. However, an excessive acidic (pH 3) or alkaline (pH 11) medium was not suitable for Pa-R to exhibit its resistance to Kathon. Obviously, the optimum pH of M9 medium for Pa-R to exhibit resistance was found to be 5. These above results suggested that the MICs of WT could be affected by culture temperature but no pH of the medium, whereas Pa-R showed more MICs than WT under any tested conditions.
MIC, minimum inhibitory concentration; WT, wild type.
Pa-R showed coresistance and cross-resistance to other biocides
BIT and MIT are the same class of isothiazolones as Kathon. The MICs of WT to BIT and MIT were 90 and 80 μg ml−1, respectively. The Kathon-resistant strain of Pa-R showed coresistance to BIT and MIT, respectively, which increased for 2.22 and 1.63-folds compared with WT (Table 4). Besides coresistance, Pa-R also exhibited cross-resistance to benzalkonium chloride but not for H2O2, glacial acetic acid, and sodium hypochlorite (Table 4). These results suggested that Kathon-resistant strain exhibited coresistance to the same class of biocides and partly cross-resistance to different classes of biocides such as benzalkonium chloride.
BIT, benzisothiazolone; MIT, N-methylisothiazolone.
Identification of the different expressed proteins between WT and Pa-R
Total proteins of WT and Pa-R under normal conditions were extracted and then identified using 2D electrophoresis and MALDI-TOF-MS, and their expression levels were compared with each other. Comparison of the 2D protein patterns of WT and Pa-R indicated that there were a total of 13 proteins that were inhibited, while 6 proteins were overexpressed in Pa-R (Fig. 2). However, spot P12, P14, and P19 failed to be identified. Also, all the characteristics (including peptide sequence, protein molecular weight (MW), and protein isoelectric point (pI) of successfully identified proteins are listed in Table 5. Among them, isomerase/thiol-disulfide oxidase (spot P2), ATP-binding component of ATP-binding cassette (ABC) transporter (P3), acyl-CoA thioesterase II (P6), ribose-5-phosphate isomerase A (P11), and phosphogluconate dehydratase (P13) were upregulated in Pa-R, whereas carbonic anhydrase-related protein (P1), ATP-dependent Clp protease (P4), chemotaxis protein (P5), F0F1 ATP synthase (P7), NAD (P) H quinine oxidoreductase (P8), N-acyl homoserine lactone acylase Pvdq (P9), protein LolA (P10), putative oxidoreductase (P15), inorganic pyrophosphatase (P16), (R)-specific enoyl-CoA hydratase (P17), and putative glutathione S-transferase (P18) were downregulated (Fig. 2 and Table 5).
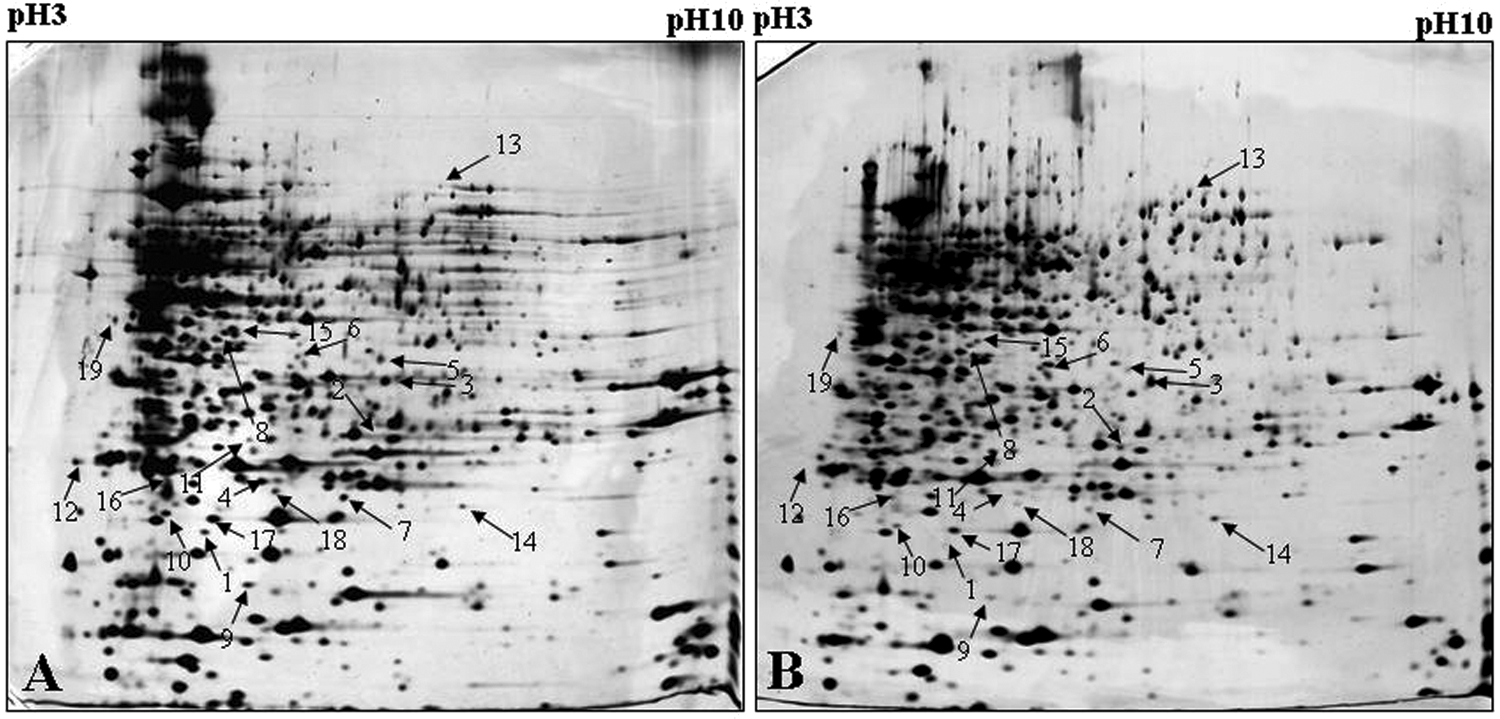
Proteomic profiles of P. aeruginosa WT
Differential expression of proteins in Pa-R compared with the WT strain: −, downregulated; +, upregulated.
CI, confidence interval; GO, gene ontology; MW, molecular weight; pI, isoelectric point.
Gene ontology
The differently expressed proteins were enriched into GO categories according to their biological process, molecular function, and cellular localization. The main enriched categories for the up- and downregulated proteins are represented in Table 5. Most changed proteins in Pa-R were categorized into the catalytic activity of metabolic process, including oxidoreductase activity (NAD (P) H quinone oxidoreductase and putative oxidoreductase), transferase activity (chemotaxis protein and putative glutathione S-transferase), hydrolase activity (ATP-dependent Clp protease, acyl-CoA thioesterase II, F0F1 ATP synthase subunit delta, N-acyl homoserine lactone acylase Pvdq, and inorganic pyrophosphatase), isomerase activity (disulfide isomerase and ribose-5-phosphate isomerase A), and lyase activity (carbonic anhydrase, phosphogluconate dehydratase, and (R)-specific enoyl-CoA hydratase). Besides of the above categories, protein LolA and ATP-binding component of ABC transporter were divided into the lipoprotein transporter activity and transmembrane transporter complex, respectively. These results suggested that there was a diversity of GO among the successfully identified proteins.
Confirmation of comparative proteomics results by quantitative RT-PCR
An RT-PCR analysis was also conducted to assess the mRNA expression levels of genes corresponding to all of the identified proteins with different levels of expression among WT and Pa-R. The relative expression levels of dsbG, yadG, tesB, rpiA, and edd were increased in Pa-R, while all other genes were downregulated (Fig. 3). Taken together, these results exhibited a good qualitative relationship between the expression profiles of these molecules determined by transcriptional and proteomic analyses. In any event, these data suggest that the differential expression of all these proteins in WT and Pa-R might be regulated at the transcriptional level.
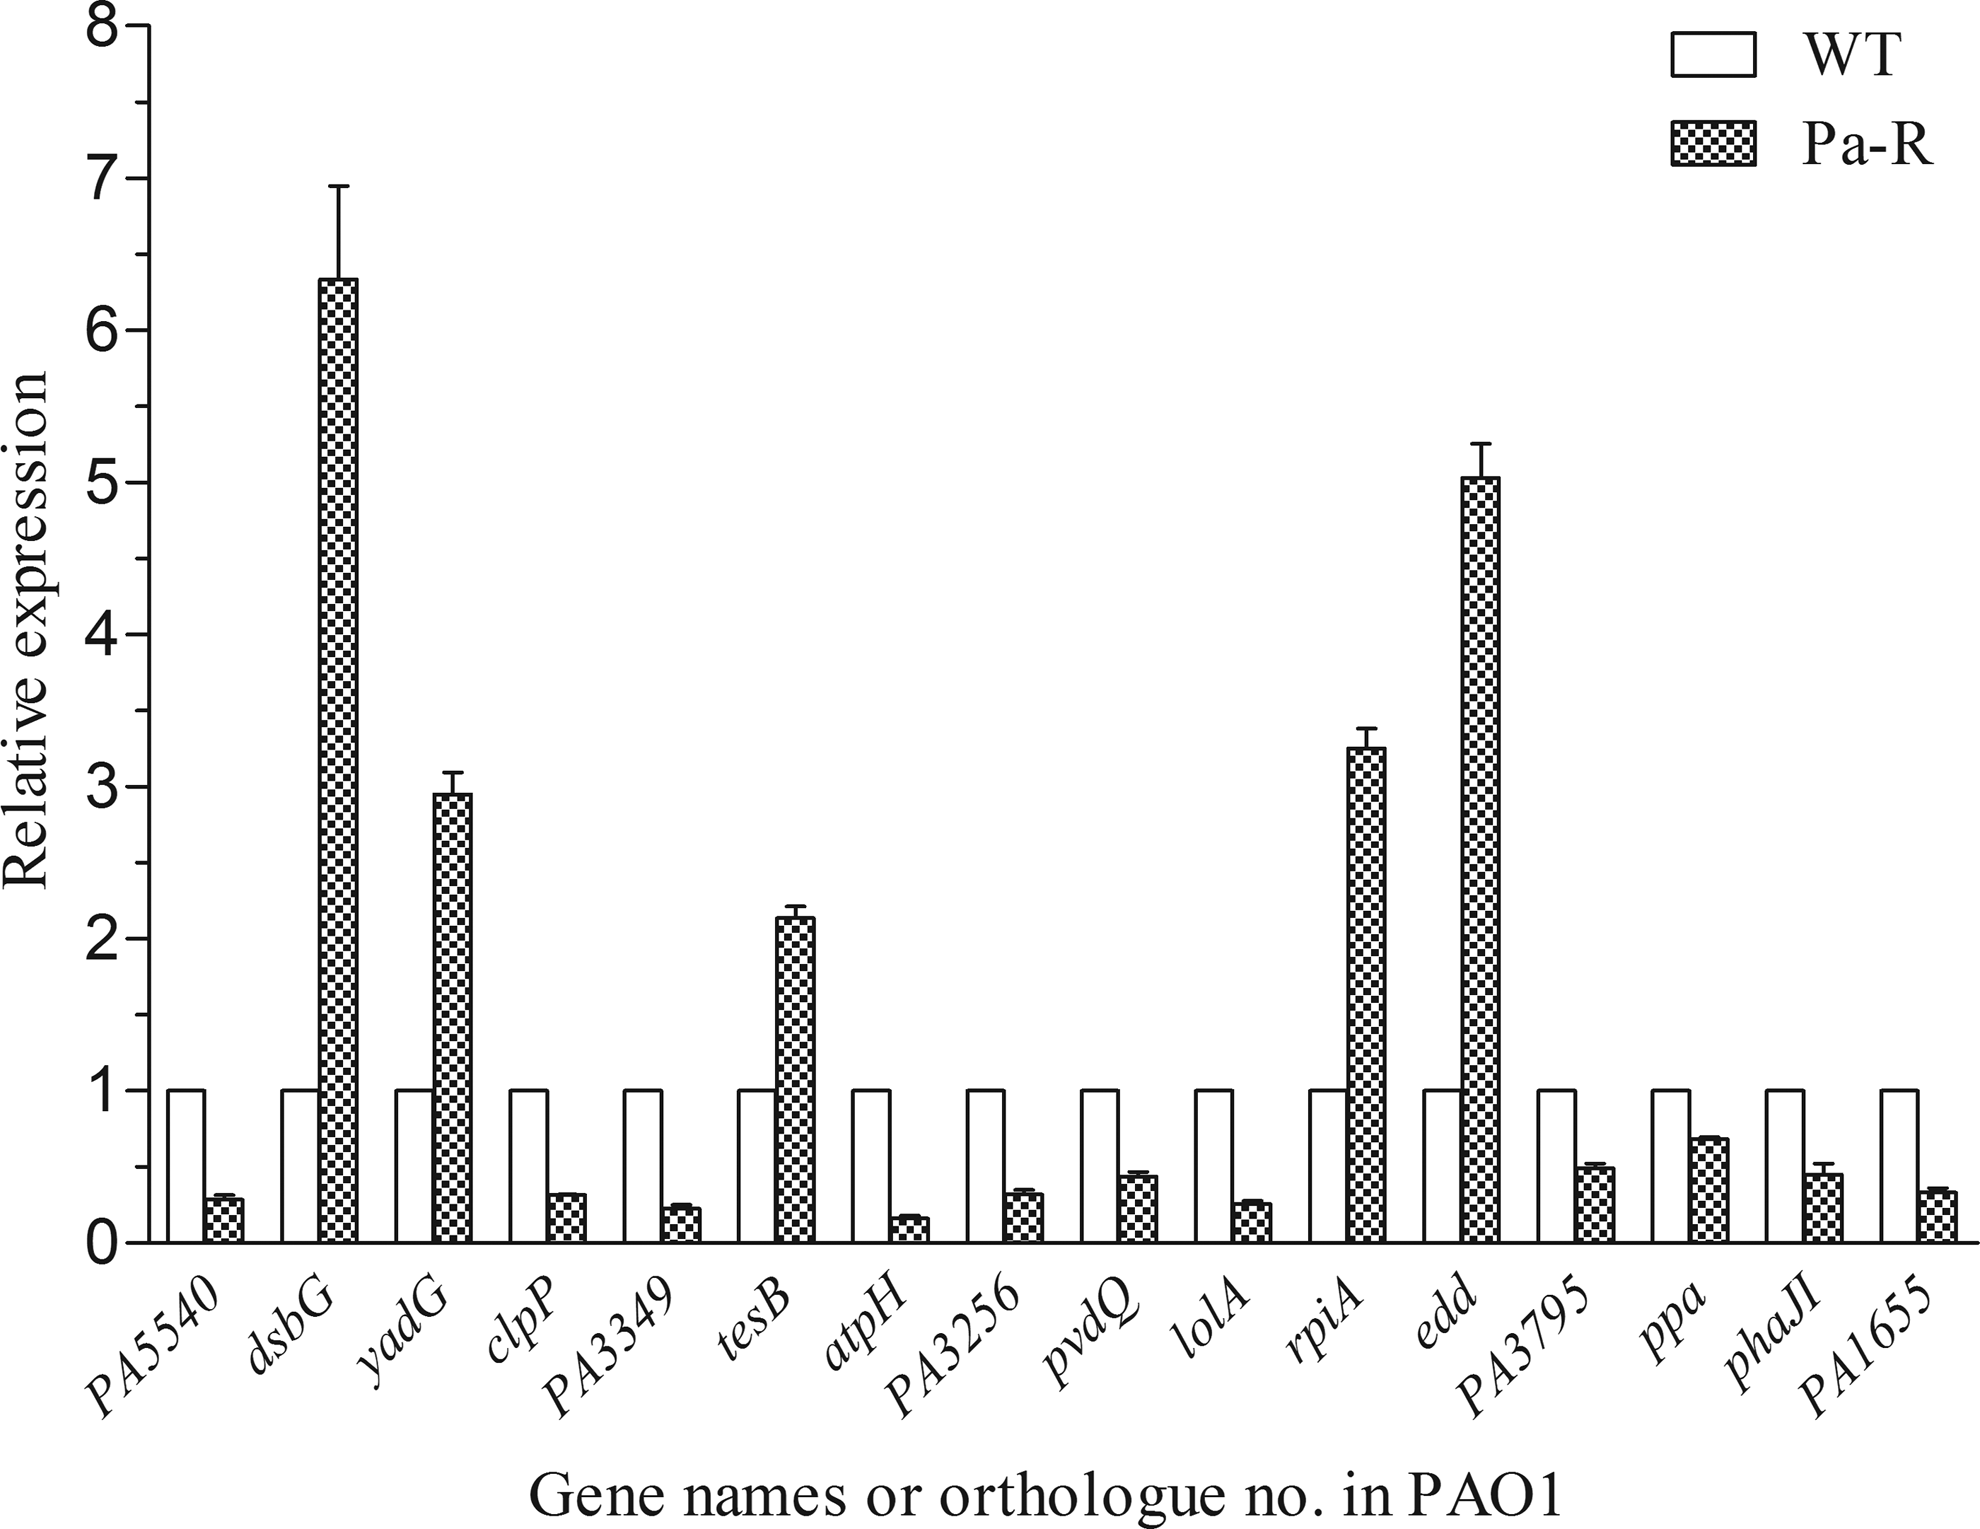
Analysis of the expression of all the selected genes encoding differentially expressed proteins. The relative transcription levels of all genes in WT cells were considered as 1 when calculated with the 2−ΔΔCt method. All assays were performed in triplicate, and the mean value and standard deviation (SD) are shown.
Discussion
It has been reported that the resistant strain could be obtained by subculturing the original microorganism in sublethal concentrations of biocide. 58 Similarly, a resistant strain of Pa-R to Kathon was successfully induced under laboratorial conditions in this study. Moreover, the resistance characteristics and mechanisms of Pa-R were preliminarily studied in parallel with its parental strain of WT.
Preliminary resistant features of WT and Pa-R
First of all, the MICs of WT and Pa-R could be affected by extracellular factors, including temperature and pH values. Relative lower temperature (32°C) and pH values of medium (pH 5) were suitable for Pa-R to exhibit its resistance to Kathon (Table 3). As we all know, the appropriate temperature and pH values that P. aeruginosa can grow are 25–42°C and 3–11, respectively. It has been found that isothiazolones are stable in acidic media, whereas the active components undergo degradation in alkaline solutions, and the rate of degradation was faster with an increase in pH. 5 In addition, isothiazolones could keep their active activity in a broad temperature from 24°C to 60°C. 4 Thus, we proposed that the increased level of resistance was not caused by the degradation of isothiazolones but by the intrinsic changes of P. aeruginosa.
The results of resistant experiment suggested that once a culture of P. aeruginosa PAO1 had been induced to resistance toward one of the groups of isothiazolones, this resistance was to some extent transferable toward other members of the group and other thiol-active antimicrobials. 58 In our study, Pa-R showed coresistance (BIT and MIT) and cross-resistance (benzalkonium chloride) to other antibiotics (Table 4). These results suggest that Kathon, BIT, MIT, and benzalkonium chloride may induce some similar resistant mechanisms for Pa-R.
Upregulated proteins in Pa-R
Besides the preliminary resistant features of WT and Pa-R, the proteomic profiles of those two strains were also investigated according to the previous recommended guidelines 8 and compared with each other. Among all the changed proteins, five proteins, including disulfide isomerase, ABC transporter, acyl-CoA thioesterase, intracellular ribose-5-phosphate isomerase A, and phosphogluconate dehydratase, were all upregulated in Pa-R (Table 5 and Fig. 2).
Protein disulfide isomerase (PDI), known to be a multifunctional protein, is capable of catalyzing disulfide formation from either the reduced form or randomly joined disulfides and isomerization and playing a similar role as a chaperone that inhibits aggregation in the folding process.55,56 ABC transporters couple the hydrolysis of ATP not only to the uptake and efflux of solutes across the cell membrane but also to be involved in diverse processes, including signal transduction, protein secretion, drug and antibiotic resistance, antigen presentation, bacterial pathogenesis, and sporulation in bacteria.16,24,46 The results of proteomic analysis show that the expression of a “probable ATP-binding component of ABC transporter” existed in ciprofloxacin-intermediate and -resistant strains of P. aeruginosa, but not in ciprofloxacin-sensitive strain. 63 Acyl-CoA thioesterase II is localized in almost all cellular compartments and capable of catalyzing the hydrolysis of acyl-CoAs to the free fatty acid and coenzyme A (CoASH), which provides the potential to regulate intracellular levels of acyl-CoAs, free fatty acids, and CoASH. Meanwhile, this enzyme is highly regulated by peroxisome proliferator-activated receptors (PPARs) and other nutritional factors, which has led to the conclusion that they are involved in lipid metabolism. 26 The intracellular ribose-5-phosphate isomerase A catalyzes the interconversion of ribose-5-phosphate and ribulose-5-phosphate and is essential in the pentose phosphate pathway and in the Calvin cycle. 61 A phosphogluconate dehydratase, which participates in the Entner–Doudoroff pathway, is an enzyme that catalyzes 6-phospho-D-gluconate into 2-dehydro-3-deoxy-6-phospho-D-gluconate and H2O. 38 Taken together, several intracellular pathways (including lipid metabolism, pentose phosphate pathway, Calvin cycle, Entner–Doudoroff pathway), cell cassette (ABC transporter), and enzymes (disulfide isomerase) are involved in Pa-R resistance to Kathon, which suggests that this type of resistance is a complex mechanism.
Downregulated proteins in Pa-R
In this study, a total of 11 proteins were downregulated in Pa-R. Based on their functions, they are divided into five groups (Table 5). Among them, two proteins of carbonic anhydrases (or carbonate dehydratases) and (R)-specific enoyl-CoA hydratase were classified into the lyase activity. The carbonic anhydrases (or carbonate dehydratases), a type of metalloenzyme, can catalyze the rapid interconversion of carbon dioxide and water to bicarbonate and protons or vice versa. 2 They maintain the intracellular balance of CO2/bicarbonate required for biosynthetic reactions and represent a new group of antimicrobial drug targets. 36 (R)-specific enoyl-CoA hydratase from P. aeruginosa was cloned and expressed for polyhydroxyalkanoate (PHA) synthesis from the fatty acid ß-oxidation cycle.51,52
In addition, there were four changed proteins that exhibited a hydrolase activity. ATP-dependent ClpP proteases are involved in protein catabolism under both optimal and stress conditions and participate within many crucial regulatory mechanisms. 42 The F0F1 ATP synthase is a large multisubunit complex that couples translocation of protons down an electrochemical gradient to the synthesis of ATP. 40 In many gram-negative pathogens, their virulent behavior is regulated by quorum sensing, in which diffusible signals such as N-acyl homoserine lactones (AHLs) act as chemical messaging compounds. The quorum-quenching capabilities of PvdQ may be utilized to suppress the quorum-sensing machinery of pathogens. 6 PvdQ plays an essential biosynthetic role for the siderophore pyoverdine, on which P. aeruginosa depends for growth in iron-limited environments. 12 Inorganic pyrophosphate is produced in various reversible nucleoside 5′-triphosphate-dependent reactions and catalyzes the irreversible hydrolysis of pyrophosphate and their functions is known to be essential to all living organisms.33,41
There were two changed proteins showing the transferase activity. Escherichia coli can respond to a variety of amino acids, sugars, and dipeptides, as well as pH, temperature, and redox state, by adjusting its swimming behavior by the signaling pathway of chemotaxis. The CheR protein is part of the chemotaxis signaling pathway, which methylates the chemotaxis receptor at specific glutamate residues.3,48 Glutathione-S-transferases (GSTs) are a family of Phase II detoxification enzymes that catalyze the conjugation of glutathione (GSH) to a wide variety of endogenous and exogenous electrophilic compounds. It is plausible that GSTs serve two distinct roles in the development of drug resistance through direct detoxification as well as acting as an inhibitor of the mitogen-activated protein (MAP) kinase pathway. 50
Similarly, there were two proteins showing the oxidoreductase activity. NAD (P) H: quinone oxidoreductase (NQO1) and NRH: quinone oxidoreductase (NQO2) are flavoproteins that catalyze two-electron reduction and detoxification of quinones and their derivatives. The NQO1 gene expression is coordinately induced with other detoxifying enzyme genes in response to xenobiotics, antioxidants, oxidants, heavy metals, and radiations.27,37 In citric acid and glyoxylate cycle, an oxidoreductase is an enzyme that catalyzes the transfer of electrons from one electron donor to another electron acceptor and usually utilizes NADP or NAD+ as cofactors. 32
Finally, only one downregulated protein showed the lipoprotein transporter activity. LolA is a periplasmic chaperone that binds to outer membrane-specific lipoproteins and transports them from the inner membrane to outer membrane through LolB. It has been revealed that the structural flexibility of LolA is an important factor for its role as a periplasmic chaperone. 39 Hydrophobic surface patches on LolA of P. aeruginosa are essential for lipoprotein binding.45,49
From table 1, we can find out that various proteins or enzymes can be affected or inhibited by isothiazolones. Besides those, some new inhibited sites were also found in our study. Based on the above results, we get the conclusion that not just one or two proteins are involved in the isothiazolone resistance for P. aeruginosa. It is a complex and complicated resistance feature and further studies should be conducted to elucidate the concrete functions of each protein.
Conclusions
Overall, the MIC of WT and Pa-R could be influenced by temperature and pH values. Moreover, Pa-R, which showed resistance to Kathon, also exhibited coresistance and cross-resistance to BIT, MIT, and benzalkonium chloride, respectively. Two-dimensional gel electrophoresis results reveal that many proteins contribute to the Kathon resistance in P. aeruginosa Pa-R. In general, the gradual nature of the observed induction of resistance to tested isothiazolone suggests that the subsequent resistance is mainly due to a phenotypic adaptation.
Footnotes
Acknowledgments
Financial supports were provided by the Scientific and Technological Project of Guangdong Province (No. 2011B010500024), the Young Foundation of Guangdong Academy of Sciences for Scientific Research (No. qnjj201203), and the Cooperation Projects of Foshan City and Chinese Academy (No. 2012HY100115).
Disclosure Statement
No competing financial interests exist.