
Abstract
Background:
In postmenopausal women, a population at risk for the metabolic syndrome, the relative contribution of central fat versus peripheral muscle fat to the metabolic risk profile is unknown. This study explored the relationship between muscle fat infiltration derived from computed tomography (CT) scans and metabolic syndrome.
Methods:
Mid-thigh CT scans measured the surface of muscle with low attenuation (LAMS) [0–34 Hounsfield units (HU)], which represented the specific component of fat-rich muscle. Insulin sensitivity was evaluated by an euglycemic–hyperinsulinemic clamp. National Cholesterol Education Program Adult Treatment Panel III (NCEP ATP III) criteria were used to determine the presence of the metabolic syndrome.
Results:
A total of 103 postmenopausal women were studied. Metabolic syndrome was found in 43 women with significantly higher levels of abdominal adiposity, higher LAMS (27 ± 8 vs. 23 ± 7 cm2), and lower insulin sensitivity compared to those without the metabolic syndrome. Women with higher levels of LAMS presented higher metabolic risk features such as higher blood pressure, abdominal adiposity, inflammatory markers, and blood lipid levels. LAMS and visceral adipose tissue correlated significantly with the presence of metabolic syndrome, but these relationships were lost when LAMS was adjusted for visceral adipose tissue but not when visceral adipose tissue was adjusted for LAMS.
Conclusions:
These results suggest that postmenopausal women who present with metabolic syndrome had increased fat-rich mid-thigh muscle. Moreover, women with more fat-rich muscle had many features of the metabolic syndrome. These relations were weakened when visceral adipose tissue was taken into account suggesting that LAMS may play a relatively smaller role, compared to VAT, in the contribution to the metabolic syndrome.
Introduction
The menopause is associated with changes in body fat distribution such that there is increased central adiposity, preferentially targeting the visceral adipose tissue (VAT), and subsequently enhancing the likelihood of satisfying the metabolic syndrome criteria. 3,4 Although the harmful association of VAT with disease risk is well established, 5 there also is evidence that thigh fat stores, which are predominant in women, have independent effects on cardiovascular disease risk. 6 Our group has shown that a higher proportion of adipose tissue located in the mid-thigh is associated with a favorable metabolic profile. 7 However, the impact of the specific component of fat-rich muscle on the metabolic profile is unknown in this population.
Muscle area, measured by computed tomography (CT), can be divided into areas of normal and low muscle attenuation surface (LAMS). 8 The use of skeletal muscle attenuation for a measure of intramyocellular lipid has been validated in women and suggests that reduced attenuation is associated with increased fiber lipid. 9 LAMS represents skeletal muscle enriched with diffuse fat stores that reduce the attenuation of the muscle. Intramuscular lipid is increased in sedentary older individuals, 10 as well as in obesity. 11 Among healthy men and premenopausal women, obesity and insulin resistance were strongly associated with increased areas of LAMS. 12 In postmenopausal women, a population at higher risk for metabolic syndrome and cardiovascular disease, the relative contribution of central fat versus peripheral muscle fat to the metabolic risk profile is unknown.
With its noninvasive specificity and clinical relevance, our objective was to explore, for the first time, the relationship between CT-derived mid-thigh muscle area and the metabolic syndrome in postmenopausal women not using hormone treatment who displayed various levels of glucose tolerance.
Subjects and Methods
A total of 103 postmenopausal women aged 57.0 ± 4.4 years from the Quebec city metropolitan area were recruited. Those reporting having no menses for at least 1 year were considered as postmenopausal with a measure of the follicle-stimulating hormone to confirm menopausal status (29–180 U/L). Women included in the study were not using any type of hormone therapy and were free of coronary heart disease, known diabetes, dyslipidemias, or endocrine disorders (except stable thyroid disease). Five women included were smokers. Systolic blood pressure (SBP) and diastolic blood pressure (DBP) were measured on the right arm of seated participants. The study protocol was approved by the Laval University Hospital and Laval University Research Ethics Committees, and informed consent was obtained from each participant.
Anthropometric measurements
Height, weight, and waist circumference were determined following standard procedures 13 and body mass index (BMI) was calculated. Height was measured to the nearest millimeter with a stadiometer, and body weight was measured to the nearest 0.1 kg on a calibrated balance. Waist circumference was measured in duplicate at the mid-distance between the iliac crest and last rib margin while the woman was in a standing position, and the measurement was recorded to the nearest millimeter.
CT scans
Measurements of abdominal total adipose tissue (TAT), VAT, subcutaneous adipose tissue (SAT), and mid-thigh adipose tissue (AT) were performed by CT scan with a GE High Speed Advantage CT scanner (General Electric Medical Systems, Milwaukee, WI). 14 CT scans were obtained by single slice at the abdominal level (between the L4 and L5 vertebrae) using a radiograph of the skeleton to establish the position of the scan to the nearest millimeter. TAT areas were calculated by delineating these areas with a graph pen and then computing the AT surfaces with an attenuation range of −190 to −30 Hounsfield units (HU). VAT area was measured by drawing a line within the muscle wall surrounding the abdominal cavity. SAT area was calculated by subtracting the amount of VAT from the TAT.
A single 10-mm-thick CT image was obtained in the mid-thigh at the mid-point between the anterior iliac crest and the patella. Thigh TAT was subdivided into two compartments of AT present above the fascia lata (subcutaneous thigh fat) and below the fascia lata (deep thigh fat). Whole-muscle surface and attenuation are calculated using the entire range of attenuation (0–100 HU). LAMS (0–34 HU) represents the specific component of fat-rich muscle. Muscle with measures of attenuation above these values (35–100 HU) is considered as having normal fat content. These methods of thigh composition analyses using CT have been previously described. 15
Oral glucose tolerance test
A 75-g oral glucose tolerance test was performed in the morning after an overnight fast. Blood samples were collected in ethylenediaminetetraacetic acid (EDTA)-containing tubes (Becton Dickinson, Franklin Lakes, NJ) through a venous catheter from an antecubital vein at −15, 0, 15, 30, 45, 60, 90, 120, 150, and 180 min for the determination of plasma glucose, insulin, and C-peptide concentrations. Plasma glucose was measured enzymatically, whereas plasma insulin was measured by radioimmunoassay with polyethylene glycol separation. 16 –18 Women with plasma insulin antibody (2% and more) following insulin measurements were excluded from analyses (n = 3). The interassay coefficient of variation was 1% for a basal glucose value set at 5.0 mmol/L. Insulin secretion was defined using the C-peptide index (C-peptide 30 min – C-peptide 0 min/glucose 30 min – glucose 0 min). 19 This index has been correlated with more precise insulin secretion measurements in previous studies. 19 Among these postmenopausal women, 44 were classified as having normal glucose tolerance (NGT) [fasting plasma glucose (FPG) concentrations <5.6 mmol/L and 2-h plasma glucose (2hPG) concentrations <7.8 mmol/L], 41 women were characterized by impaired glucose tolerance (IGT) (FPG ≤6.9 mmol/L and 2hPG between 7.8 and 11.0 mmol/L) or impaired fasting glucose (IFG) (FPG between 5.6 and 6.9 mmol/L and 2hPG <7.8 mmol/L), and 18 women had newly diagnosed type 2 diabetes (T2DM) (FPG concentration ≥7.0 mmol/L or 2hPG ≥11.1 mmol/L). 20
Euglycemic–hyperinsulinemic clamp
Following a 12-h overnight fast, insulin sensitivity was determined with an euglycemic clamp. 21 An intravenous catheter was placed in an antecubital vein for the infusion of insulin and glucose (20% dextrose). A second catheter was placed in the other arm for sampling of blood to permit determination of plasma insulin and glucose levels. A primed continuous infusion of insulin (Humulin R) (40 mU/m2 per min) was then started. Adjustments in glucose infusion rate was performed to reach the FPG values and a steady state of about 5.5 mmol/L for women with FPG above the normal range (FPG ≥6.1 mmol/L). Once the steady state of insulin and glucose was reached, the insulin infusion was continued for total of 2 h. The duration of the insulin infusion was such that the rate of infused glucose reached a constant value during the last hour of the clamp. Blood samples were collected from the time −15 min and then every 5 min during the test to measure blood glucose concentrations by using a glucometer Elite Bayer (number 3903-E). Blood samples were collected every 10 min, centrifuged for plasma, and stored at −20°C for later analyses of plasma glucose and insulin as described above. 16,18 The exogenous glucose infusion rate/kg of body weight during the last 30 min of the 120-min clamp was averaged as an index of insulin-stimulated glucose disposal rate or M value. Insulin sensitivity (M/I) was defined as the M value divided by the mean insulin concentration during the last 30 min of the clamp. 21 The disposition index (DI) was defined at the product of insulin sensitivity (M/I) and insulin secretion (C-peptide index).
Plasma lipid-lipoprotein profile
On the morning of the hyperinsulinemic–euglycemic calmp, blood samples were collected in the fasting state to measure a complete lipid–lipoprotein profile. 22
Inflammatory markers
Plasma C-reactive protein (CRP) levels were measured on plasma, stored at −80°C using the Behring Latex-Enhanced high-sensitivity CRP (hsCRP) assay on a Behring Nephelometer BN-100 (Behring Diagnostic, Westwood, MA) and the calibrators (N Rheumatology Standards SL). Plasma interleukin-6 (IL-6), tumor necrosis factor-α (TNF-α), and adiponectin concentrations were measured by a high-sensitivity enzyme-linked immunosorbent assay (ELISA) for human IL-6, TNF-α, and adiponectin (R&D Systems Inc, Minneapolis, MN). Plasma fibrinogen was also measured by nephelometry (BN ProSpec).
Identifying subjects with the metabolic syndrome
Presence of the metabolic syndrome was defined by the National Cholesterol Education Program Adult Treatment Panel III (NCEP ATP III) as having three or more of the following criteria: Triglyceride concentrations ≥1.7 mmol/L, high-density lipoprotein cholesterol <1.3 mmol/L, FPG ≥5.6 mmol/L, waist circumference ≥88 cm, and blood pressure ≥130/85 mmHg. 1,23
Statistical analyses
Statistical analyses were performed using JMP 5.0.1 software (SAS Institute, Cary, NC). Groups were divided based on their glucose tolerance status (normal, impaired, and type 2 diabetes). Comparisons between these groups were made by analysis of variance (ANOVA) using the general linear model, and Tukey post hoc tests were used when a statistically significant group effect was observed. Student t-tests were performed to assess differences between groups based on the level of LAMS with regard to metabolic parameters. Partial correlation coefficients were sought between LAMS and metabolic parameters with adjustment for VAT and between VAT with adjustment for LAMS and the MS and the number of criteria. The P value for significance was set at 0.05.
Results
Characteristics of the subjects are presented by tolerance status (Table 1). As expected, T2DM subjects were older, displayed higher SBP and DBP values, higher body fat composition parameters, especially for the abdominal compartments, as did subjects with impaired glucose tolerance compared to normoglycemic subjects. There were no significant differences in mid-thigh AT measures between the groups except for the surface of muscle with normal attenuation. LAMS was similar between groups. Whole-body insulin sensitivity (M/I) was significantly lower in T2DM and in impaired glucose tolerance women compared to normal glucose tolerance women. Moreover, T2DM women presented significantly higher CRP and IL-6 but lower adiponectin levels compared to women with impaired and normal glucose tolerance.
Different from NGT women, P < 0.05.
Different from IGT or IFG women, P < 0.05.
Abbreviations: IFG, impaired fasting glucose; IGT, impaired glucose tolerance; M/I, whole-body insulin sensitivity; NGT, normal glucose tolerance; SAT, subcutaneous adipose tissue; TAT, total adipose tissue; T2DM, type 2 diabetes; VAT, visceral adipose tissue; HOMA-IR, homeostasis model assessement of insulin resistance; hsCRP, high-sensitivity C-reactive protein; IL-6, interleukin-6; TNF-α, tumor necrosis factor-α.
In this study, more than 40% of the postmenopausal women presented the metabolic syndrome (Fig. 1). As shown in Fig. 2, an elevated blood pressure was the most frequent metabolic syndrome criteria in this group (58.6%), followed closely by an elevated waist circumference (56.3%). Women with the metabolic syndrome displayed higher SBP and DBP, BMI, waist circumference, visceral and subcutaneous AT (Table 2; P < 0.05). They also had significantly higher levels of mid-thigh deep fat, normal attenuation muscle surface, and LAMS compared to those without the metabolic syndrome. Women with metabolic syndrome displayed significantly lower insulin sensitivity, higher fasting and 2-h glucose values, but a similar insulin secretion compared to those without metabolic syndrome. They also presented higher levels of inflammatory markers such as hsCRP, fibrinogen, IL-6, and adiponectin. The high-density lipoprotein cholesterol (HDL-C) level was reduced and triglycerides more elevated in women with metabolic syndrome.
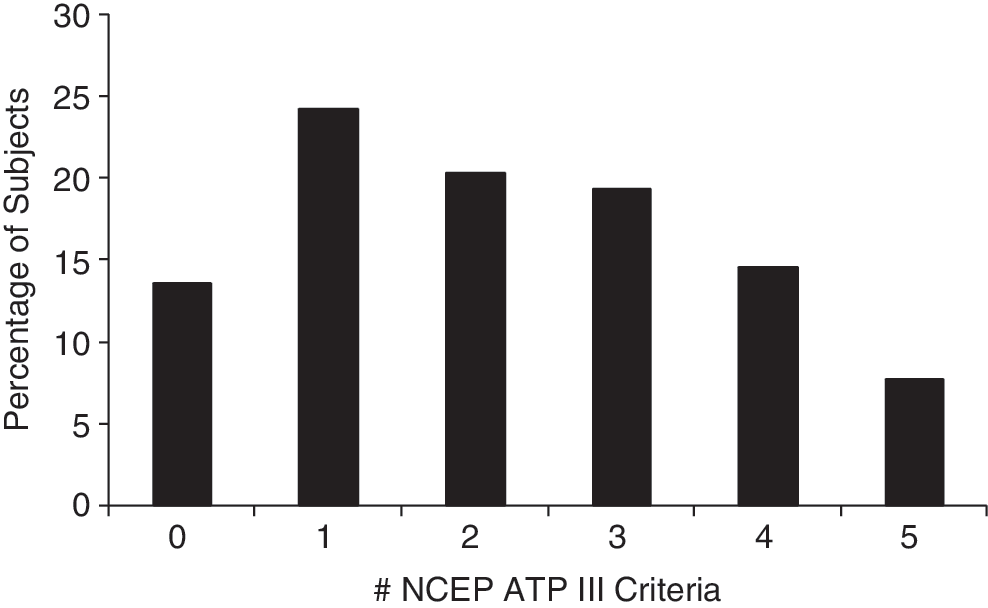
Percentage of subjects according to the number of the metabolic syndrome National Cholesterol Education Program Adult Treatment Panel III (NCEP ATP III) criteria.
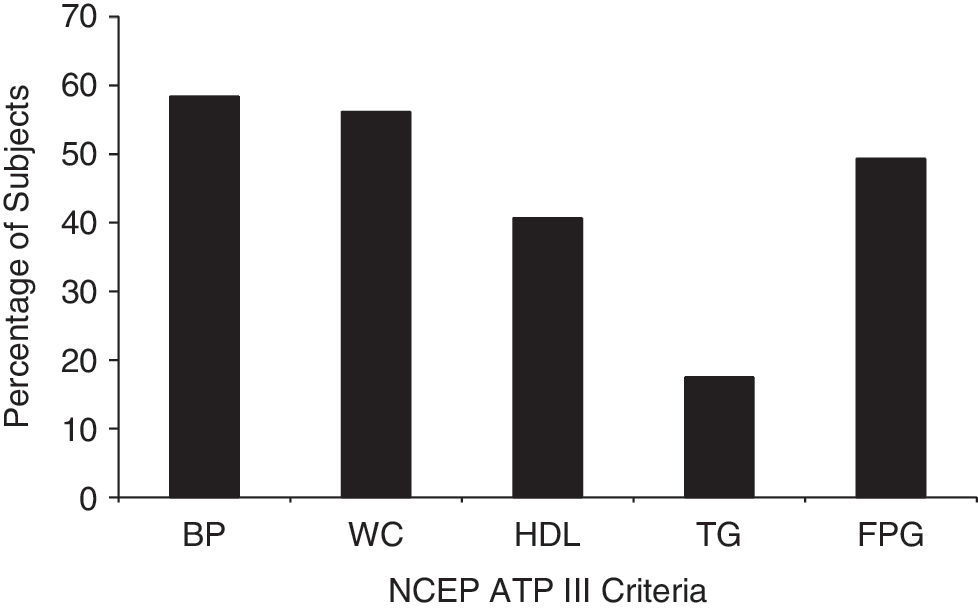
Percentage of subjects with each component of the metabolic syndrome upon National Cholesterol Education Program Adult Treatment Panel III (NCEP ATP III) criteria. BP, Blood pressure; WC, waist circumference; HDL, high-density lipoprotein; TG, triglyceride; FPG, fasting plasma glucose.
Significant difference, P < 0.05.
Abbreviations: SAT, subcutaneous adipose tissue; TAT, total adipose tissue; VAT, visceral adipose tissue; HOMA-IR, homeostasis model assessment of insulin resistance; hsCRP, high-sensitivity C-reactive protein; IL-6, interleukin-6; TNF-α, tumor necrosis factor-α; HDL-C, high-density lipoprotein cholesterol; LDL-C, low-density lipoprotein cholesterol.
Women who presented higher levels of LAMS displayed many features of deteriorated metabolic profile, such as: Higher blood pressure; global, abdominal and mid-thigh adiposity indices; blood profile; inflammatory markers; and lower insulin sensitivity (data not shown). LAMS correlated strongly with total and abdominal adiposity (r varying from 0.69 to 0.72; Table 3). LAMS was then adjusted for VAT, and consequently almost all significant correlations between LAMS and metabolic measures such as glucose-insulin homeostasis variables, inflammatory markers, and lipid profile were lost. VAT correlated strongly with with total and abdominal adiposity (r varying from 0.73 to 0.83; Table 3). When VAT was adjusted for LAMS, more metabolic profile measures remained significant. LAMS correlated significantly with the metabolic syndrome and the number of criteria of the metabolic syndrome (both r = 0.30, P < 0.005), but these relationships became nonsignificant when LAMS was corrected for VAT [r = −0.04 and −0.09, not significant (N.S.)]. However, VAT was significantly associated with the metabllic syndrome and the number of criteria of the metabolic syndrome (r = 0.54 and 0.62, P < 0.001) and kept significance even after adjustment for LAMS (r = 0.45 and 0.54, P < 0.001).
Correlation values in bold are significant with P < 0.05.
Variable adjusted for visceral adipose tissue.
Variable adjusted for low attenuation muscle surface.
Abbreviations: LAMS, surface of muscle with low attenuation; VAT, visceral adipose tissue; M/I, insulin sensitivity defined as the M value divided by the mean insulin concentration during the last 30 min of the clamp; HOMA-IR, homeostasis model assessment of insulin resistance; hsCRP, high-sensitivity C-reactive protein; IL-6, interleukin-6; TG, triglyceride; LDL-C, low-density lipoprotein cholesterol; HDL-C, high-density lipoprotein cholesterol.
Discussion
The results of this study showed that specific mid-thigh muscle adiposity, namely the surface of muscle with low attenuation measured by CT scan, is similar in all groups of postmenopausal women independently of their levels of glucose tolerance. Worsening of glucose tolerance from normal to T2DM was not associated with an accumulation of more deep fat in the mid-thigh compartments as with total and abdominal adiposity. However, our study design did not allow us to determine if the worsening in glucose tolerance induces a change in central and peripheral adiposity or the contrary.
Because the decline in estrogen that occurs with menopause may lead to AT deposition as well as increased intramyocellular lipogenesis and could facilitate intramyocellular lipid accumulation, we explored the relations between LAMS and the metabolic syndrome in our group of postmenopausal women. More than 40% of our post-menopausal women presented the metabolic syndrome. This significant proportion is comparable to what has been reported in the U.S. population. 24 Elevated blood pressure and waist circumference were the two most frequent criteria of the metabolic syndrome found in the present study. Hypertension is a strong risk factor in both sexes, but the prevalence of hypertension increases more rapidly in aging women than in men. 25 This may be mainly due to the activation of the renin–angiotensin system and to the development of obesity. 25 Android obesity, in particular, is an independent risk factor for the development of hypertension. 26 For many years, waist circumference has been shown to significantly correlate with intraabdominal fat accumulation and is used as a simple clinical tool to assess central adiposity. 5,27 Studies have shown that individuals with increased accumulation of VAT appear to develop the metabolic syndrome more frequently than those with an increase in peripheral body distribution (i.e., subcutaneous AT). 28 Our objective was to explore the relationship between peripheral muscle fat namely the surface of muscle with low attenuation in the mid-thigh and the metabolic syndrome in a population of postmenopausal women. Our results show that LAMS was significantly associated with the metabolic syndrome and its criteria, but when corrected for VAT, the relations lost statistical significance. However, VAT was associated with the metabolic syndrome and the number of criteria of the metabolic syndrome, even after adjustment for LAMS. Thus, the presence of the metabolic syndrome in this group seems mainly related to VAT compared to LAMS when localized body composition is considered.
It has been shown that thigh adiposity was associated with a more favorable cardiovascular risk profile 6 –10,29 –31 and a reduced risk of T2DM. 32 In the present study, we went further in documenting that LAMS, the specific component of fat-rich muscle in the mid-thigh, significantly correlated with total and abdominal adiposity, inflammation markers, and lipids in postmenopausal women. Women with less LAMS in the mid-thigh are susceptible to present a more advantageous metabolic profile compared to those who present larger amounts of LAMS. Indeed, our postmenopausal women with higher LAMS had a worse metabolic profile.
Longitudinal data from postmenopausal women show a substantial increase in waist circumference and fat mass, which begins a few years before the final menstrual period, with essentially no change occurring in skeletal muscle. 33 The deposition of fat mass is associated with an increase in circulating adipocytokines, which have implications for insulin resistance and cardiovascular disease. 34 In obese women with metabolic syndrome, Chu et al. 35 found significant increases in leptin and resistin and reductions in adiponectin. In the present study, LAMS was shown to significantly correlate with inflammatory markers but not with adiponectin.
Although it has previously been thought that AT deposition in the lower extremities is not related to metabolic dysregulation, 36 some evidence suggests that accumulation of lipids within fascia surrounding muscle is related to insulin resistance and may contribute to the risk of T2DM. 11 In the present study, LAMS was inversely related to insulin sensitivity measured by an euglycemic–hyperinsulinemic clamp. Goodpaster et al. 11 suggested that it is possible that AT interspersed in and around skeletal muscle may impair muscle blood flow, reduce insulin diffusion capacity, or increase local concentrations of fatty acids, all of which have been shown to be associated with insulin-resistant glucose metabolism in skeletal muscle. 37 –39
More than a decade ago, Simoneau et al. 12 revealed that LAMS was as strong a predictor of insulin resistance as was visceral obesity in a group of normotolerant premenopausal women. The amount of LAMS was increased in women with lower oxidative capacity, higher anerobic capacity, and an increased ratio of glycolytic to oxidative capacity in skeletal muscle. They also noticed that the reduced citrate synthase activity and the relative impairment in capacity for substrate oxidation by muscle found in association with LAMS could favor fat storage within muscle and concluded that muscle with low attenuation is an additional body composition marker of insulin resistance. The present study also suggested a role for LAMS in the deterioration of the metabolic profile, but probably to a lesser extent that VAT. Unfortunately, muscle biopsies were not performed in the present study so the metabolic characteristics of the skeletal muscle of our postmenopausal women could not be assessed with regard to prediction of insulin resistance.
Conclusion
Our results suggest that postmenopausal women who present with metabolic syndrome had greater fat-rich muscle, decreased insulin sensitivity measured by an euglycemic–hyperinsulinemic clamp, and a more deteriorated metabolic profile compared to their counterparts. Although increased muscle fat infiltration was related to a deteriorated metabolic profile, it appears to be a minor contributor to alterations in glucose–insulin homeostasis in postmenopausal women. However, further studies with more invasive measures of muscle composition and metabolism will be required to clearly resolve this issue.
Acknowledgments
The authors would like to express their gratitude to the subjects for their excellent collaboration, to the staff of the Lipid Research Center, the Physical Activity Sciences Laboratory, and the Diabetes Research Unit for their contributions to this study.
Disclosure Statement
The authors declare no conflict of interest.