
Abstract
Background:
Increase in obesity and metabolic syndrome are associated with increases in insulin resistance (IR) and type 2 diabetes mellitus. Results from animal intervention studies and human epidemiological studies suggest that n-3 polyunsaturated fatty acids can prevent and reverse IR, but results from human intervention studies have varied. Results from some human and animal studies suggest that docosahexaenoic acid (22:6n-3; DHA) may be more effective than eicosapentaenoic acid (20:5n-3; EPA) in the prevention of IR.
Methods:
By using a placebo-controlled, parallel study design, we examined the effects of DHA supplementation (3 grams/day, 90 days) in the absence of EPA on glucocentric and lipocentric markers of IR in hypertriglyceridemic men (n=14–17/group).
Results:
DHA supplementation increased fasting plasma glucose concentration by 4.7% (P<0.05), but did not alter other indices of IR based on fasting (insulin and homeostasis model assessment of insulin resistance [HOMA-IR]) or postprandial insulin and glucose concentrations (areas under curves for insulin and glucose, Matsuda index). Glucose increased by 2.7% in the placebo group and was not significant; increases in glucose in the two groups did not differ from each other. DHA decreased circulating concentrations of several lipocentric markers of IR, including plasma concentrations of nonesterified fatty acids (13.0%), small, dense low-density lipoprotein (LDL) particles (21.7%), and ratio of tryglycerides to high-density lipoprotein cholesterol (TG/HDL-C) (34.0%) (P<0.05). None of the variables changed in the placebo group.
Conclusions:
Our results suggest that lipocentric markers of IR are more responsive to DHA supplementation than the glucocentric markers. Future studies with DHA in prediabetic subjects and direct measures of insulin sensitivity are needed.
Introduction
A number of direct and surrogate methods are available to estimate glucocentric markers of IR. 3 –7 The two direct methods used to evaluate insulin-mediated glucose uptake (IMGU) are insulin suppression test (IST) and the euglycemic clamp. These direct methods are often time and labor intensive and require experienced operators. Therefore, other surrogate methods such as fasting plasma glucose (FPG), fasting plasma insulin (FPI), oral glucose tolerance test (OGTT), intravenous glucose-tolerance test (IVGTT), insulin tolerance test (ITT), homeostatic model assessment of insulin resistance (HOMA-IR), and the quantitative insulin sensitivity (IS) check index (QUICKI) are commonly used. The last two methods use fasting insulin and glucose concentrations to calculate IR or IS.
An equally important aspect of IR is the effects of insulin on lipid metabolism (lipocentric markers), which emphasizes that derangement in lipid metabolism can have devastating effects on glucose metabolism. 8 Several physiological markers of lipid metabolism, such as the ratio between plasma triglycerides (TG) and high-density lipoprotein cholesterol (HDL-C), number of small, dense (sd) low-density lipoprotein (LDL) particles, and nonesterified fatty acids (NEFA) are associated with IR. 9 –15 Because increased inflammation is considered to be a major factor in the development of IR, some investigators believe that plasma concentrations of inflammatory markers are also useful in estimating the degree of IR. 16
The amount and type of dietary fatty acids play a significant role in the development of IR. Saturated fatty acids (SFA), trans fatty acids (TFA), and n-6 polyunsaturated fatty acids (PUFA) increase inflammation and IR, whereas n-3 PUFA are believed to decrease inflammation and IR. 17 –19 Indications that n-3 PUFA may decrease IR came from epidemiological studies, inverse association between IR and tissue n-3 PUFA concentrations, and intervention studies with n-3 PUFA. Prior to the introduction of Western diets, which are characteristically high in n-6 PUFA, SFA, and TFA, the incidence of type 2 diabetes mellitus (T2DM) was much lower among Greenland Inuits and natives of Alaska than among the Danes and mainland residents of the United States. 20,21 Similarly, Japanese Islanders had a lower prevalence of noninsulin-dependent diabetes mellitus compared with their mainland counterparts. 22 Results from two recent epidemiological studies conducted in China and Japan support a decrease in IR by increased intake of n-3 PUFA, 15,23 whereas those from three large epidemiological studies conducted within the mainland U.S. population found no association between n-3 PUFA intake and T2DM. 19 A number of cross-sectional studies reported negative associations between IR and tissue concentrations of n-3 PUFA. 15,24 –27 Results from interventional studies have been variable; n-3 PUFA supplementation to nondiabetic human subjects improved IS in seven studies, but it did not change in ten studies. 17 –19 Inconsistencies among the results with fish oils could be because of a number of factors, including differences in the specific type of n-3 PUFA, their dose and duration of supplementation, overall fatty acid composition of the basal diet, health status of the study participants, and the methods used to evaluate IR.
Results from human studies with purified eicosapentaenoic acid (20:5n-3; EPA) and docosahexaenoic acid (22:6n-3; DHA) indicated that both of these fatty acids decreased plasma TG, but only DHA increased concentrations of plasma LDL-C and HDL-C, their mean particle sizes, and decreased concentrations of sd LDL particles. 28 Results from other studies suggest that DHA may be more effective than EPA in preventing IR. 29 –31 DHA supplementation improved IS in a study with obese children, 32 but not in overweight and obese adults. 33 Further studies are needed to determine if DHA will improve IS in human subjects.
We chose to study the effects of DHA in the absence of EPA on risk factors for cardiovascular disease because it is the most potent fatty acid suppressor of hepatic lipogenesis 34 and is the major long-chain n-3 PUFA in human tissues. DHA can be readily retroconverted to EPA (which is not elongated to DHA in humans). 35 Previously we have reported that DHA supplementation decreased concentrations of inflammatory markers and improved lipid profiles in men with both normal as well as elevated TG. 36 –39 Here we report that DHA supplementation improved several lipocentric markers of IS, but did not alter the glucocentric markers that we tested.
Subjects and Methods
Subjects
Details regarding the study design and participants have been published previously. 36 –38 Moderately hyperlipidemic, but otherwise healthy, men (39–66 years old) participated in this study. Participants regularly taking antiinflammatory, antihypertensives, nonsulfonyl urea, or other medications were excluded. Also excluded were consumers of illegal substances, more than five drinks of alcohol per week, more than one fish meal per week, and those taking supplements of fish oil, krill oil, flaxseed oil, or vitamin C or E. Clinical chemistry and hematology panels for all qualified participants were in normal ranges with the exception of blood lipids. All selected participants had serum C-reactive protein (CRP) concentrations of 1–10 mg/L, fasting serum TGs concentrations of 150–400 mg/dL (1.70–4.53 mmol/L), total cholesterol <300 mg/dL (7.78 mmol/L), LDL-C <220 mg/dL (5.69 mmol/L), and body mass index (BMI) between 22 and 35 kg/m2. Seventeen participants in each group completed the study.
Study design
The study protocol was approved by the Institutional Review Boards of the University of California Davis and the Veterans Affairs Medical Center, Mather, CA. It is listed in the government Clinical Trials (
To provide uniformity in the composition of diets among subjects during blood draw days, the metabolic kitchen provided all three meals (pretest diet) the day before each blood draw. The energy intake was adjusted for body height, body weight, age, and estimated physical activity of the participants using the Mifflin–St. Jeor equation and appropriate activity factors. The pretest diet that was weighed and served on the day before each blood draw did not differ in composition or total energy intake between the two groups (not shown). For this day, mean energy intake for two groups was 10,450±240 kJ; mean intakes for fat, carbohydrates, and proteins were 82, 340, and 100 grams/day, respectively. Saturated, monounsaturated, and polyunsaturated fatty acids provided 11.1%, 10.1%, and 8.8% of the total energy.
Blood draws, lipids, and lipoproteins
Blood samples were drawn on study days −7 and 0 (baseline), day 45 (mid intervention), and days 84 and 91 (end of intervention), but most of the results reported here are based only on blood samples drawn before and after DHA supplementation (study days 0 and 91). After the subjects fasted for 12 h overnight, an indwelling cannula was inserted into the antecubital vein of the forearm and fasting blood samples were drawn. Postprandial blood samples were drawn at 2, 4, 6, and 8 h after the completion of a standardized breakfast. Plasma and serum were prepared by centrifugation at 4°C at 1,300×g for 10 min and stored either at −70°C or maintained unfrozen at 4°C (for lipoprotein sizing). Serum lipids and EDTA plasma lipoprotein sizes were determined by using nuclear magnetic resonance (NMR) spectroscopy, as previously reported. 38 The interassay coefficient of variance for determining the concentration of sd LDL particles and the mean size of LDL particles by NMR spectroscopy are 2.1% and 0.4%, respectively. 40 Serum insulin concentrations were determined by using an Immulite Chemiluminescent Analyzer (Siemens Diagnostics, Deerfield, IL); serum NEFA and plasma glucose (from Vacutainer tubes containing potassium oxalate and sodium fluoride) were determined using a clinical chemistry analyzer and clinical diagnostic kits (NEFA, Wako Diagnostics, Richmond, VA; glucose, Roche/Hitachi 902, Roche Diagnostics, Basel, Switzerland). Fasting serum glucose and insulin concentrations were used to calculate HOMA-IR, and postprandial (0, 2, 4, 6, 8 h) insulin and glucose concentrations were used to determine area under curve (AUC) for insulin and glucose and the Matsuda IS index. 6,41 –43
Statistical analysis
Prestudy power calculations were made using a one-sided t-test; an n=17 per group provided a power of 88.6% to detect significant treatment effects with group means of 1.0 and 0.9, standard deviation (SD) of 0.1, and alpha of 0.05. These calculations were based on primary outcome variables (TGs and concentrations of lipoprotein particles); glucocentric measures were not the primary outcome variables. The SAS proc mixed was used to fit a repeated measure, mixed model with a first-order autoregressive covariance structure among the repeated measures for data with more than two time points. Diet, time, and the interaction are the fixed effects and subjects within diets are the random effect as previously reported. 38 The areas under the curves were computed using the SAS ETS proc expand, which implements a trapezoidal rule approximation. 44 Results shown are the mean±standard error of the mean (SEM). P<0.05 is considered significant.
Results
Study subjects
Forty men entered the study, and 6 did not complete it. Three subjects dropped out from each of the two study groups (placebo, DHA). Two subjects dropped out because of time constraints (one in each group), two in the DHA group had a feeling of gas/bloating, and the other two (both in the placebo group) could not eat the test breakfast. Prestudy physical characteristics and fasting blood lipids for men who participated in the study are shown in Table 1. There were no significant differences between the two groups with respect to age, blood lipids, systolic or diastolic blood pressure, and heart rate; BMI was significantly greater in the placebo than in the DHA group (P<0.05).
All values are mean±standard error of the mean (SEM). Numbers with different superscripts are significantly different between the two groups (P<0.05, nonpaired t-test).
DHA, docosahexaenoic acid; BMI, body mass index; HDL-C, high-density lipoprotein cholesterol; LDL-C, low-density lipoprotein cholesterol; SBP, systolic blood pressure; DBP, diastolic blood pressure; BPM, beats per minute.
Dietary intake and supplements
Intake of fiber, cholesterol, total energy, and percent of energy from carbohydrate, protein, fat, and the types of fat did not differ between the two study groups during the baseline period. 38 Furthermore, usual food intake did not change significantly between the baseline and intervention periods in both groups. Mean compliance with the consumption of supplements as determined by the number of unused capsules was >90% for the DHA group and >85% for the placebo group. Analysis of the plasma and red blood cell fatty acid compositions at the start and end of the study also confirmed compliance regarding the intake of dietary fats. 38
Results from this study regarding the effects of DHA on markers of inflammation and blood lipids have been previously published. 36 –38 Here we report the effects of DHA supplementation on glucocentric and lipocentric markers of IS.
DHA supplementation (3 grams/day, 90 days) increased plasma glucose concentration by 4.70±1.33% (mean±SEM, n=17) as compared to the corresponding values prior to its supplementation (P<0.05); corresponding change in the placebo group was 2.70±1.28% (mean±SEM, n=17), and the difference in the changes was not statistically significant (p day×treatments=0.14; Table 2). Fasting insulin concentrations and HOMA-IR based on fasting insulin and glucose concentrations did not change in both the placebo and DHA groups. Also unchanged were the AUC (0–8 h) for glucose and insulin as well as the product of the AUC for glucose and insulin concentrations. Matsuda index based on the 0 and 2 hours glucose and insulin values (Table 1) and 0–8 h values also did not change in either study group.
Hypertriglyceridemic men supplemented their diets with DHA (3 grams/day) or placebo for 90 days. Fasting and postprandial (0–8 h) circulating markers of insulin resistance (IR) were determined before and after the supplements. Data shown are mean±standard error of the mean (SEM) (n=14–17/group). Within group comparisons [analysis of variance (ANOVA)] of day 0 and day 91 showed significant (P<0.05) change for variables bearing an asterisk (*). AUC=area under curve for 0, 2, 4, 6, and 8 h following a test meal. Reference values in healthy subjects for NEFA, sd LDL, and LDL size are 239–843 μEq/L 54 , 877–1793 nmol/L, and 19.8–21.9 nm, 10 respectively. Data for LDL and Apo proteins are taken from reference 36, which also includes the data regarding other lipids and lipoproteins.
DHA, docosahexaenoic acid; HOMA-IR, homeostasis model assessment of insulin resistance; AUC, area under the curve; NEFA, nonesterified fatty acids; sd LDL, small, dense low-density lipoprotein; Apo B, apolipoprotein B; Apo CIII, apolipoprotein CIII.
The lipocentric markers of IS (serum NEFA and plasma sd LDL; Table 2) and the ratio between TG and HDL-C (Fig. 1) were all significantly decreased by DHA supplementation (P<0.05), but did not change in the placebo group. DHA supplementation for 90 days decreased the concentrations of NEFA, sd LDL, and TG/HDL-C ratio by 13.0%, 21.7%, and 34.0%, respectively. It increased the mean LDL particle size by 3% (0.6 nm, P<0.05).
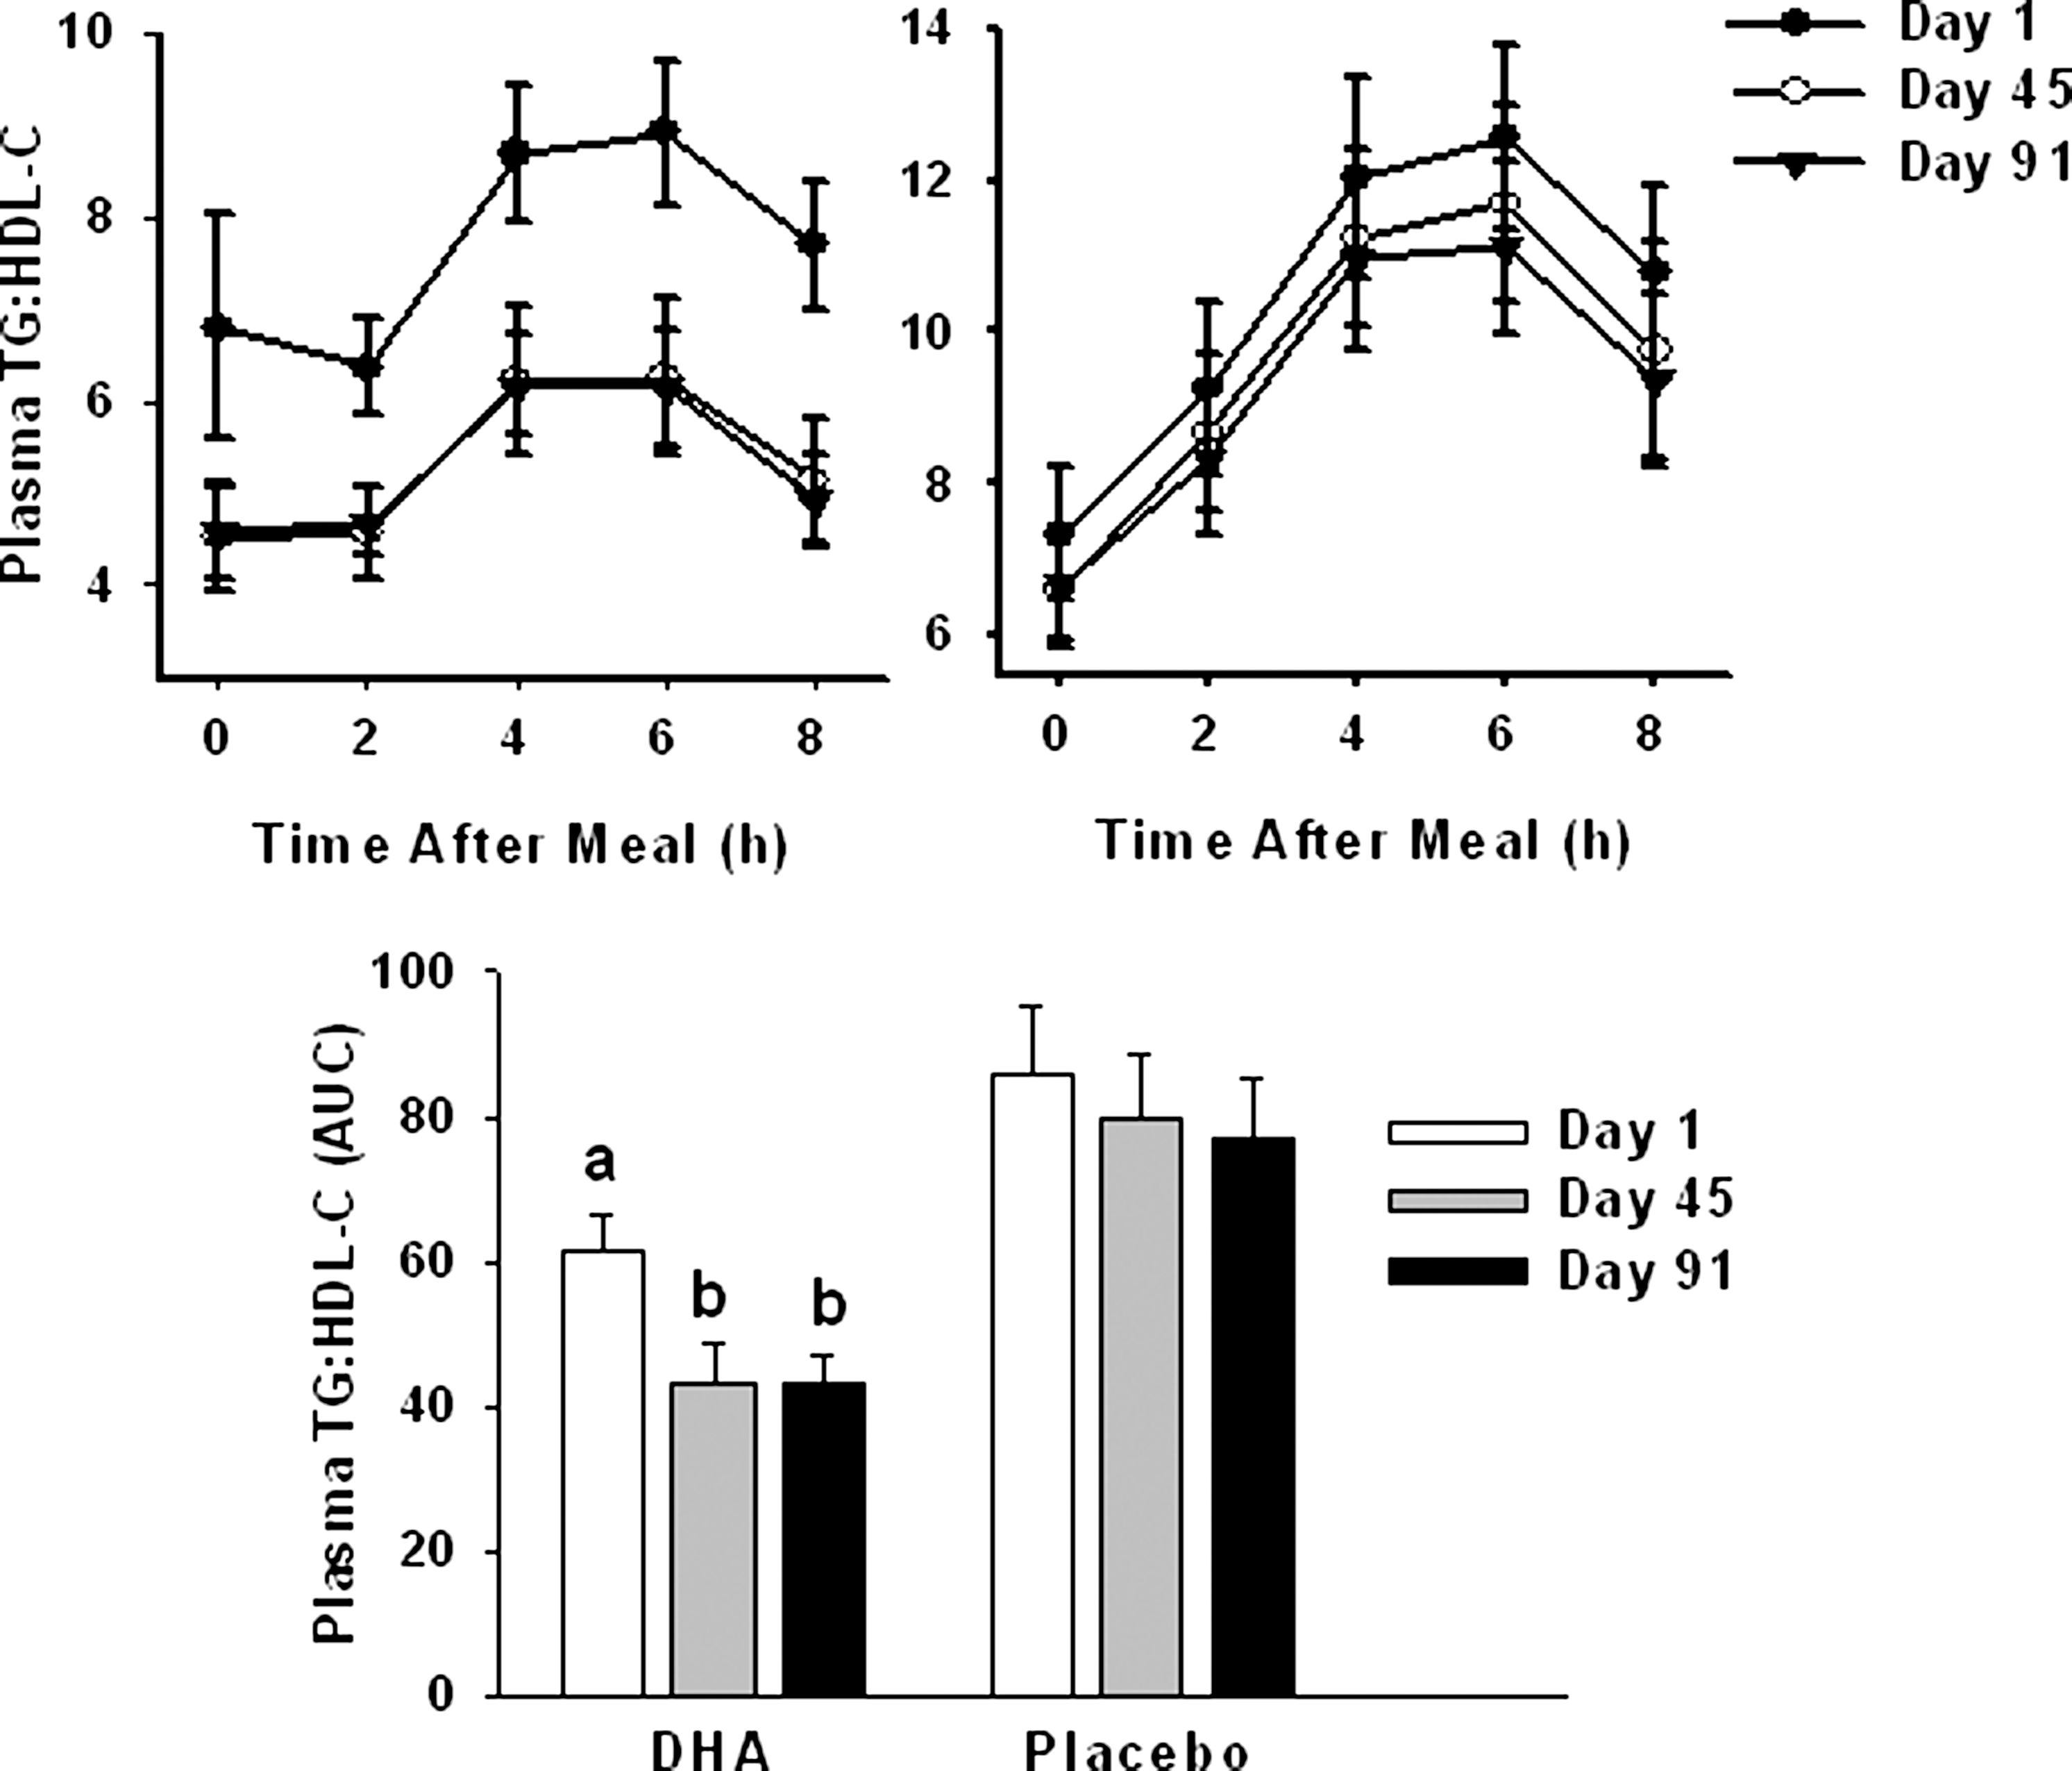
Effect of docosahexaenoic acid (DHA) supplementation (3 grams/day, 90 days) on plasma triglyceride/high-density lipoprotein cholesterol (TG/HDL-C) ratio (top left), placebo supplement (top right), and the area under the curve (AUC, bottom center) to hypertriglyceridemic men. Data are mean±standard error of the mean (SEM) (n=17/group). Bars with different letters for DHA group are significantly different (P<0.05). P=0.0005 for interaction between day and treatment for AUC. Reference ranges for triglycerides, HDL-C, and triglyceride: HDL-C ratios are 37–877 mg/dL, 17–87 mg/dL, and 0.8–28.3, 10 respectively.
Discussion
Results from our study with hypertriglyceridemic men show that DHA supplementation improved several markers of IS based on circulating lipids; it did not change markers based on the fasting or postprandial glucose and insulin concentrations, except a for 4.7% increase in fasting glucose (P<0.05). Increase in fasting glucose (2.7%) in the placebo group was not significant, and it did not differ from the increase in the DHA group (4.7%). Furthermore, HOMA-IR did not change in both groups. Together, these findings suggest that the small increase in plasma glucose by DHA may not be clinically relevant. Our results dealing with the lipocentric markers of IS are consistent with those reported with fish oils 9 –14 or DHA. 33,38,45 –49 Our findings regarding the effects of DHA on glucocentric markers of IR are consistent with those from a DHA study with overweight and obese adults where DHA failed to improve IS, 33 but differ from those of study with prediabetic children where DHA improved IS. 32 Both of these studies collected several blood samples within 2 h after an oral glucose load, but the dose and duration of DHA used and subject characteristics were quite different. Our study design differed from the designs of these two studies in several ways, but two major differences were that we used a meal test instead of OGTT and we collected the first blood samples 2 h after the intake of a meal and they collected samples every 30 min.
The lack of change in markers based on glucose and insulin concentrations in our study may be real, but most likely was due to the study design and the methods used. Our inability to detect enhanced IS following DHA supplementation may be because of several reasons. Fasting glucose and insulin are not the best markers to detect IR because they represent only hepatic IR and do not provide precise estimates of IMGU. Fasting glucose does not reveal IR until the pancreatic β-cells cannot keep up with the increased demand for insulin to maintain normal blood glucose levels. Surrogate estimates of IMGU based on FPI and FPG account for no more than 13% of the variability in insulin action in normal-weight groups, 30% in overweight groups, and 37% in obese groups. 4 In addition to the fasting samples, we also collected postprandial blood samples at 2, 4, 6, and 8 h after a test meal. Serum insulin and glucose concentrations did not differ between the two groups at all these postprandial time points (not shown); the AUC for both insulin and glucose concentrations also did not change (Table 1). Because the focus of this study was on blood lipids and not on glucose or insulin, we did not collect blood samples earlier than 2 h after the meal. It is possible we would have found differences in insulin concentrations if we had collected postprandial blood samples earlier than 2 h or if we had used the euglycemic clamp method.
Participants in our study had normal levels of fasting glucose and insulin. In a previous study, n-3 long-chain polyunsaturated fatty acids (LCPUFA; 70% DHA and 30 EPA%) supplementation improved IS in obese patients with increased IR, but not in the group with normal IS. 50 In another weight loss study with overweight women, n-3 PUFA supplementation improved IS in subjects with an inflammatory phenotype, but did not change in those without elevated markers of inflammation. 51 DHA supplementation decreased concentrations of several markers of inflammation in our study, but they were not accompanied by changes in glucocentric markers of IR. 36 Our results may differ from those of the previously published study because of differences in sex, weight loss, and the degree of inflammation.
One of the physiologic lipocentric markers of improved IS is a decrease in the ratio between the plasma TG and HDL-C concentrations. 11,13 Within 45 days of fatty acid supplementation, AUC values (0–8 h) for the ratio between TG and HDL-C decreased 34% and 7% in the DHA and placebo groups, respectively (Fig. 1), and this was maintained for the next 45 days. These differences resulted from a decrease in TG and an increase in HDL-C in the DHA group. Other lipocentric markers suggesting improved IS by DHA in our study include a decrease in sd LDL particles and NEFA and an increase in large LDL particles. 38
We, as well as others, have demonstrated that DHA reversed IR and nonalcoholic fatty liver disease (NAFLD) in animal models. 31,52 Furthermore, 4-OH DHA was a more potent stimulator of peroxisome proliferator-activated receptor γ (PPARγ) than pioglitazone, and it was nearly as effective as pioglitazone in preventing diabetes in rodent models. 53 We believe our inability to detect improvements in glucocentric markers of IS was most likely due to our study design, insensitive methods, and the health status of the study participants.
Our study had several limitations. The number of subjects who participated in the study was based on lipocentric markers; the glucocentric markers were not the primary end points. Plasma concentrations of glucocentric markers for IR were within the normal ranges for healthy subjects, and it may not be possible to improve them further with DHA. The methods used to evaluate glucocentric markers of IR lacked sensitivity. We may have found an effect of DHA on IR if we had used subjects with increased IR and used the euglycemic clamp, IST, or repeated blood draws after a glucose load test.
Regardless of the above limitations, our results demonstrate that the lipocentric surrogate markers are more sensitive than the glucocentric surrogate markers of IR. They emphasize the need to assess glucocentric markers directly (euglycemic clamp, IST) and also to consider the metabolic relevance, reproducibility, and sensitivity of the methods used when comparing results between different studies. Future studies with prediabetic subjects and improved methods of IS are needed to determine if DHA will improve IS.
Footnotes
Acknowledgments
We thank the study participants for their time and commitment, Dr. Ellen Bonnel and her staff for coordination of the study, and the BioAnalytical Support Laboratory for clinical chemistry analyses.
Author Disclosure Statement
Funds for this study were provided by USDA and DHA was donated by Martek Biosciences Corporation, a division of DSM Nutritional Products, Columbia, MD 21045. No competing financial interests exist.
Darshan S. Kelley, Bruce E. Mackey, David Siegel, and Leslie R. Woodhouse were responsible for conception and planning of study, data interpretation, and preparation of manuscript; Yuriko Adkins performed sample analysis and preparation of the manuscript; Arthur Swislocki was responsible for interpretation of data and preparation of the manuscript.