
Abstract
Objective:
Metabolic syndrome is associated with increased cardiac morbidity. The aim of this study was to evaluate exercise-induced hypertension (EIH) in men with metabolic syndrome and to explore potential associations with anthropometric and metabolic variables.
Methods:
A total of 179 normotensive men with metabolic syndrome underwent a maximal symptom-limited treadmill test. Blood pressure was measured at 5-min rest prior to exercise testing (anticipatory blood pressure), at every 3 min during the exercise, and during the recovery period. EIH was defined as maximum systolic blood pressure (SBP)≥220 mmHg and/or maximum diastolic blood pressure (DBP)≥100 mmHg.
Results:
Of the 179 men, 87 (47%) presented EIH. Resting blood pressure values at baseline were 127±10/83±6 mmHg in EIH and 119±9/80±6 mmHg (P=0.01 for both) in normal blood pressure responders to exercise. Anticipatory SBP and DPS were higher in the group with EIH (P=0.001). Subjects with EIH presented higher waist circumference (WC) (P<0.01), low-density lipoprotein cholesterol (LDL-C), and apolipoprotein B (ApoB) levels as well as insulin resistance (all P<0.05). Abdominal subcutaneous adipose tissue and total body fat mass were comparable between groups. Subjects with EIH had higher abdominal visceral adipose tissue (P<0.001). The best predictors of EIH were resting SBP and abdominal obesity. Each increment of 5 cm in WC was associated with an odds ratio of 1.30 (1.20–1.68) for EIH.
Conclusion:
About half of our subjects with metabolic syndrome showed EIH. These men are characterized by a worsened metabolic profile. Our data suggest that a treadmill exercise test may be helpful to identify a potentially higher risk metabolic syndrome subset of subjects.
Introduction
Systolic blood pressure (SBP) normally increases during exercise, but exercise-induced hypertension (EIH) among resting normotensive subjects has been demonstrated to be predictive for the later development of resting systemic hypertension. 3 It has been reported that exercise blood pressure predicted cardiovascular events and mortality, 4,5 because EIH has been demonstrated to be a predictor of myocardial infarction 6 and stroke. 7 EIH has been examined in several populations, such as subjects with a family history of systemic hypertension, 8 as well as normotensive, 9 borderline hypertensive, 10 and hypertensive individuals. 11 EIH has also been studied in patients with type 2 diabetes, 12 uncomplicated obesity, 13 subjects with sleep obstructive apnea syndrome, 14 and athletes, 15 but has never been specifically assessed in subjects with metabolic syndrome which is an obese population at higher risk of cardiovascular disease (CVD). 2,16 Because metabolic syndrome is a condition associated with insulin resistance as well as arterial stiffness, we hypothesized that blood pressure response to exercise would be abnormal in subjects with metabolic syndrome. Moreover, we speculate that among subjects with metabolic syndrome, those with EIH would present a worsened metabolic and anthropometric profile.
The aim of this study was to assess the presence of EIH in subjects with metabolic syndrome and to identify anthropometric, hemodynamic, and metabolic variables associated with EIH in drug naïve abdominally obese men with metabolic syndrome.
Materials and Methods
Study population
Originally, a total of 204 subjects were recruited from a larger study assessing the effect of a 1-year healthy eating–physical activity/exercise lifestyle modification program on insulin sensitivity in viscerally obese men. Details of methods and procedures have been published elsewhere. 17 Among the 204 patients who volunteered for this study, 23 were excluded because of a diagnosis of type 2 diabetes following an oral glucose tolerance test and 2 were excluded because of the diagnosis of resting hypertension [resting SBP≥140 mmHg and/or diastolic blood pressure (DBP)≥90 mmHg]. Included subjects were resting normotensive healthy but sedentary Caucasian men, aged from 18–70 years old with the feature of metabolic syndrome according to the International Diabetes Federation (IDF). 18 All men had abdominal obesity defined as waist circumference (WC)>94 cm and fasting triglycerides>1.7 mmol/L; they all met either the elevated blood pressure, elevated blood glucose level, or low high-density lipoprotein cholesterol (HDL-C) cutoff of the IDF metabolic syndrome criteria. We decided to study only men to control for potential female hormonal influence on blood pressure and endothelial function as well as metabolic parameters encountered in middle-aged women due to either menopause or menstrual cycle. Exclusionary criteria were the documented presence of CVD and resting systemic hypertension, renal or hepatic failure, and any cardiovascular-related medication. The use of aspirin was allowed. The study was approved by the local hospital ethics committee in accordance with the Declaration of Helsinki and all subjects gave informed consent.
Evaluations
Anthropometric, physiological and blood biochemical measurements were performed in all subjects after an overnight fast. Body fat mass was estimated by bioelectrical impedance (Tanita TBF-310, Tokyo, Japan). Blood pressure and heart rate (HR) were also measured manually. After a 20-min rest, brachial blood pressure of both arms was measured five times using a mercury sphygmomanometer, according to the Canadian Hypertension Education Program guidelines. 19 The average of five readings was used as the mean blood pressure value.
Blood sampling
Fasting glucose, insulin levels, and lipid profile were measured. Serum total cholesterol, triglycerides, and HDL-C concentrations were analyzed as previously described. 20 Low-density lipoprotein (LDL-C) cholesterol was calculated using the Friedewald formula. 21 Insulin sensitivity was estimated from the homeostasis model assessment (HOMA) model (fasting insulin×fasting glucose/22.5). 22
Exercise protocol
All subjects underwent a maximal symptom-limited (i.e., until volitional exhaustion) treadmill exercise test using the Bruce protocol. 23 Blood pressure, HR, and a 12-lead electrocardiogram (ECG) were recorded after a 5-min rest period in the supine position; the period was considered as exercise anticipation, 24 every 3 min during exercise and at 2 and 4 min during the recovery period in the supine position. During exercise testing, blood pressures were measured noninvasively with an automated sphygmomanometer equipped with a headphone circuit option (Model 412, Quinton Instrument Co., Bothell, WA) by the same cardiologist at each stage of the Bruce protocol. According to the American College of Sport Medicine, we defined EIH as maximum SBP≥220 mmHg and/or maximum DBP≥100 mmHg 25 at the end of the exercise protocol.
Computed tomography
Visceral adipose tissue (VAT) accumulation was assessed by computed tomography (CT), using previously described procedures. 26 Briefly, each participant was examined while being in the supine position with both arms stretched above the head. The scan was performed at the abdominal level (between the L2–L3 and L4–L5 vertebrae) by the use of an abdominal scout radiograph to standardize the position of the scan to the nearest millimeter. The total AT area was calculated by delineating the abdominal scan with a graph pen and then computing the AT surface with an attenuation range of−190 to −30 Hounsfield units. The abdominal VAT area was measured by drawing a line within the muscle wall surrounding the abdominal cavity. The abdominal subcutaneous (S) AT area was calculated by subtracting the VAT area from the total abdominal AT area. Total AT, SAT, and VAT volumes were also assessed. 26
Body composition
Body composition was assessed in each participant with dual-energy X-ray absorptiometry (DEXA), using a Lunar Prodigy whole-body scanner (GE Medical Systems) with software version 8.8. Fat mass, percentage of fat mass, and fat free mass were evaluated. All metal items were removed from the participants to ensure the accuracy of the measurement. The subjects were positioned in the center of the table for each scan. They were scanned using the default scan mode automatically selected by the Prodigy software.
Statistical analyses
Subjects were divided into two groups on the basis of their blood pressure response to exercise: (1) Subjects with EIH and (2) subjects with a normal response to exercise (NRE). Their anthropometric and metabolic variables were compared. A P value<0.05 was considered statistically significant. The results are expressed as mean±standard deviation (SD) unless specified otherwise. The data were analyzed using an unpaired t-test when data were normally distributed and with the Mann–Whitney test for data not normally distributed. We assessed the associations between exercise hemodynamic data and anthropometric and metabolic profiles with Spearman correlation coefficients and by the use of univariate and multivariate logistic regressions. Variables with a P value<0.10 in the univariate logistic regression model were included in the multivariate logistic regression model. We adjusted for multiple comparisons using Bonferroni adjustment.
Results
Of the included 179 participants, 85 (47%) presented with EIH. Thirty-nine (22%) subjects present only a maximal SBP≥220 mmHg whereas 12 (7%) participants showed exclusively a maximal DBP≥100 mmHg. Thirty-four (19%) subjects demonstrated both maximal SBP≥220 mmHg and maximal DBP≥100 mmHg. Baseline characteristics of subjects with and without EIH are presented in Table 1. The age range of the whole cohort was 29–64 years old. Although all participants presented IDF criteria for metabolic syndrome, 75 participants (86%) subjects with EIH presented National Cholesterol Education Program Adult Treatment Panel III (NCEP ATP III) criteria 1 for metabolic syndrome compared to 70 (75%) subjects with NRE (P=0.04). Age was comparable between the subjects with EIH and NRE. Similarly, fasting plasma glucose, insulin, total cholesterol, triglycerides, and HDL-C levels were comparable between groups. Both groups had resting blood pressure within the nonhypertensive range (84–139 mmHg for SBP and 52–89 mmHg for DBP), but subjects with EIH presented higher normal resting blood pressure compared to subjects with NRE (P<0.01). Subjects with EIH were heavier (P<0.01) and depicted higher WC values compared with subjects with NRE (P<0.01).
Data are mean±standard deviation (SD).
NRE, normal response to exercise; EIH, exercise-induced hypertension; BMI, body mass index; SBP, systolic blood pressure; DBP, diastolic blood pressure; HR, heart rate; TC, total cholesterol; LDL-C, low-density lipoprotein cholesterol; TG, triglycerides; ApoB, apolipoprotein B; HDL-C, high-density lipoprotein cholesterol; HOMA, homeostasis model assessment.
Subjects with EIH showed higher plasma LDL-C and apolipoprotein B levels (ApoB) levels compared to subjects with NRE (P<0.05). In addition, the subset of subjects with EIH was more insulin resistant, as estimated by HOMA-IR, compared to those with NRE (P<0.05). Insulin resistance correlated positively with both maximal SBP and anticipatory SBP (r=0.30, P=0.01 and r=0.25, P=0.01, respectively).
Table 2 depicts hemodynamic responses to exercise in both groups. By selection criteria, maximal exercise blood pressure was higher in the group with EIH, compared to subjects with NRE (P<0.001). Moreover, anticipatory SBP and DBP as well as the recovery blood pressure at both 2 and 4 min postexercise were higher in the group with EIH (P<0.01). Resting, anticipatory, maximal, and recovery HR were comparable between the two groups. However, HR recovery was lower in the group with EIH at 2 and 4 min (52±12 vs. 57±11 beats per min; P=0.04 and 66±16 vs. 72±17 beats per min; P=0.06 at 2 and 4 min, respectively). We also found a positive relation between SBP increment during exercise and anticipatory blood pressure (r=0.40, P=0.01) (Fig. 1).
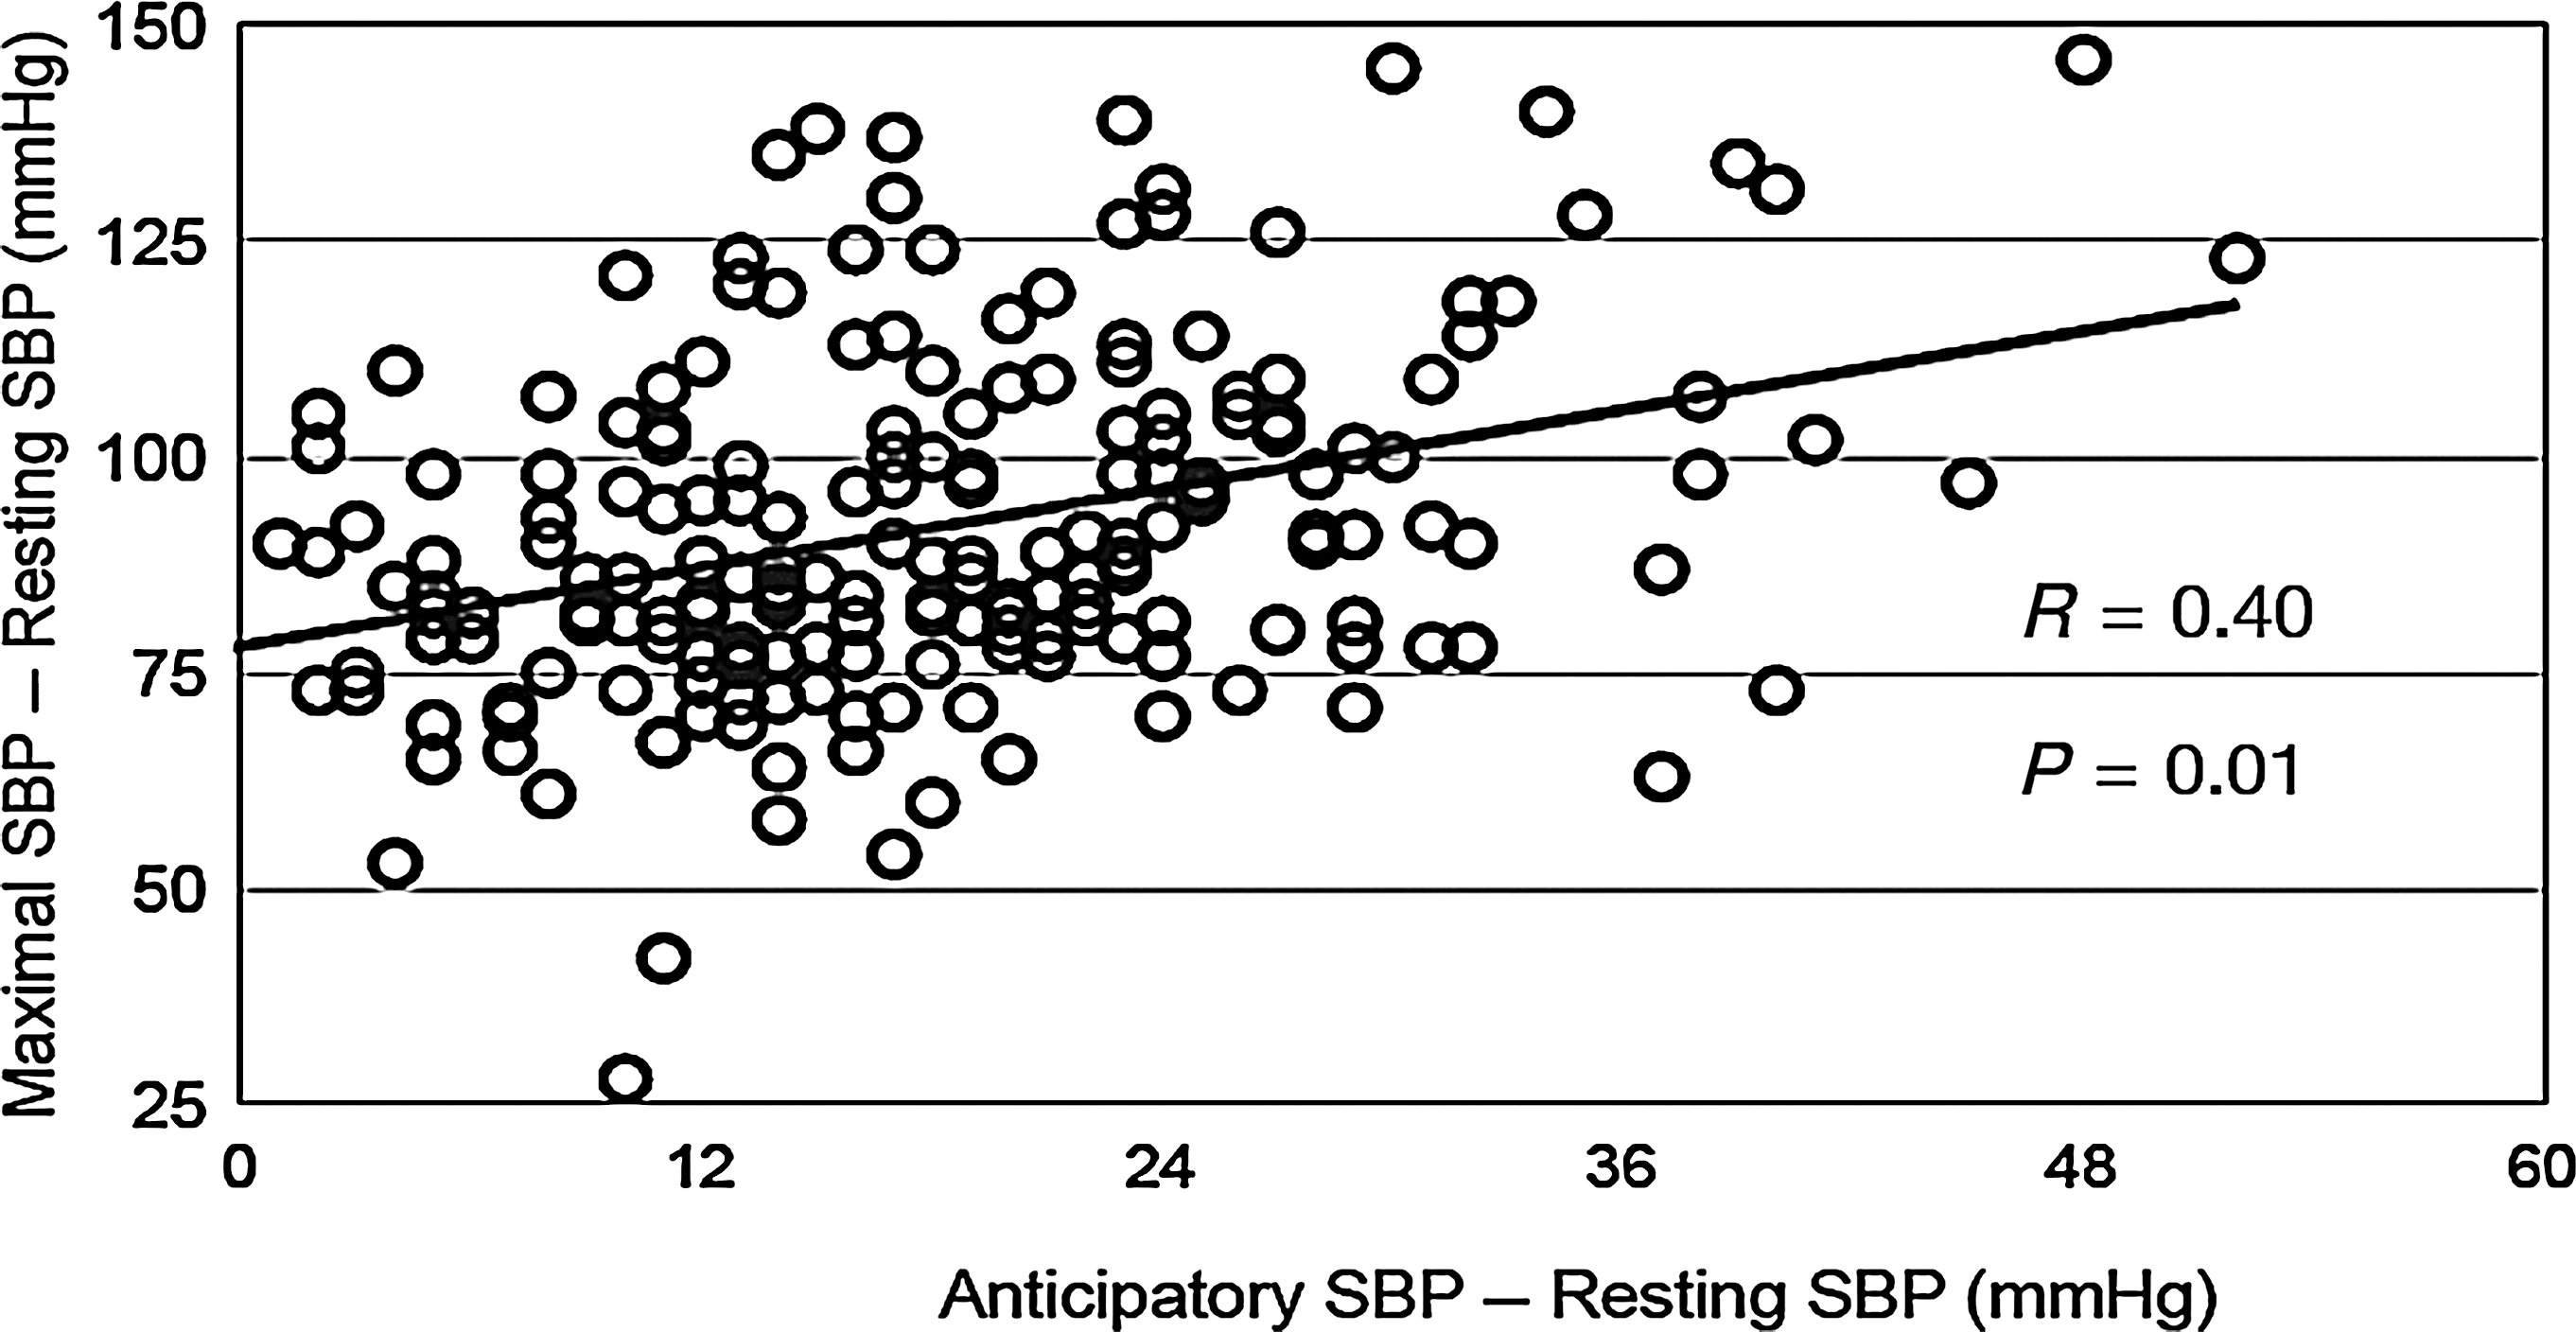
Relation between systolic blood pressure (SBP) increment during exercise and anticipatory blood pressure (r=0.40; P=0.01). y axis, Delta SBP (maximal SBP−resting SBP); x axis, anticipatory blood pressure−resting SBP.
Data are mean±standard deviation (SD).
NRE, normal response to exercise; EIH, exercise-induced hypertension; SBP, systolic blood pressure; DBP, diastolic blood pressure; bpm, beats per minute; HR, heart rate.
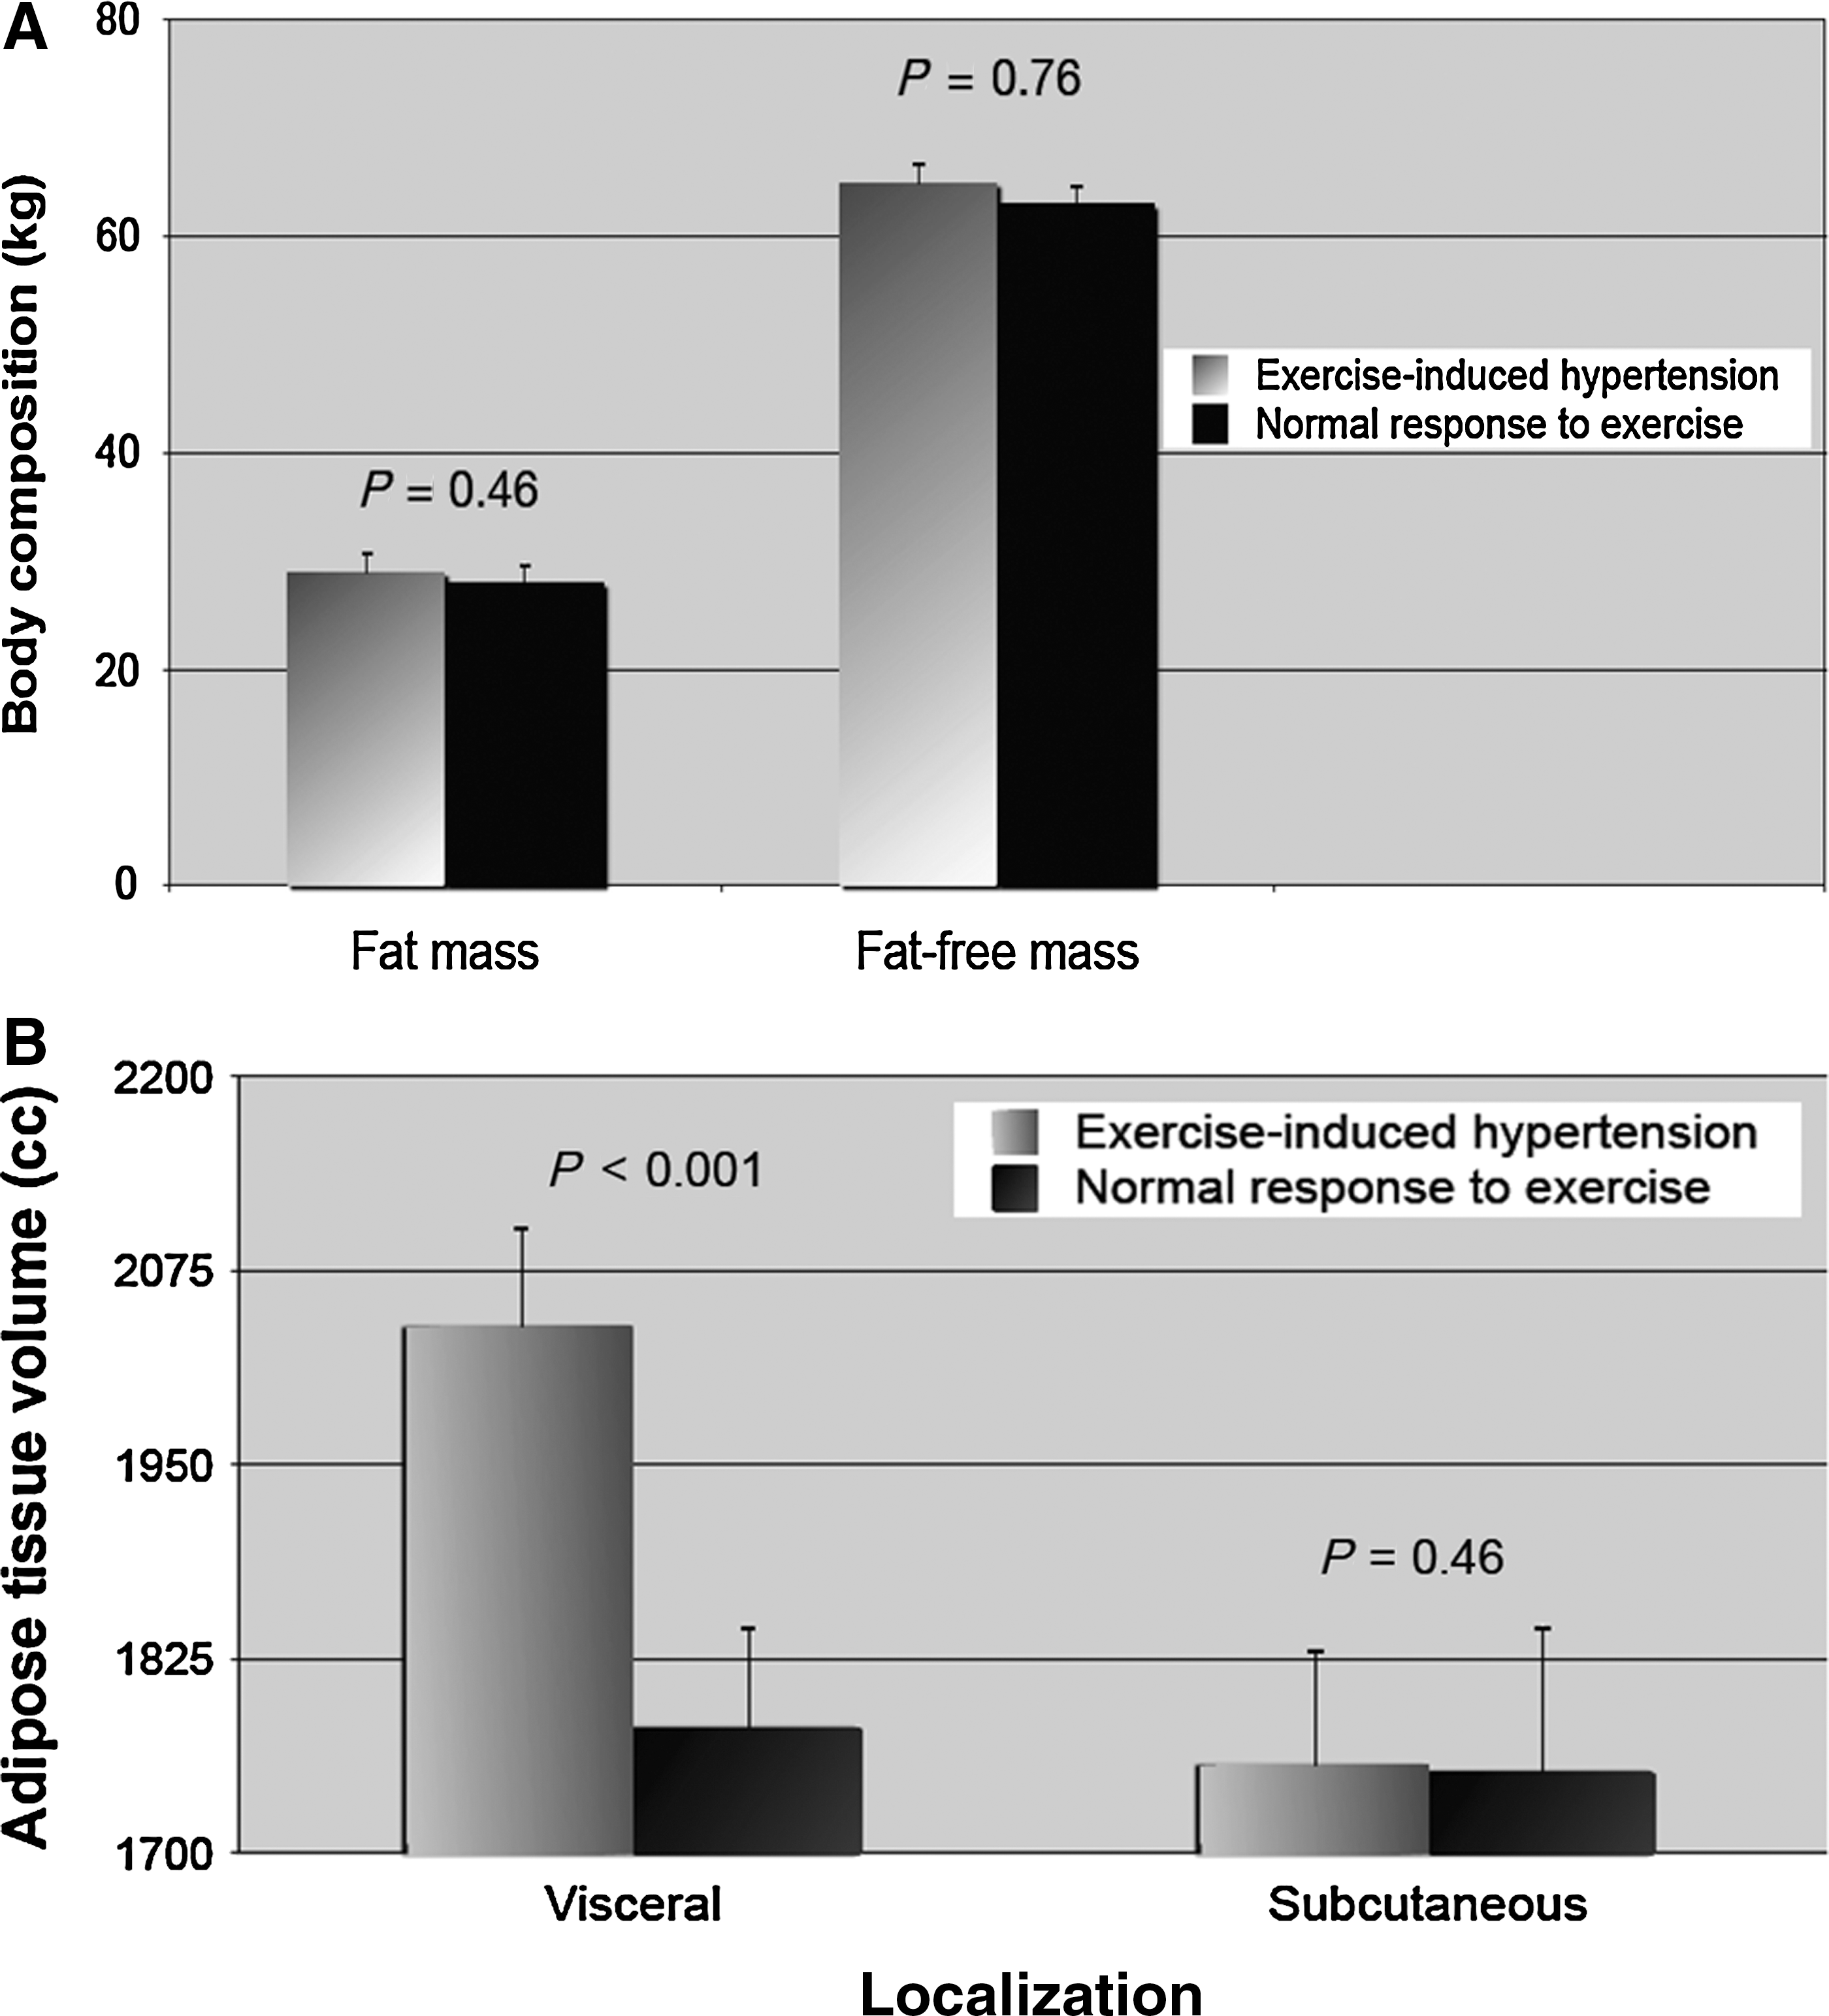
With regard to body composition, we found no difference in total fat and total fat-free mass between the two groups. When we examined abdominal AT accumulation assessed by CT scan, we found that subjects with EIH had higher visceral fat compared to those with NRE. SAT areas were comparable between the two groups (Fig. 2A–B). Total and VAT volumes were higher in the subjects with EIH (3803±821 vs. 3572±778 cm3; 2029±449 vs. 1789±450 cm3; all P<0.01; for total and visceral fat volumes, respectively). There was a positive correlation between maximal exercise SBP and WC (r=0.30; P<0.001). We also found a positive correlation between maximal SBP and VAT as well as with VAT volume measured by CT (r=0.30, p<0.001; r=0.35, P<0.001, for VAT and VAT volume, respectively). Finally, we found a strong correlation between WC and adipose VAT volume (r=0.80, P<0.001).
Variables included in the multivariate logistic regressions model were the following: Age (P=0.09), weight (P=0.009), body mass index (BMI) (P=0.07), resting SBP (P=0.01), LDL-C (P<0.01), WC (P<0.01), AT volume (P<0.01), AT accumulation assessed by CT scan (P<0.05), HOMA (P=0.03), and ApoB (P=0.04). Multiple regression analyses revealed that EIH was mainly explained by resting SBP, WC, and LDL-C (Tables 3 and 4). Each increment in 5 mmHg in resting SBP was associated with an odds ratio (OR) of 1.5 (1.3–1.8) for EIH. Moreover, each increment of 0.5 mmol/L in LDL-C was associated with an OR of 1.3 (1.1–1.6) for EIH. Also, each increment of 5 cm in WC was associated with an OR of 1.4 (1.1–1.7) for EIH (Fig. 3). VAT, AT volume, and BMI were not predictive of EIH when WC was entered into the statistical model.
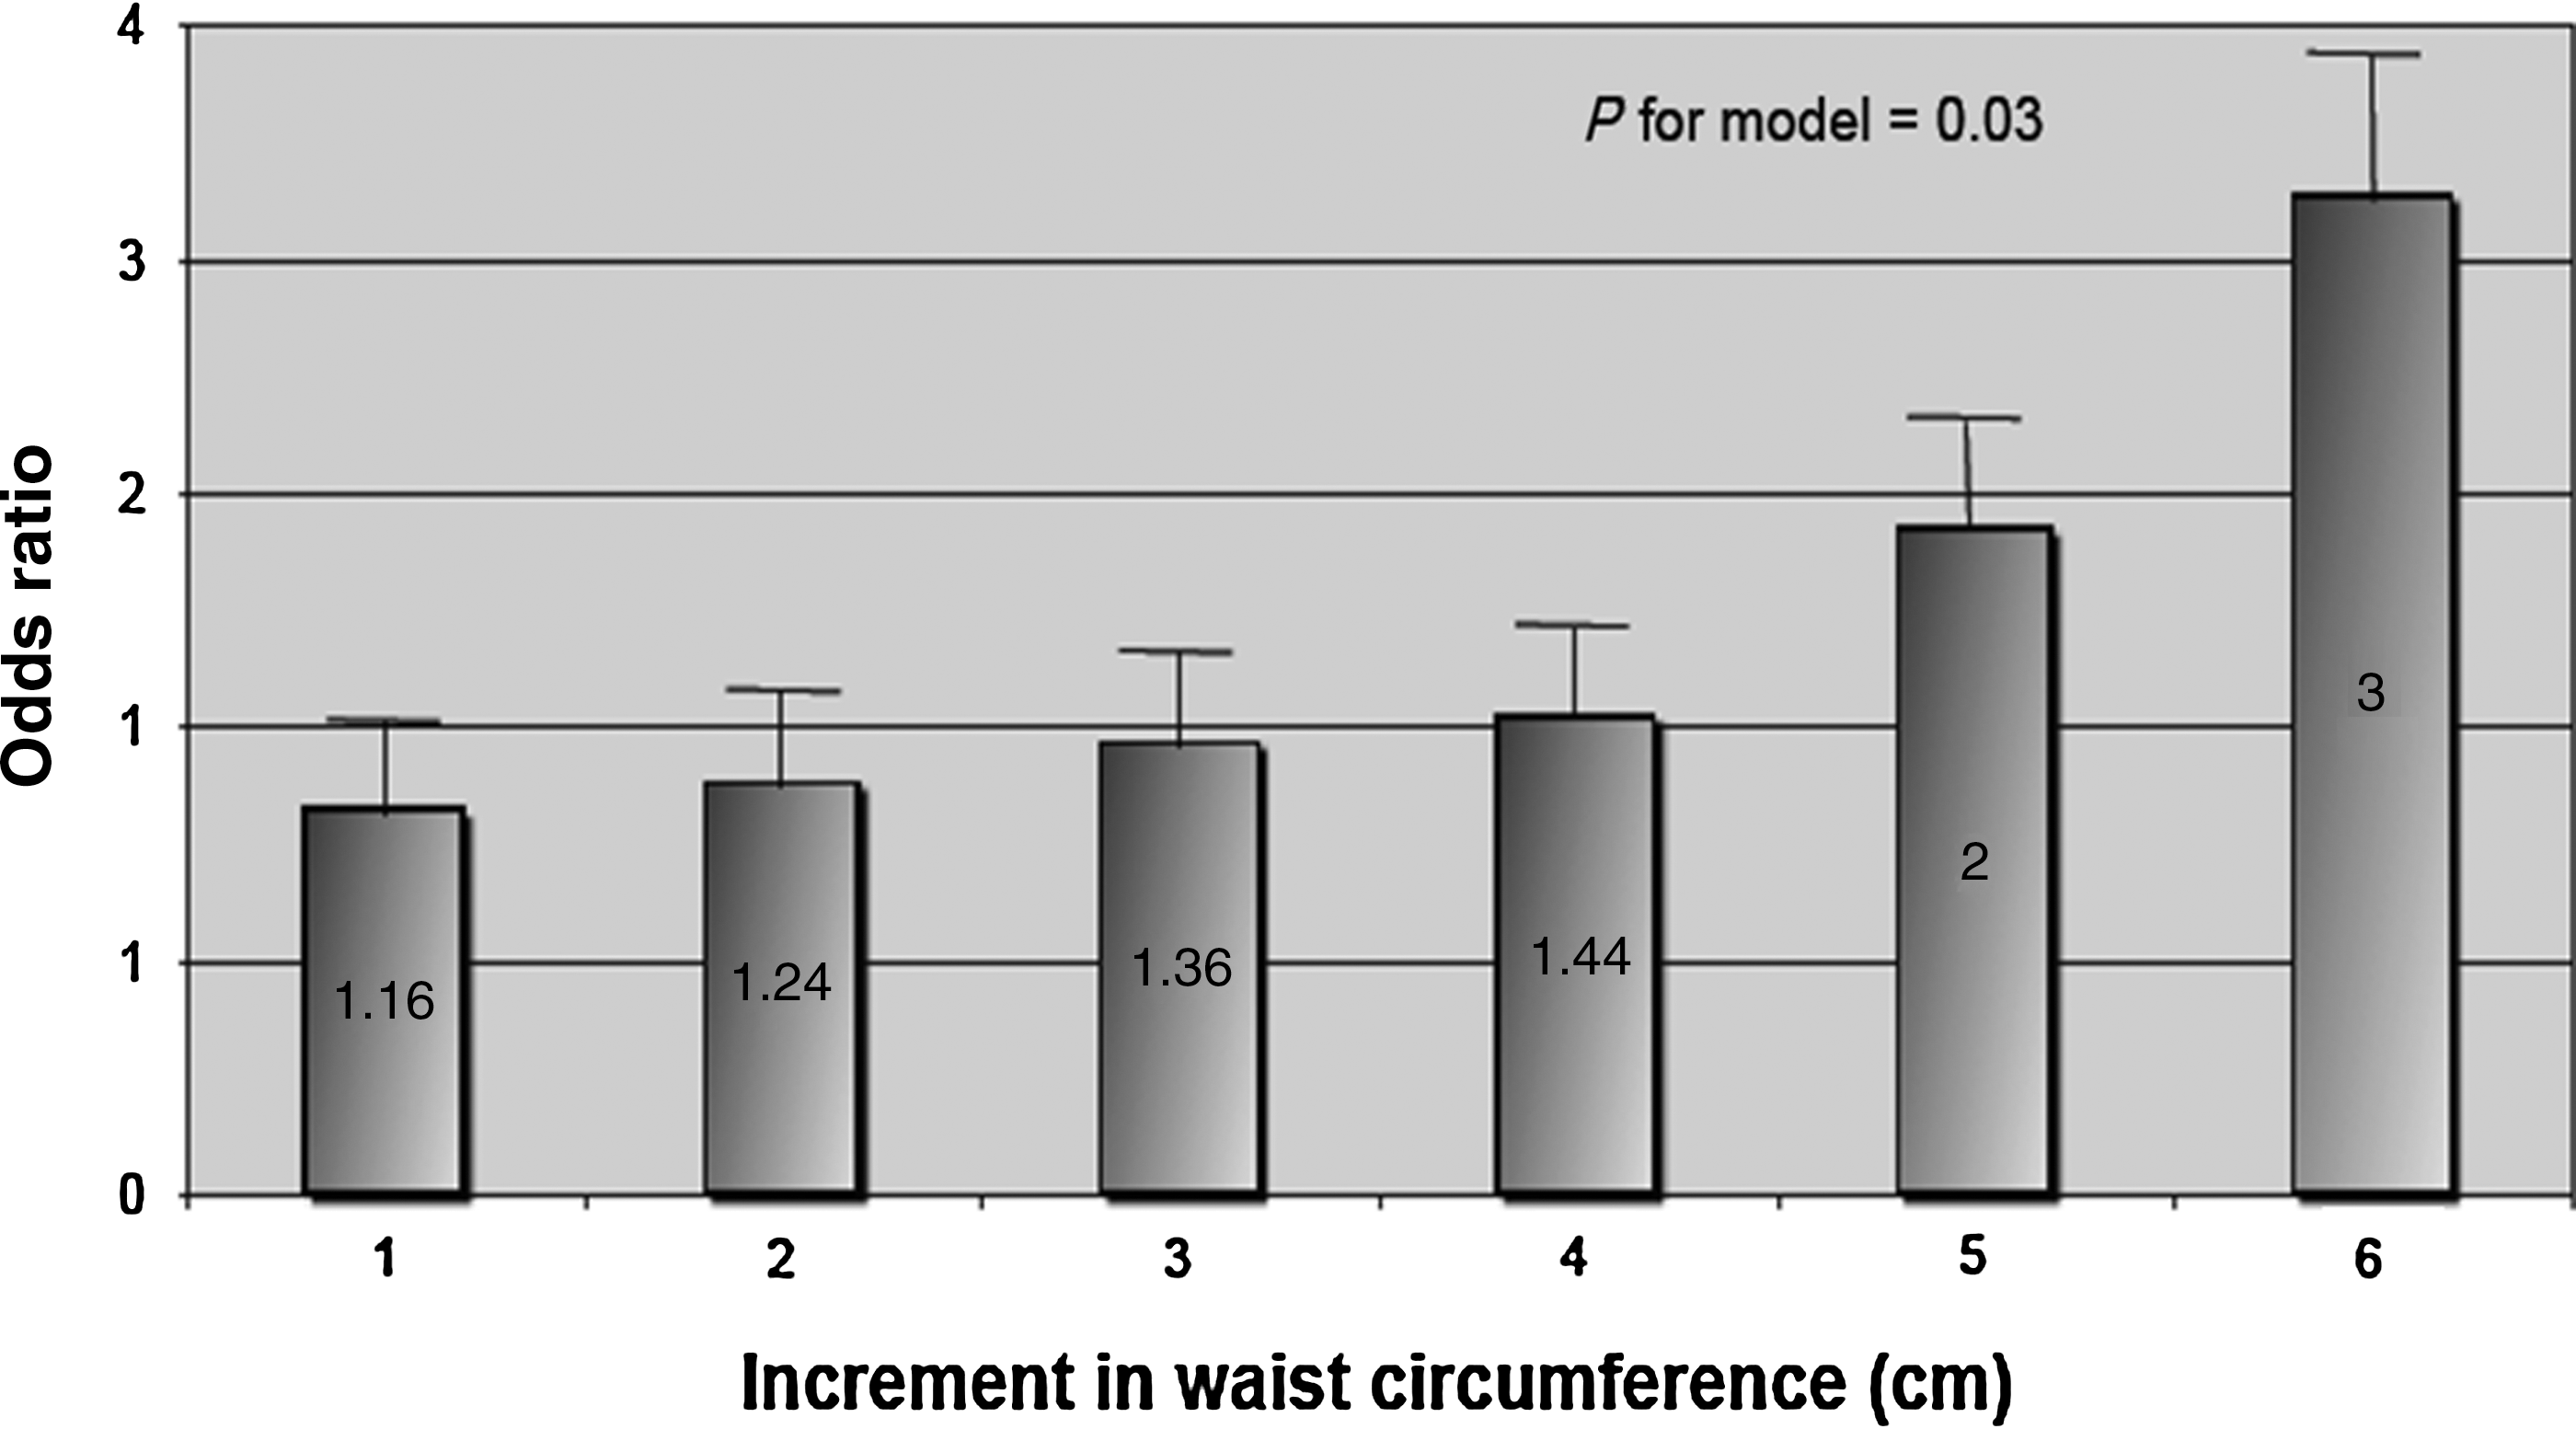
Odd ratios for exercise-induced hypertension (EIH) according to increment in waist circumference. x axis, increment in waist circumference in centimeters; y axis, odds ratio for EIH (P=0.03).
EIH, exercise-induced hypertension; SBP, systolic blood pressure; WC, waist circumference; LDL-C, low-density lipoprotein cholesterol; ApoB, apolipoprotein B; BMI, body mass index; AT, adipose tissue.
CI, confidence interval; SBP, systolic blood pressure; LDL-C, low-density lipoprotein cholesterol; WC, waist.
Discussion
The primary objective of the present study was to assess the presence of EIH in a sample of asymptomatic normotensive men with features of metabolic syndrome. We also evaluated the associations between EIH and metabolic and adiposity variables in this sample of men. We first observed that EIH was frequent (47%) in these asymptomatic Caucasian subjects with features of metabolic syndrome. We also showed that subjects with EIH presented a worsened anthropometric and metabolic profile than abdominally obese men with normal exercise blood pressure.
Metabolic syndrome and systemic hypertension
Systemic hypertension is a global public health problem associated with increased risk for cerebral, cardiac, and renal events. Systemic hypertension frequently clusters with other cardiometabolic risk factors, including hyperglycemia, low levels of HDL-C, and high triglyceride levels. Elevated blood pressure is a component of metabolic syndrome and is frequently observed in obese patients. The mechanisms explaining the relation between obesity and systemic hypertension are multiple. Damage to the endothelium is an important risk factor for the development of systemic hypertension because it leads to structural changes, such as thickening of the intima and the media of the vessel wall. 27 Although mechanisms linking obesity with endothelial dysfunction have not yet been fully elucidated, several factors may contribute to this abnormality, including decreased nitric oxide responsiveness, dyslipidemia, and inflammation. Another possible link between obesity and systemic hypertension is insulin resistance. Insulin has many actions that can lead to systemic hypertension, including activation of the sympathetic nervous system, activation of the renin–angiotensin–aldosterone system, and endothelial dysfunction. 28 In obese patients, insulin resistance also promotes baroreceptor dysfunction which can be involved in the pathogenesis of high blood pressure in this population. 29
Exercise-induced systemic hypertension
The phenomenon of an abnormal blood pressure response to exercise has been studied by several investigators who have demonstrated that blood pressure response to exercise was higher in hypertensive subjects than in normotensive individuals. 30 Later, other authors noted that some normotensive subjects at rest presented EIH. 12,31 The prevalence of EIH has been shown to vary between 5% 32 in healthy subjects to 40% in hypertensive or borderline hypertensive subjects. 31 In normotensive healthy men, EIH has been reported to be an independent predictor of future systemic hypertension. In the Coronary Artery Risk Development in Young Adults (CARDIA) study, the presence of an exaggerated blood pressure response to exercise was associated with an increased risk of developing resting systemic hypertension. 33 Incidence of systemic hypertension in subjects with EIH increased four-fold in the Framingham Heart Study subjects, 34 and a recently published prospective study of 219 young healthy men 35 indicated that an elevated blood pressure to maximal exercise was associated with a risk of future systemic hypertension of 2.31 [confidence interval (CI) 1.45–6.25]. Furthermore, in a 17-year follow-up study, including 4907 healthy subjects, Fillipovsky et al. demonstrated that an exaggerated increase in SBP during exercise was associated with a higher risk of cardiovascular and all-causes mortality. 36 This association was independent of age, sex, resting blood pressure, and other risk factors. Others have found an increased risk of myocardial infarction and stroke associated with EIH in healthy middle-aged men. 6,7,37
Metabolic syndrome and EIH
Blood pressure response to exercise has been evaluated in many populations. Hypertensive patients, 13 borderline hypertensive subjects, 10 athletes, 38 children with a family history of high blood pressure, and subjects with coronary artery disease 39 are among the most studied populations. In addition, EIH has been evaluated in uncomplicated obesity 13 and in subjects with type 2 diabetes, 22 as well as in subjects with obstructive apnea syndrome. 14 This phenomenon has never been evaluated in subjects with metabolic syndrome. We found that 47% of our subjects presented with EIH. Even if all subjects of our cohort presented with metabolic syndrome, those with EIH showed further deterioration in their cardiometabolic risk profile. They showed higher weight, BMI, and WC. Moreover, they exhibited more severe metabolic abnormalities, such as higher LDL-C, ApoB, fasting blood glucose, as well as insulin resistance. The worst metabolic and anthropometric profile found in subjects with EIH may be related to a worsened endothelial dysfunction, thus explaining their exaggerated blood pressure response to exercise. Insulin resistance found in subjects with metabolic syndrome may be of importance in the pathogenesis of EIH because it is associated with endothelial dysfunction that could participate to the abnormal blood pressure elevation during exercise. Insulin resistance is also associated with the activation of both the autonomic nervous and the renin–angiotensin–aldosterone systems. 20 Accordingly, in subjects with type 2 diabetes, Altun et al. showed that subjects with higher insulin resistance exhibited a higher blood pressure response to exercise and that maximal exercise SBP correlated with insulin resistance. 22 In addition, we showed that LDL-C and ApoB were higher in the group with EIH and that both correlated positively with maximal SBP and DBP. This is in accordance with Brett et al., 40 who demonstrated in healthy subjects without metabolic syndrome that changes in DBP during maximal exercise test correlated with insulin resistance and with LDL-C. LDL-C is strongly associated with impaired reactivity to endothelium-dependent and, to a lesser extent, endothelium-independent vasodilators. 41 Thus, LDL-C could be implicated in EIH in subjects with metabolic syndrome perhaps by affecting endothelial function.
In our study, one of the more important predictors of EIH was WC. Previously, we reported that the documented association between obesity, fasting insulin, insulin sensitivity, and blood pressure was largely explained by concomitant variation in WC. 20 The relation between exercise blood pressure and WC has never been studied before, but Mundal et al. 42 described a strong correlation between exercise blood pressure and BMI. In the present study, we found that subjects with metabolic syndrome and exaggerated blood pressure to exercise presented higher VAT accumulation while abdominal SAT accumulation and total fat mass were comparable in both groups. Multivariate statistical analysis revealed that BMI and VAT accumulation was not predictive of EIH when WC was entered into the statistical model.
Limitations
Our study presented some limitations. First, we studied only men. We chose to study male patients because we wanted to control hormonal variations that could have influenced blood pressure response to exercise. Another limitation of the present study is the absence of a control group without metabolic syndrome. However, an important goal of this study was to investigate the importance of some anthropometric and metabolic variables in the genesis of EIH. Consequently, the groups with NRE should be considered as control subjects for this study.
Conclusion
The present study evaluated EIH in patients with metabolic syndrome. We found a high percentage of EIH in patients with metabolic syndrome. This exaggerated blood pressure response to exercise was associated with a worsened metabolic and anthropometric profile. These results provide evidence that subjects with metabolic syndrome represent a heterogeneous population of subjects for whom a treadmill exercise test might be useful in the identification of a subset of subjects with higher cardiovascular risk, unmasking subjects with EIH. This needs further long-term evaluation.
Footnotes
Acknowledgments
This study was supported by the Institut universitaire de cardiologie et de pneumologie de Quebec (IUCPQ) research foundation, the Canadian Diabetes Association, and the Canadian Institute of Health Research. Dr. Paul Poirier is a senior clinical researcher of the Fonds de recherche en santé du Québec (FRSQ). We would like to express our gratitude to the study participant for their contribution to the present study and to the staff for their dedicated work.
Author Disclosure Statement
The authors declare that no conflicting financial interests exist.
Author contributions were as follows: Valérie Gaudreault, design and conduct of the study, data collection and analysis, data interpretation and manuscript writing; Jean-Pierre Després, design and conduct of the study, data interpretation, and manuscript writing; Natalie Alméras, design and conduct of the study, data interpretation, and manuscript writing; Jean Bergeron, design and conduct of the study, data collection and analysis, data interpretation, and manuscript writing; Angelo Tremblay, manuscript writing, data interpretation; Caroline Rhéaume, manuscript writing, data interpretation; Paul Poirier, design and conduct of the study, data collection and analysis, data interpretation, and manuscript writing.