
Abstract
Background:
Effects of dairy consumption on metabolic health and adiposity are inconsistent. Most clinical trials have investigated dairy intake, frequently during caloric restriction, in overweight or obese populations but not in a metabolic syndrome population. We investigated the effect of increased dairy intake without caloric restriction on anthropometrics, plasma lipids, and glucose in typically low-dairy consumers who met the National Cholesterol Education Program Adult Treatment Panel III (NCEP ATP III) metabolic syndrome criteria.
Methods:
Male (n=14) and female (n=23) adults (54.1±9.7 years) with metabolic syndrome were randomized to consume low-fat dairy (LFD) (10 oz of 1% milk, 6 oz of nonfat yogurt, 4 oz of 2% cheese) or carbohydrate control (CNT) (1.5-oz granola bar and 12 oz of 100% juice) foods for 6 weeks in a crossover study design. Anthropometrics, metabolic syndrome parameters, insulin resistance, and parathyroid hormone were measured. Body composition was analyzed by a dual-energy X-ray absorptiometry scan for a subset of subjects (n=22).
Results:
LFD modulated metabolic syndrome parameters differently according to gender. Following LFD, men had lower glucose (95.4±9.1 vs. 98.9±10.6 mg/dL, P=0.048), whereas women had lower body weight (BW), waist circumference, and body mass index (P<0.01) compared to CNT. Women also had lower energy intake following LFD compared to CNT. Increases in phosphorus (a dairy nutrient) were negatively correlated with decreases in BW (r=−0.537; P<0.01) and body fat in women (r=−0.593, P<0.025), whereas the decreases in energy intake had no correlation with anthropometrics.
Conclusions:
Three dairy servings/day promoted small but significant improvements differentially by gender in a metabolic syndrome population.
Introduction
M
Milk consumption contributes <10% of energy intake, but provides up to ∼30%, 40%, or 50% of the daily intake for potassium, calcium and vitamin D, respectively. 6 However, US adults consume only ∼60% of the recommended dairy intake. 7 Recent systematic reviews or meta-analyses have reported a protective effect of increased dairy intake against obesity, 8,9 hypertension, 10 –12 and insulin resistance, 13 all of which are components of metabolic syndrome, 14 thus supporting increased dairy intake in this population. Yet there are inconsistencies in published studies. On the one hand, randomized clinical trials have shown that increased dairy consumption reduced hypertension 15,16 and waist circumference (WC) 16,17 in overweight or obese subjects. Although glucose was unchanged in some studies, 18,19 others found decreases in insulin and insulin resistance. 15,16 In contrast, van Loan et al. 20 found no changes in metabolic syndrome parameters with four or more dairy servings compared to one or less serving/day. Van Meijl et al. 19 found that dairy reduced systolic blood pressure (SBP), but no other metabolic syndrome components as compared to carbohydrate controls, and in a 6-month parallel design intervention, 17 three to five dairy servings/day decreased WC only in subjects who were low calcium consumers.
Previous studies examining the effect of dairy intake on metabolic syndrome markers have been conducted in overweight individuals, 20,21 in those with some metabolic syndrome parameters 17,19 or in weight loss interventions. 22 One recent study examined the effect of increased dairy exclusively in metabolic syndrome subjects under caloric restriction. 23 In the current study, we aimed to determine the effect of low-fat dairy products (LFD) as a whole without separating the individual components on metabolic syndrome markers in adults who met the National Cholesterol Educational Program Adult Treatment Panel III (NCEP ATP III) criteria and were low dairy consumers. We hypothesized that LFD consumption would reduce metabolic syndrome markers compared to isocaloric control foods, under weight maintenance conditions.
Materials and Methods
Study design
Thirty-seven male and females adults were recruited from the University of Connecticut and surrounding communities to participate in a 16-week crossover study. Subjects were randomized to incorporate LFD (10 oz of 1% fat milk, 6 oz of nonfat yogurt, and 2 oz of 2% cheese, providing ∼3 dairy servings/day) or control foods (CNT) (1.5-oz granola bar and 12 oz of juice) into their usual diet for 6 weeks. Following a 4-week washout, participants consumed the alternate treatment for additional 6 weeks. LFD foods had similar energy content but were higher in protein and calcium and lower in carbohydrates compared to CNT (Table 1). CNT were matched for energy content and chosen for their lack of calcium and ease of dietary inclusion. No additional dairy was consumed during LFD; however, subjects were allowed to maintain baseline dairy consumption during the washout and CNT periods. Subjects received nutritional counseling and maintained their usual diet and physical activity patterns. Study inclusion criteria included meeting the NCEP ATP III definition of metabolic syndrome, 14 being a low-dairy consumer (≤1/serving dairy per day), and having stable weight (≤5% weight change) for the preceding 3 months. Individuals with allergies to the intervention foods, who were pregnant or breast feeding, were supplementing with >250 mg calcium, or were diagnosed with diabetes, cardiac, or renal diseases were excluded from participation. Additionally, subjects with very high values of triglycerides (TGs) (>500 mg/dL), glucose (>126 mg/dL), or blood pressure (>140/90 mmHg) were excluded from the study. Participants visited the Department of Nutritional Science biweekly to pick up intervention foods (provided for free) and to submit food consumption log sheets to monitor study compliance. Body weight (BW) was measured during each visit. If participants were gaining more than ≥10% of their baseline BW, they were removed from the study. Two subjects withdrew due to personal reasons, and 2 subjects were excluded from analysis, one due to changes in medications and the other because BW gain exceeded study limits. Data from 33 subjects (12 men/21 women) were included in this study. The study protocol was approval by the University of Connecticut Institutional Review Board and all subjects gave written informed consent.
Dietary intake
Subjects were trained on recording dietary intake and submitted food records at the beginning (3-day record), middle (5-day record), and end (5-day record) of each intervention. Dietary intake was analyzed with the Nutritional Data System for Research (NDRS, University of Minnesota, 2008).
Anthropometrics, blood pressure, and body composition
WC was measured in duplicate with a nonflexible tape on bare skin immediately above the iliac crest following a complete exhalation. Body mass index (BMI) was calculated (kg/m2) from subject height measured to the nearest 0.5 cm with a stadiometer, and BW was measured on a digital scale to the nearest 0.10 kg. Blood pressure was measured with an Omron HEM-780 automated monitor. Body composition was determined by a dual-energy X-ray absorptiometry (DXA) in a subset of subjects (n=22) (Prodigy™, Lunar Corporation, Madison, WI). DXA scans were analyzed by the same blinded technician.
Blood processing
Blood was drawn at baseline and at each intervention conclusion after a 12-h fast into chilled EDTA Vacutainer tubes and centrifuged at 2000×g for 20 min. Collected plasma was preserved (1 mL/L sodium azide, 5 mL/L aprotonin) immediately following the blood draw. Aliquots were stored at −80°C until analyses.
Analyses
Plasma TGs, total cholesterol (TC), high-density lipoprotein cholesterol (HDL-C), and glucose were measured simultaneously by the Cobas C-111 Clinical Analyzer (Roche Diagnostics, Indianapolis, IN). Low-density lipoprotein cholesterol (LDL-C) was calculated using the Friedewald equation. Insulin was measured from fasting blood by an enzyme-linked immunosorbent assay (ELISA) kit (Mercodia, Uppsala, Sweden). Insulin resistance was calculated using homeostasis model assessment (HOMA). 24 Parathyroid hormone (PTH) was measured by ELISA (GenWay Biotech, San Diego, CA) and quantified by a BioTek plate reader (BioTek Instruments, Inc. Winooski, VT). All sample assays were performed in duplicate.
Statistical analyses
Data are reported as mean±standard deviation (SD), with P<0.05 considered significant. Paired t-tests were used to determine differences between treatments. Pearson correlations were used to determine associations between dietary components and metabolic syndrome parameters. SPSS for windows, version 21.0 (Chicago, IL.) was used for all analyses.
Results
Baseline characteristics are presented in Table 2. Most participants were women (64%), and 97% met the criteria for WC. No gender difference was seen in age, BW, BMI, WC, diastolic blood pressure (DBP), or fasting glucose. Women had higher HDL-C and LDL-C and lower TGs values and lower SBP compared to men (Table 2). Women took more antihypertensives (45% vs. 27%), while men took more (36% vs. 15%) statins.
All data are presented as mean±standard deviation (SD). The P values indicate differences between men and women.
BMI, body mass index; HDL-C, high-density lipoprotein cholesterol; LDL-C, low-density lipoprotein cholesterol.
Baseline dietary intake is shown in Table 3. Women consumed less energy compared to men at baseline, but did not differ in the percent energy from macronutrients. Dietary calcium was the same for both genders, although women consumed more supplemental calcium. Subjects were >98% compliant during both phases of the study and compliance did not differ between treatment foods or gender. Nutritional intake during both interventions is shown in Table 4. There were no differences in dietary intake before each intervention (data not shown). Energy intake differed by gender, whereas there were no gender differences in macronutrient intake expressed as percent of energy. Subjects consumed less carbohydrate and greater protein levels during LFD compared to CNT whereas fat intake remained constant (Table 4). As expected, nutrients that are high in dairy products (calcium, vitamin D, potassium, phosphorus, and leucine) were higher during LFD compared to CNT (Table 4). In males, energy intake did not differ between interventions; however, women consumed less energy during LFD compared to CNT.
Baseline dietary intake was determined from self-reported 3-day food records. Values are presented as means±standard deviation (SD). The P values indicate differences between men and women.
Subjects consumed LFD or CNT foods, in random order, for 6 weeks in a crossover fashion with a 4-week washout. Nutrient intake was determined from two 5-day food records per subject. Values are presented as means±standard deviation (SD). P values indicate differences between interventions within each gender.
When all subjects were analyzed together, blood pressure, serum lipids, and glucose were not different following LFD or CNT. However, WC (108.3±13.0 vs. 107.0±11.8 cm, P=0.006) and BMI (33.0±20.2 vs.32.7±20.0 kg/m2) were lower after consuming LFD compared to CNT foods. These differences in WC and BMI were driven by changes in the women, which after stratification by gender, were significantly lower following LFD versus CNT in women only (Table 5). In men, fasting glucose was lower following LFD compared to CNT (Table 5). There were no changes in LDL-C, PTH, fasting insulin, or in insulin resistance, as calculated by HOMA for either gender (Table 5). Regarding fat mass and trunk fat as measured by DXA, no significant differences were observed between the CNT and LFD periods (21,137±6011 vs. 21,104±6181 grams, 38,519±13,074 vs. 38,552±13,309 grams, for fat and trunk mass, respectively). There were also no changes between the CNT and the dairy period in either total lean (23,667±4953 vs. 22,570±4150 grams) or trunk lean (51,356±10,970 vs. 51,125±1123 grams) for CNT and LFD, respectively, in all tested subjects (n=22).
Anthropometrics, metabolic syndrome parameters, and insulin resistance were measured following 6-week daily consumption of LFD or CNT foods. Values are mean±standard deviation (SD). P values indicate differences between interventions within each gender.
HDL-C, high-density lipoprotein cholesterol; LDL-C, low-density lipoprotein cholesterol; HOMA, homeostasis model assessment; PTH, parathyroid hormone.
When considering changes from baseline for each intervention, there were significant differences for the changes in BW, BMI, and WC in women and a trend toward a change from baseline in fasting glucose for men (Fig. 1). Compared to their respective baselines, women gained 0.4±1.2 kg after the CNT diet; however, they lost 1.1±1.6 kg (P=0.002) following LFD intake.
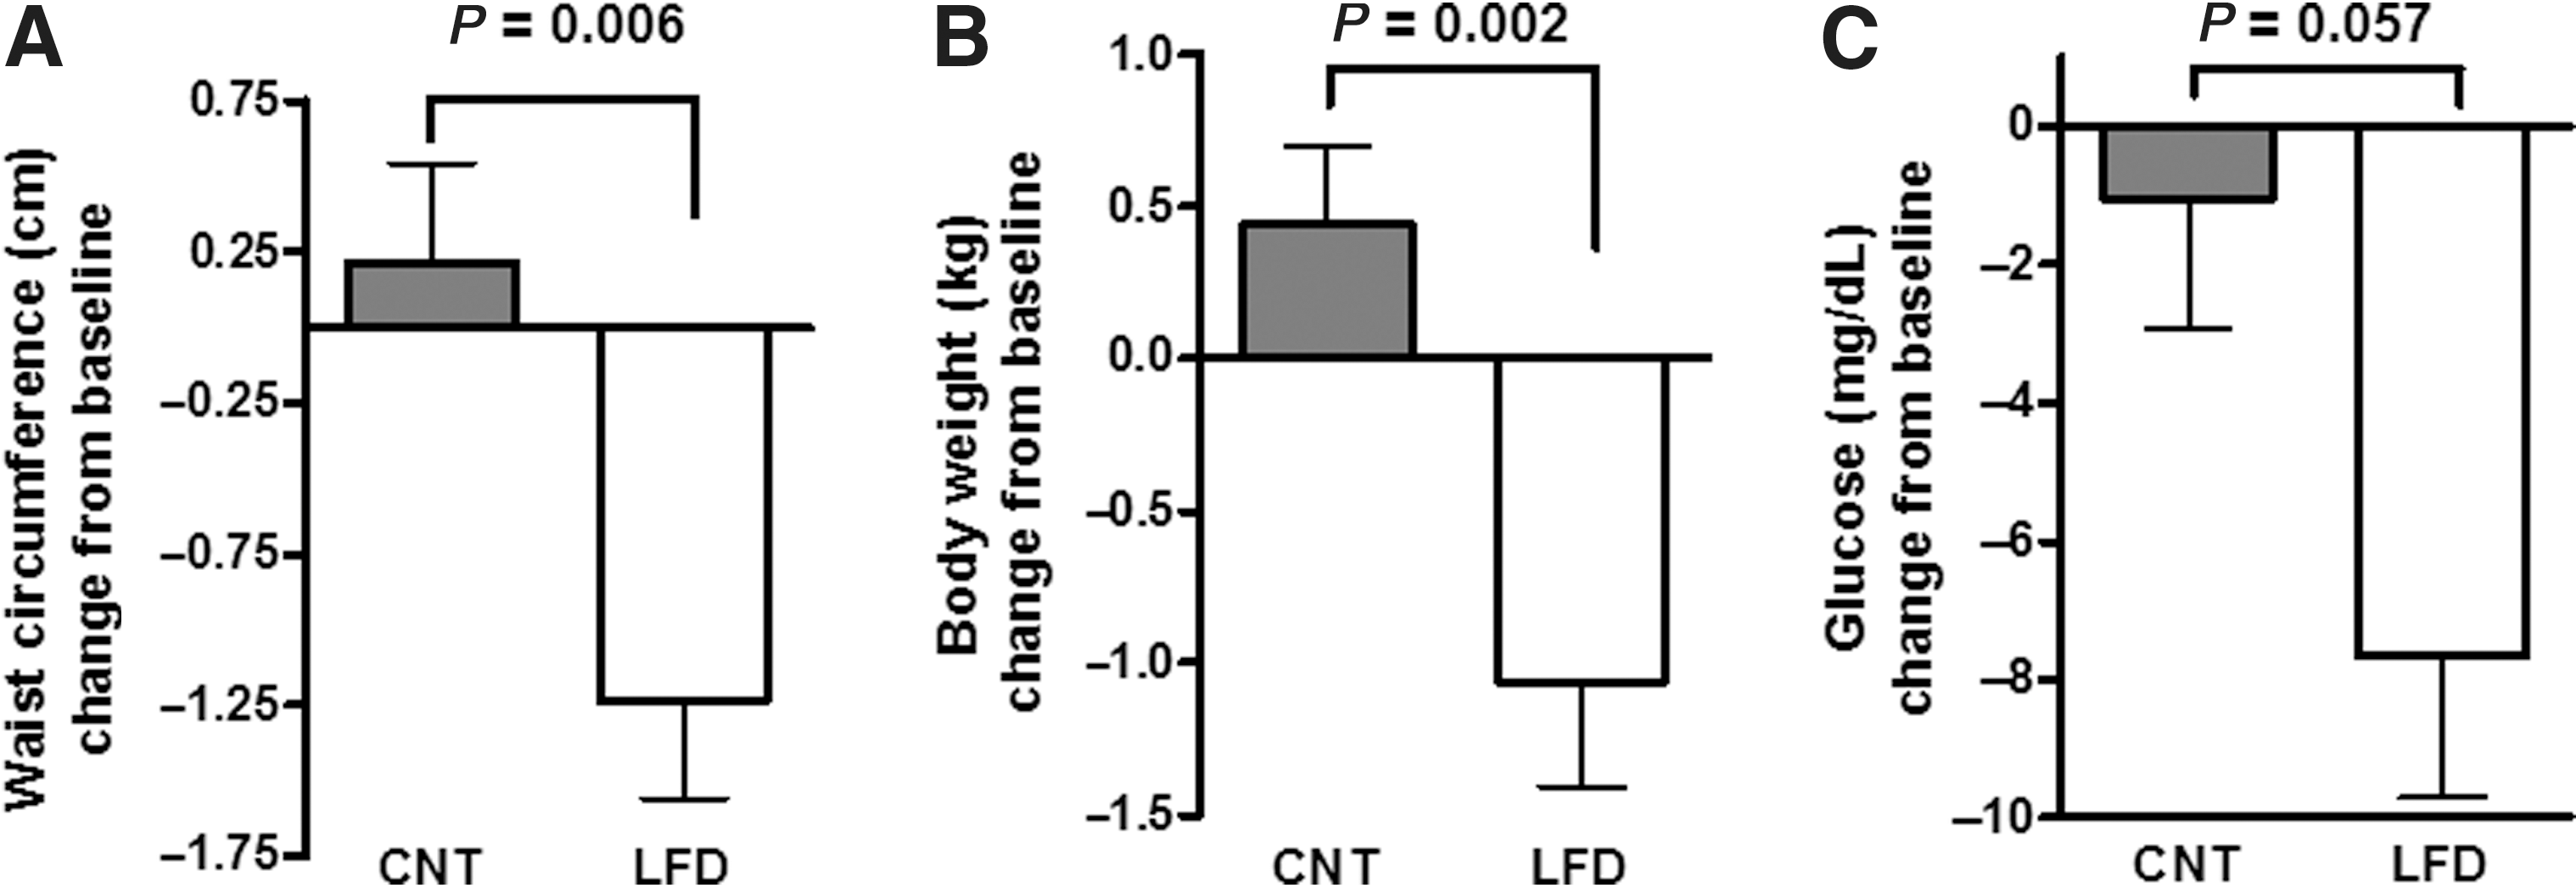
Change from baseline in metabolic syndrome parameters following 6 weeks of low-fat dairy (LFD) or control (CNT) foods. Compared to baseline, waist circumference (WC)
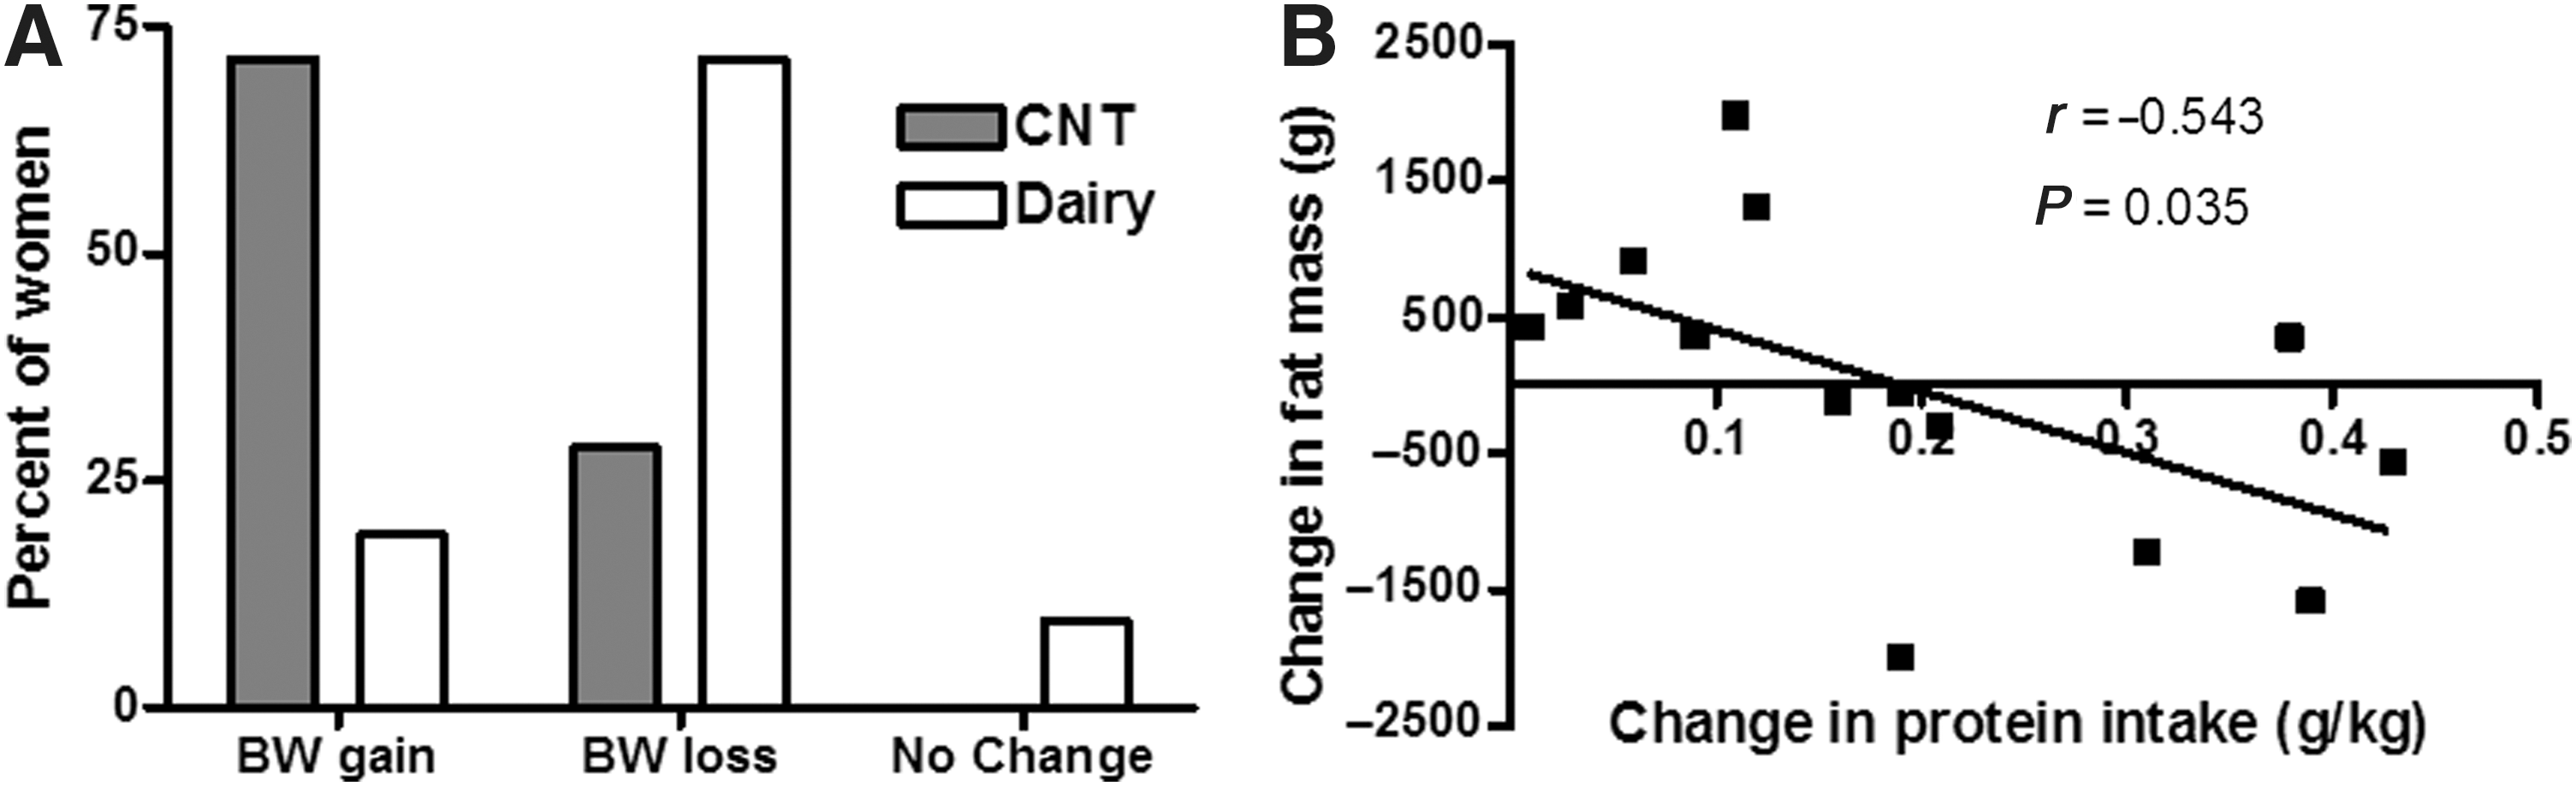
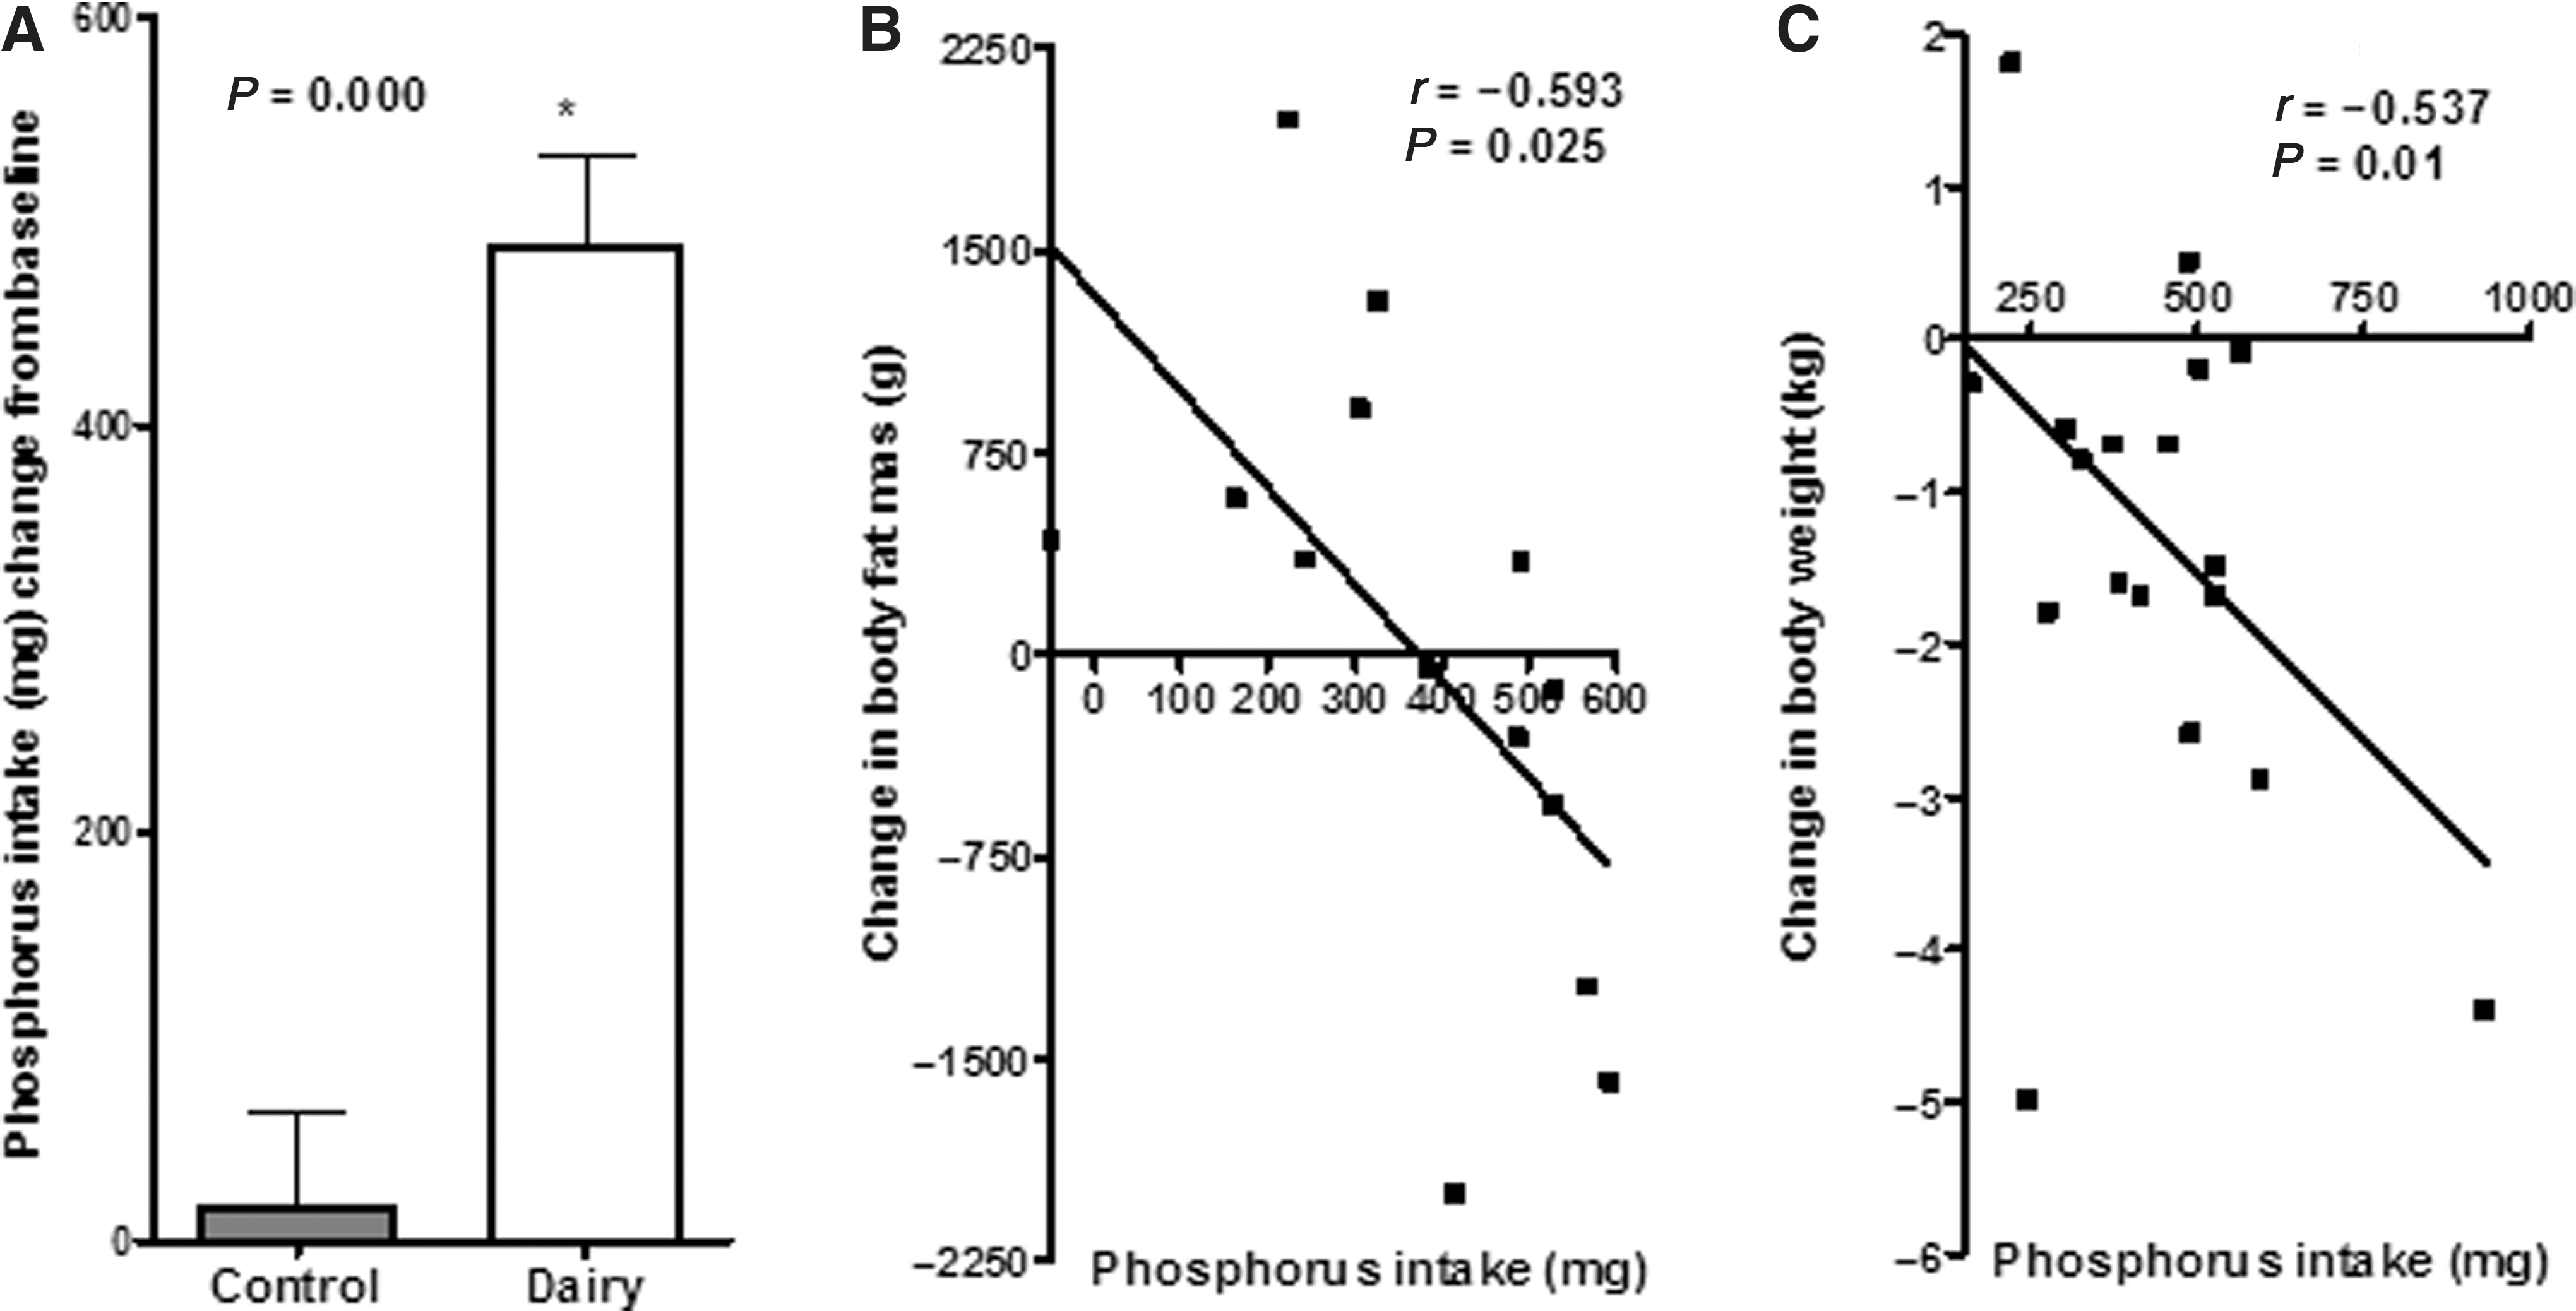
The percentage of women gaining or losing weight according to intervention phase is shown in Fig. 2. In addition, increased protein intake was observed for men and women during the LFD intervention. This increase in protein intake was negatively correlated with changes in fat mass in women (Fig. 2) (r=−0.593, P<0.001). Phosphorus intake was greater during the LFD period (Fig. 3). The reductions in BW and BMI in women were negatively correlated with changes in dietary phosphorus (Fig. 3). In addition, increased leucine intake during LFD was also negatively correlated with changes in BW and BWI (r=−0.460, P=0.036; r=−0.462, P=0.035).
Discussion
In this study, we recruited low dairy consumers who met the definition of metabolic syndrome to determine whether increased dairy consumption would attenuate metabolic syndrome markers compared to energy-matched control foods. The purpose of the study was to evaluate low-fat dairy consumption as a whole and not to separate the different dietary components of dairy that have been proven beneficial for metabolic syndrome. While increased dairy consumption did not change the number of metabolic syndrome markers compared to energy-matched carbohydrate foods, LFD differentially improved some parameters by gender. In men, there was a small but significant decrease in fasting glucose following LFD intake in contrast to glucose levels during CNT, which remained approximately at the metabolic syndrome criterion threshold. Women had lower values for WC, BW, and BMI following LFD as compared to CNT. However, these changes were not detected in fat mass or lean mass as measured by DXA in the subgroup of volunteers. Women experienced a mean reduction of 127 kcal/day while consuming LFD compared to CNT foods and lost on average 1.1 kg of body weight with physical activity levels held constant. Theoretically, the kilocalorie reduction in women during LFD was not sufficient to result in the observed weight loss change. Furthermore, the change in BW was not correlated with the change in energy intake. Thus, a dairy-related mechanism may account for this weight change in women.
Zemel et al. 18 reported an increase in fat oxidation following consumption of three servings of dairy/day. During a weight maintenance study, men consuming >3 servings/day dairy had increased energy intake compared to those consuming <1 serving/day, yet BW did not differ. High dairy intake also reduced serum vitamin D, which supports Zemel's proposed mechanism of dairy's weight modulation effects. By this mechanism, increased vitamin D promotes an increase in adipocyte intracellular calcium levels, which in turn increases adipocyte fatty acid synthase expression and activity and inhibits lipolysis. Thus, lower serum vitamin D would lessen lipid storage. Although this mechanism was recently shown in an animal model, 25 in contrast to Zemel's theory, Van Loan et al. 20 fed 71 low dairy consumers either <1 servings/day or 3–4 servings/day in a controlled metabolic feeding study. Vitamin D levels significantly increased in the high dairy group, but there were no changes in BW or body fat. Although serum vitamin D was not measured in the current study, we found no changes in serum PTH, thus it is unlikely that increased fat oxidation accounts for the weight loss experienced by women during LFD.
In contrast to our results, Crichton et al. 21 compared high dairy to low dairy in a crossover design with 61 adults who were overweight or obese, but otherwise healthy. Total energy intake increased during high dairy consumption and resulted in significantly higher mean changes in BW and BMI, compared to baseline values, but there was no difference in BW, BMI, or WC between the high and low dairy phases. Crichton suggests that the lack of increase in BW despite higher energy intake could be accounted for by the increase in dietary calcium, which can bind to fatty acids and be excreted from the body. Others have shown this calcium effect, 26 and a meta-analysis reported calcium intake of 1200 mg/day increased fecal fat excretion by 5.2 grams/day. 27 However, in the current study, changes in BW, BMI, and WC were not correlated with changes in calcium. Additionally, women experienced no changes in serum lipids, which have been found with intestinal calcium binding of fatty acids. 28 Smilowitz et al. reported correlations between the type of fatty acid and plasma lipids or anthropometrics in an energy-restricted trial, 29 with mono- and polyunsaturated fat having a positive effect on these variables. In this study, we did not find correlations between type of fatty acids and anthropometrics or plasma lipids. The difference between our study and that by Smilowitz et al. 29 can be explained by the type of intervention used in weight maintenance versus energy restriction and the lack of effect of dairy in our study in changing plasma lipids or body composition compared to the control diet.
At study baseline, women were not meeting the recommended dietary allowance (RDA) for protein intake. During CNT, protein intake approached RDA recommendations; however, the increase in protein intake during LFD shifted protein consumption to 0.95 gram/kg BW, above the RDA. Intake of protein above the RDA and specifically increases of leucine have been shown to decrease fat mass and increase resting energy metabolism. Layman et al. 30 have shown that supplementing diets with greater amounts of leucine result in greater fat losses compared to lower leucine and that decreasing the carbohydrate-to-protein ratio improved body composition during weight loss. In our study, changes in leucine intake were positively associated with changes in BW and BMI, whereas changes in protein intake (grams/kg BW) were negatively associated with changes in fat mass.
Another potential mechanism for BW and WC reductions could result from the high phosphorus content provided by dairy products. While high serum phosphate is associated with cardiovascular disease, low serum phosphate has been associated with metabolic syndrome. 31 In a recent cross sectional study (n=47,000), serum phosphate was negatively correlated with all components of metabolic syndrome except for HDL-C, which was positively correlated. 31 Furthermore, as the serum phosphate levels increased, the number of metabolic syndrome components decreased.
Similarly, Kalaitzids et al. 32 found metabolic syndrome patients had lower serum phosphate levels compared to patients who had two or less metabolic syndrome criteria. Serum phosphate decreased linearly as patients increased number of metabolic syndrome markers. In a recent cross-sectional study, 33 subjects whose dietary calcium-to-phosphorus ratio was above the median had 39% reduced odds of central obesity. Calcium and dairy consumption also reduced the odds for central adiposity. 33 A causative role for low phosphate status in the etiology of metabolic syndrome was suggested by Haglin, 34 who states that a diet containing greater carbohydrates relative to protein/phosphorus reduces the serum phosphate level. Because phosphorus is needed to facilitate carbohydrate metabolism, reductions in serum phosphate could contribute to insulin resistance and thus may promote metabolic syndrome. Serum phosphate has been negatively associated with fasting glucose but positively correlated with insulin sensitivity in nondiabetic subjects. 35 While high dietary phosphorus is associated with disruption in PTH, this has been attributed mainly to phosphorus additives 36 and a low calcium-to-phosphorus ratio. 37 In the present study, during LFD intake there was a reduction in percent carbohydrate while percent protein increased. Protein increases were due to higher dairy intake, which concomitantly increased calcium and phosphorus. Although we did not measure serum phosphate levels, serum phosphate generally parallels dietary intake. During the LFD period, the increases in phosphorus (60%) and calcium (135%) resulted in an increase of the calcium-to-phosphorus ratio. Women spontaneously decreased energy intake during LFD; however, the BW and adiposity changes were not associated with changes in energy intake, whereas changes in phosphorus were negatively correlated with changes in BW and fat mass.
On the basis of the correlation coefficient of −0.537, the increase in phosphorus intake could account for ∼29% of the decrease in BW seen in women consuming LFD. Although these changes in weight following LFD were small, they occurred despite an absence of intentional caloric restriction and without increases in physical activity. If the mean weight loss of 1.1 kg was maintained through continued dairy consumption, this could theoretically result in a reduction of 9.5 kg over a year's time, which is approximately 10% of the mean BW for women at study baseline. BW loss of 10% is the current recommend weight loss target during therapeutic lifestyle changes, the first line therapy for metabolic syndrome treatment. Thus, increased dairy consumption in low-dairy consumers could be an important component during lifestyle changes.
Strengths of the current study include that subjects were required to meet the NCEP ATP III criteria of metabolic syndrome for study inclusion and weight maintenance was encouraged. Previous studies have investigated the effect of increased dairy intake on metabolic syndrome in overweight and obese subjects or during weight loss. To our knowledge, this is the first study using a crossover design to investigate increased dairy in a metabolic syndrome population with encouraged weight maintenance. However, the study is limited in that, other than PTH, we did not measure analytes, which would provide insight into possible mechanisms for the observed results. In conclusion, three servings of dairy/day without other dietary or lifestyle changes resulted in improvements in fasting glucose in men and reductions in BW and WC in women. Future studies should be designed to confirm a potential gender effect of dairy consumption and elucidate the mechanisms responsible for these differing effects.
Footnotes
Acknowledgments
This study was funded by the National Dairy Council.
Author Disclosure Statement
No competing financial interest exist for Christine E. Dugan and Jacqueline Barona. Maria Luz Fernandez received funding from the National Dairy Council.