
Abstract
Background:
The metabolic syndrome is a highly prevalent state affecting one in three US adults and comprises a cluster of cardiometabolic risk factors. While metabolic syndrome is a proinflammatory state, there is a paucity of studies examining monocyte/macrophage phenotype in metabolic syndrome subjects. This was the aim of this study.
Methods:
Following informed consent, metabolic syndrome and age- and gender-matched healthy subjects (n=15/group) were recruited, and monocytes were obtained for phenotypic characterization of the classical M1 phenotype and alternative M2 phenotype. Biomarkers of inflammation, C-reactive protein (CRP), and proinflammatory cytokines were examined.
Results:
Metabolic syndrome subjects had significantly higher waist circumference (WC), significantly increased systolic blood pressure, higher fasting glucose, triglycerides, and free fatty acids levels, and lower high-density lipoprotein cholesterol (HDL-C) levels compared to matched controls. Also, CRP and endotoxin levels were significantly elevated in metabolic syndrome compared to controls. Metabolic syndrome subjects had significantly higher levels of the M1 phenotype and significantly decreased levels of the M2 phenotype compared to controls, even after adjusting for WC. Among the other biomarkers of inflammation, there were significant increases in the proinflammatory cytokines and chemokines interleukin-1β (IL-1β), IL-6, and monocyte chemoattractant protein-1 (MCP-1) and decreased IL-10 in metabolic syndrome compared to controls. The M1 phenotype was significantly correlated to levels of CRP, endotoxin, MCP-1, and WC and negatively with HDL-C.
Conclusions:
Monocytes from metabolic syndrome subjects display a proinflammatory M1 phenotype that could promote the increased cardiometabolic burden in these subjects.
Introduction
M
Subjects and Methods
Subjects
Subjects were recruited following informed consent, and this protocol was approved by the Institutional Review Board at Baylor College of Medicine. Subject recruitment was made following posting of flyers throughout the institution. Subjects were classified as having metaboic syndrome using the modified National Cholesterol and Education Program Adult Treatment Panel III (NCEP ATP III) criteria, as described previously. 17 Briefly, subjects classified as having metabolic syndrome had at least three risk factors to sustain the diagnosis, including central obesity, impaired fasting glucose (100–125 mg/dL), hypertension, dyslipidemia [low high-density lipoprotein cholesterol (HDL-C), high triglycerides (TGs)], and/or hypertension or on antihypertensive medications. All healthy controls did not have more than two features of metabolic syndrome. None of the controls had fasting plasma glucose >100 mg/dL or cholesterol and TGs >200 mg/dL. None of the metabolic syndrome subjects had a previous diagnosis of diabetes and were not on any medications for diabetes. None of the subjects took any anti-inflammatory medications or reported any recent infection in the 4 weeks prior to the study. Fasting blood was obtained for CRP, lipid panel, glucose, and insulin, and homeostasis model assessment of insulin resistance (HOMA-IR) was calculated from the fasting glucose and insulin levels, as described previously. 17 Circulating levels of cytokines and chemokines were measured by Millipore Multiplex Cytokine assays on the Luminex 200 platform following manufacturer's instructions, as described previously. 17 Plasma free fatty acid (FFA) levels were assayed as previously described, 5 and endotoxin levels were quantitated using reagents from Lonza (Limulus Amebocyte Lysate, QCL 1000; Walkersville, MD). 5
Phenotypic characterization of classical (M1) and alternatively activated monocytes (M2)
Monocytes were isolated from peripheral blood by Ficoll-Hypaque density gradient centrifugation followed by negative magnetic separation, as described previously. 5 Phenotypic characterization of M1 and M2 cells from subjects was performed using flow cytometry, as described previously. 16 For flow cytometry analysis, cells (5×10⁶ cells) were washed twice, resuspended in 100 μL of 1% bovine serum albumin (BSA) in phosphate-buffered saline (PBS), incubated with respective fluorochrome-labeled antibodies and isotype controls, and then assessed by flow cytometry (BD FACS Canto II). M1 cells were characterized by positivity for CCR2, TNF, and IL-12/23 [phycoerythrin (PE)-conjugated anti-CCR2 monoclonal antibody (mAb), allophycocyanin (APC)-conjugated anti-TNF mAb, and fluorescein isothiocyanate (FITC)-conjugated anti-IL-12/23 Ab] and M2 cells were characterized by positivity for CD206 (mannose receptor), CD163 (scavenger receptor), and IL-10 (PE-conjugated CD163 mAb, APC-conjugated CD206 mAb, and FITC-conjugated IL-10). Mean fluorescence intensity was measured for 10,0000 cells/tube. The percentage of classical versus alternative monocytes was estimated for each of the gated populations, and the M1/M2 ratio was also provided. Fluorescently labeled macrophages were analyzed under the same instrument settings (to eliminate measurement bias), and all data were corrected for background fluorescence intensity obtained with isotype control antibodies.
Statistical analysis
All statistical analyses were done using Minitab 16 statistical software (February, 2012, State College, PA). Differences between groups were analyzed by two-sided paired t-tests (for parametric data) or Wilcoxon tests (for nonparametric data) and were considered significant if P<0.05. Pearson or Spearman correlation (for nonparametric variables) was computed between variables of interest.
Results
Table 1 depicts the salient baseline characteristics of controls and metabolic syndrome subjects. Although the metabolic syndrome subjects and controls did not differ in age or gender distribution, as reported previously, metabolic syndrome subjects had significantly higher waist circumference (WC) values and significantly increased systolic blood pressure, higher fasting glucose, TGs, and FFAs, and had lower HDL-C levels compared to matched controls. Also, CRP and endotoxin levels were significantly elevated in metabolic syndrome compared to controls (Table 1).
Data are provided as mean±standard deviation (SD).
P<0.05 compared to conotrols and * P<0.001 compared to metabolic syndrome.
SBP, systolic blood pressure; DBP, diastolic blood pressure; HOMA, homeostasis model assessment; HDL-C, high-density lipoprotein cholesterol; CRP, C-reactive protein.
We then examined the macrophage phenotype in metabolic syndrome subjects compared to controls. Metabolic syndrome subjects had significantly higher levels of the M1 phenotype and significantly decreased levels of the M2 phenotype compared to controls (Fig. 1). The M1/M2 ratio for controls was 0.73 and that of metabolic syndrome was 1.62 (P<0.01). These differences remained statistically significant even after adjusting for WC. Furthermore, when we examined circulating biomarkers of inflammation in metabolic syndrome subjects, there were significant increases in the proinflammatory cytokines and chemokines IL-1β, IL-6, and MCP-1 and significantly decreased IL-10 in metabolic syndrome subjects compared to controls (Fig. 2). TNF and IL-8, although trending to be higher in metabolic syndrome subjects, were not significantly different compared to controls.
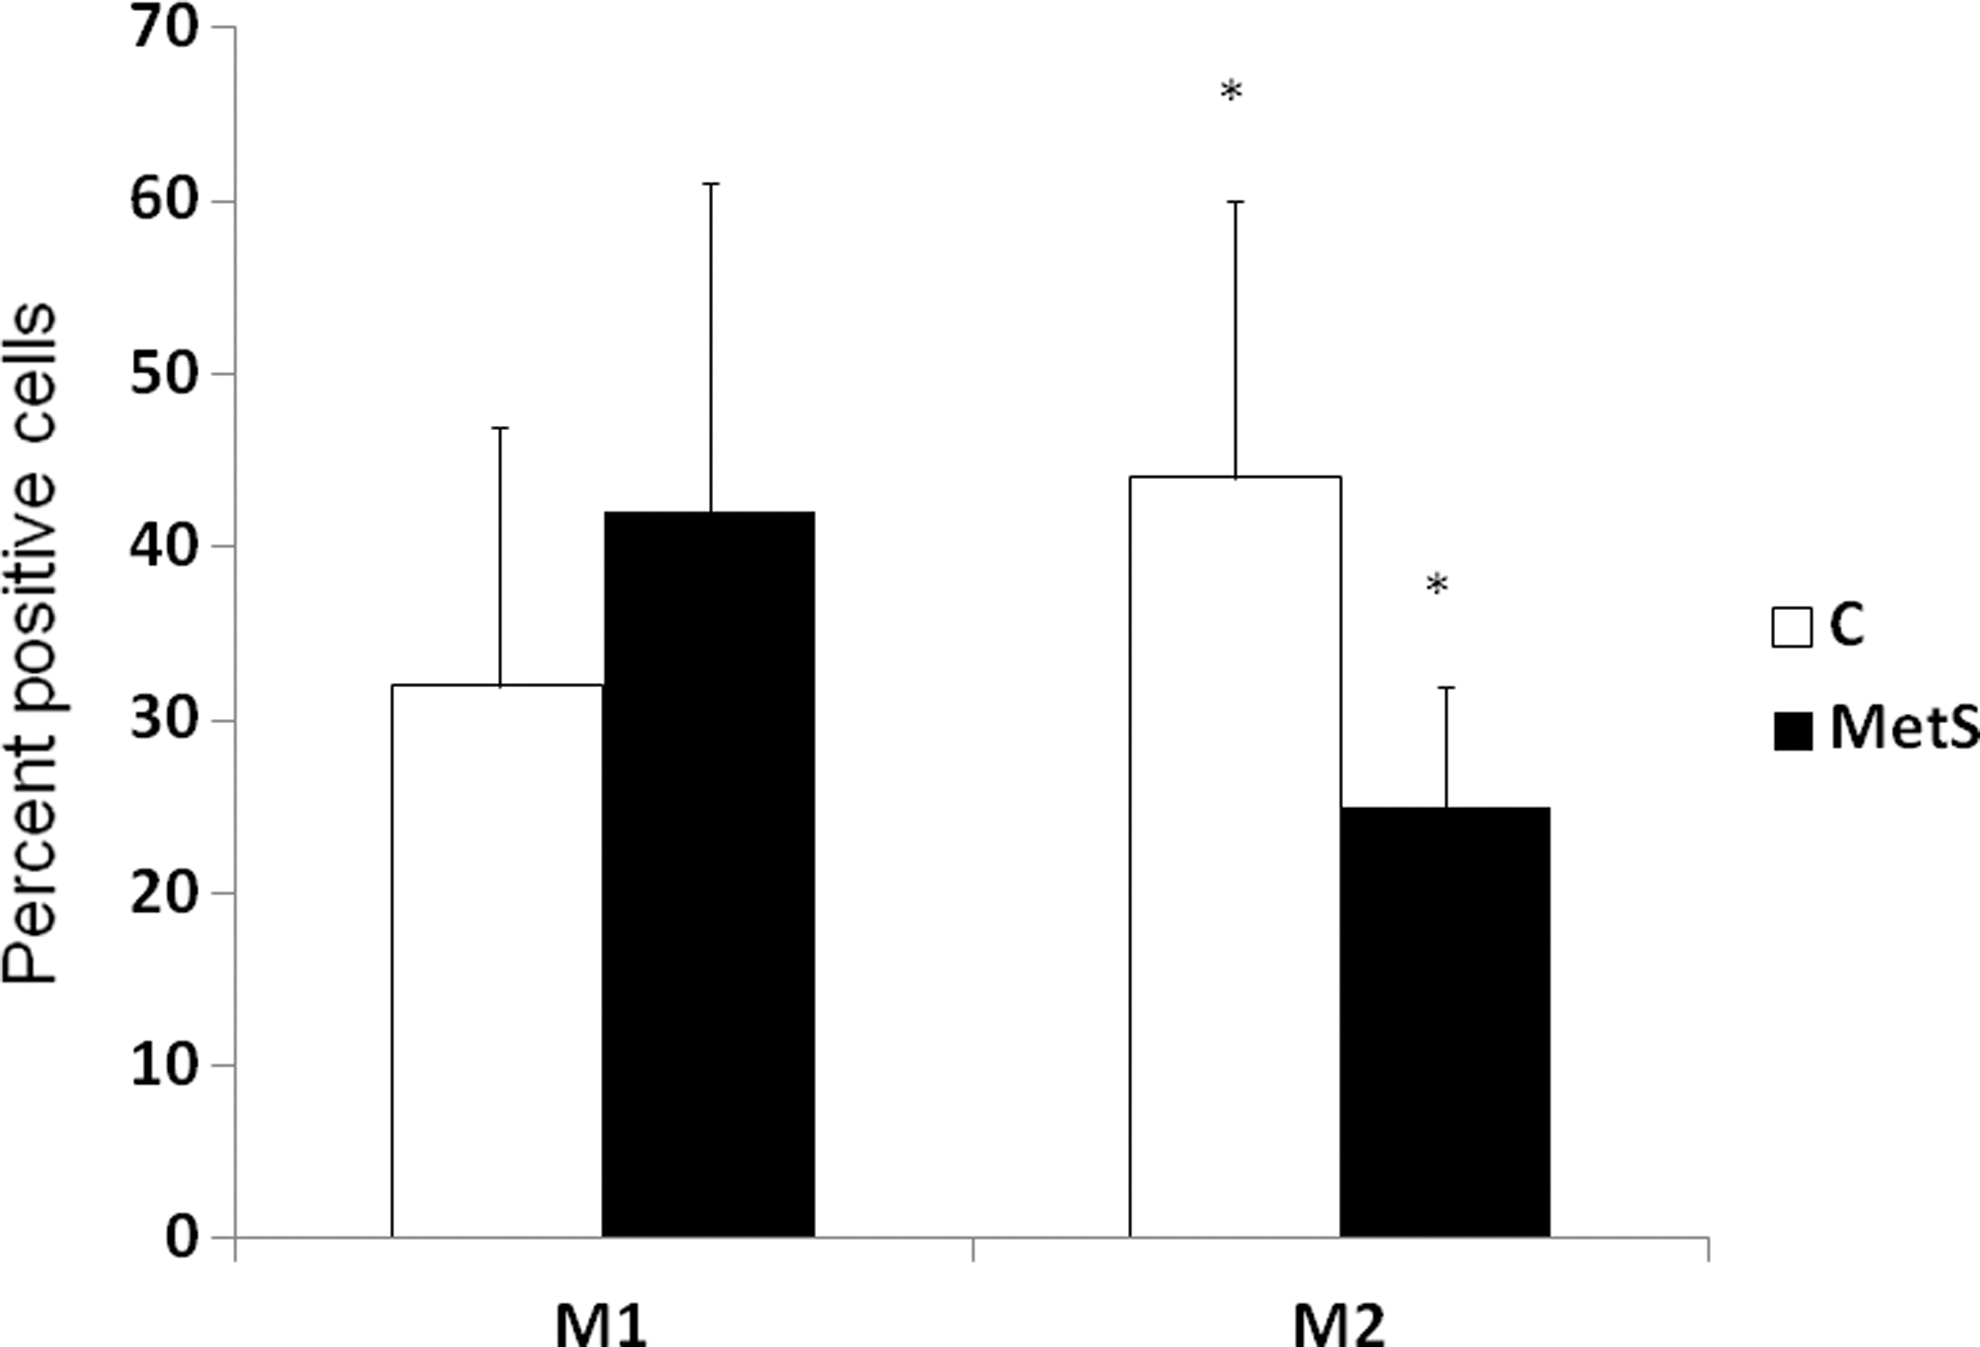
Expression of M1 and M2 phenotype markers in controls (C) and metabolic syndrome (MetS) subjects. Phenotypic characterization of M1 [CCR2, tumor necrosis factor (TNF), interleukin-12/23 (IL-12/23) high positive] and M2 cells (CD206, CD163, IL-10) was performed, as described in Subjects and Methods, in controls and metabolic syndrome subjects (n=15/group). Mean fluorescence intensity of the M1 populations and M2 populations, respectively, were measured and expressed as percentage of M1 and M2 cells; *P<0.01 compared to controls.
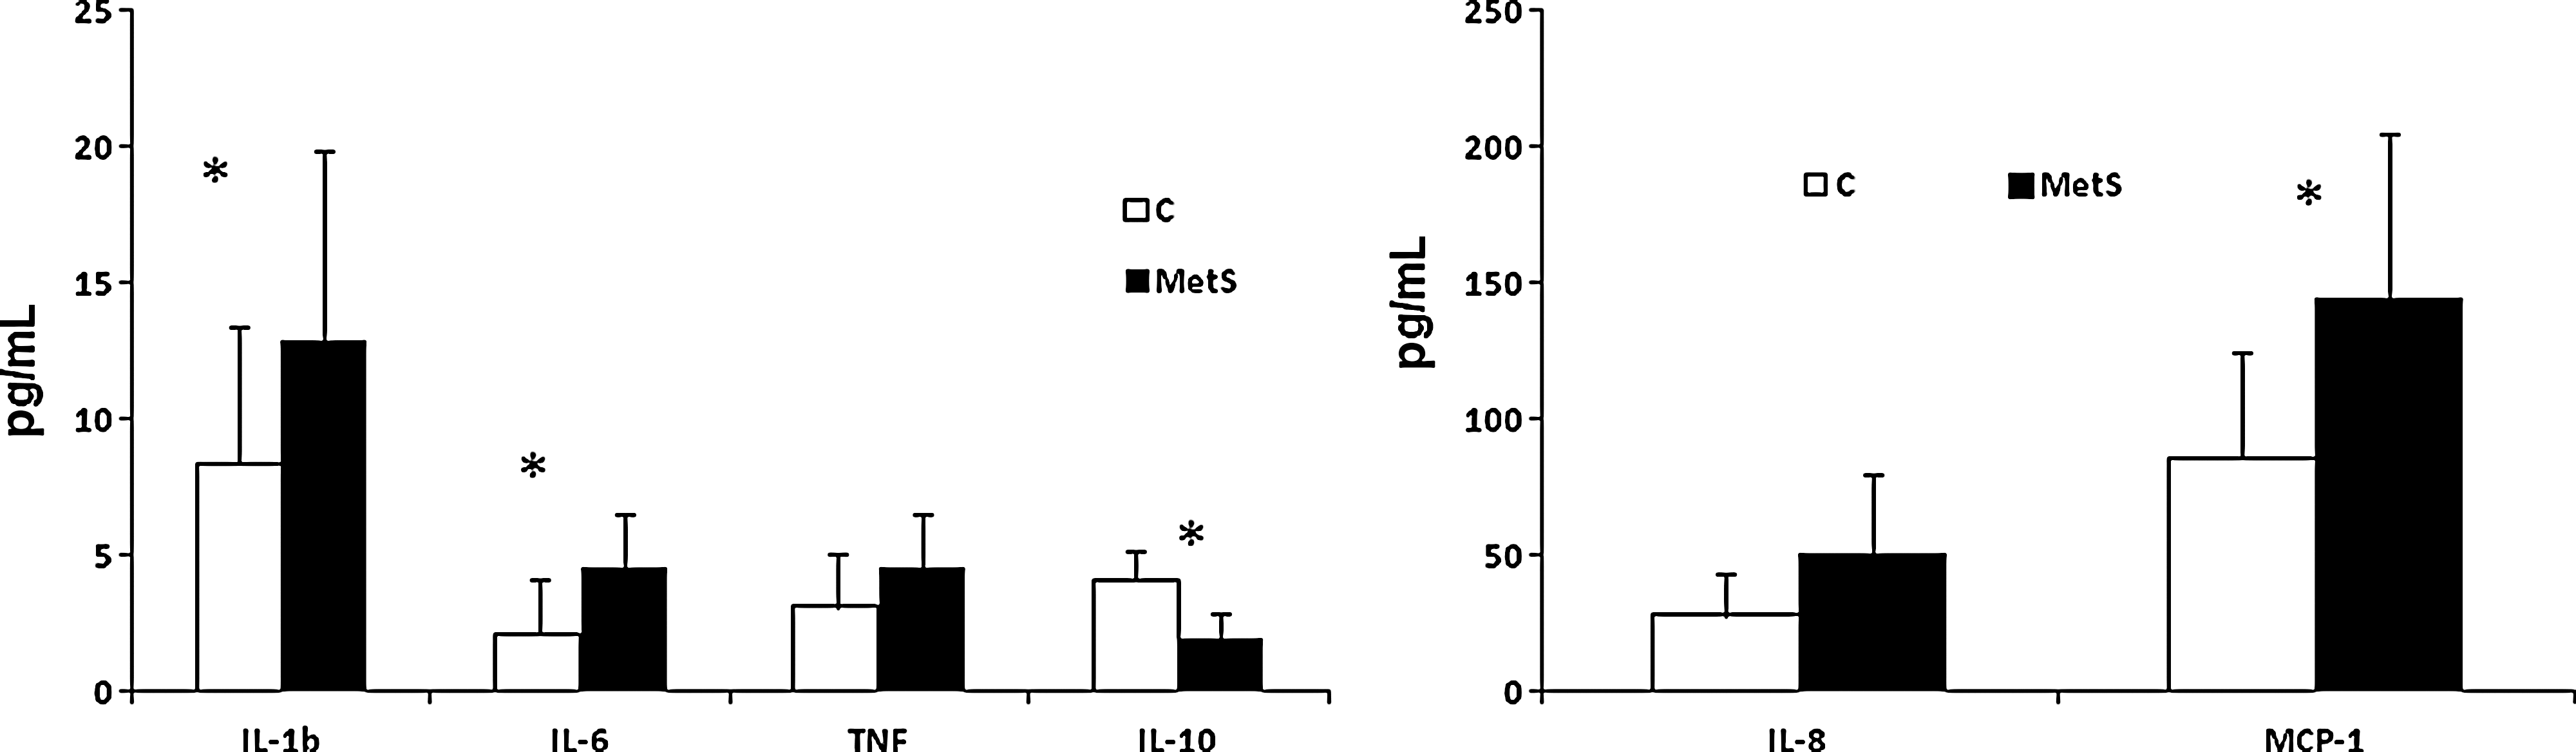
Proinflammatory cytokines/chemokines in controls (C) and metabolic syndrome (MetS) subjects. Proinflammatory cytokines/chemokines in plasma obtained from controls and metabolic syndrome subjects (n=15/group) were characterized, as described in Subjects and Methods, by multiplex assays and expressed as pg/mL. Data are provided as mean±standard deviation (SD) due to normal distribution; *P<0.05 compared to controls. IL-1b, interleukin-1β; TNF, tumor necrosis factor; MCP-1, monocyte chemoattractant protein-1.
There were significant correlations between the M1 phenotype and levels of CRP, endotoxin as well as levels of MCP-1 (M1 phenotype and CRP, r=0.46, P=0.014; M1 phenotype and endotoxin, r=0.48, P=0.044) and M1 phenotype and MCP-1 (r=0.46, P=0.016). Among the features of the metabolic syndrome, the only significant correlations were between the M1 phenotype and HDL-C and the M1 phenotype and WC (r=−0.56, P=0.003 and r=0.53, P=0.03). The M1 phenotype was not significantly correlated with the other features of metabolic syndrome, such as glucose, TGs, or hypertension or with FFAs.
Discussion
Metabolic syndrome is a constellation of risk factors, with insulin resistance as a major underlying risk factor, and predisposes individuals to increased risk of diabetes and cardiovascular disease. 1 –3 Metabolic syndrome is also a proinflammatory state. 4,5 Also, it has been shown that the adipose tissue in metaboic syndrome subjects is an active endocrine organ and that macrophage infiltration within the adipose tissue results in crosstalk and release of various biomediators that promote inflammation. 12 In addition, the macrophages in adipose tissue of metaboic syndrome subjects appears to be predominantly of the M1 phenotype. 17,18 In this study, we report increased proinflammatory or M1 phenotype of macrophages in the circulation of metabolic syndrome subjects compared to controls.
As we have shown, many others have reported increased CRP and proinflammatory cytokines contributing to systemic inflammation in metabolic syndrome subjects. 4,5,17 In addition to increased M1 phenotype levels in metabolic syndrome subjects, there is also a significantly decreased alternative M2 phenotype, as characterized by the IL-10, CD163, and CD206 markers. Also, Esposito et al. 19 have reported decreased IL-10 levels in obese women with metabolic syndrome, as seen in our study. We were unable to look at gender differences in the parameters studied due to the small sample size. One of the first studies of monocytes in obesity is the work of Ghanim et al., 20 who demonstrated that mononuclear cells isolated from obese subjects are at a proinflammatory state. We go further in studying monocytes in metabolic syndrome and reporting increased M1 phenotype and decreased M2 phenotype in these subjects compared to matched controls. This observation, coupled with the previous observation of increased M1 macrophages in adipose tissue of metabolic syndrome subjects supports the notion that monocytes could be the prime cause for the observed adipose tissue dysregulation in metabolic syndrome. Furthermore, a recent study has shown that peripheral blood mononuclear cells (PBMCs) from obese subjects have an altered expression of M2 markers and are less susceptible to differentiation toward an alternative phenotype. 21 In our study, even after adjustment for WC, there were increased M1 monocytes in metabolic syndrome subjects compared to controls, suggesting the role of other factors in this process.
Fadini et al. have published two papers recently in this area. 22,23 In type 2 diabetes mellitus (T2DM) subjects, these investigators have shown that M1 and M2 phenotypes characterized by the expression of CD14 and CD16 were dysregulated, with decreased M2 monocytes in the peripheral blood in the T2DM population; this correlated with the bone marrow aspirate. 22 Furthermore, they also found that in prediabetic individuals characterized by impaired glucose tolerance compared to those with normal glucose tolerance, there was a significantly increased percentage of M1 cells compared to M2 cells that correlated with glycated hemoglobin (HbA1c). In our study, although there were no significant correlations with fasting glucose, we did not measure HbA1C levels in our metabolic syndrome cohort (as defined by modified NCEP criteria) and only saw significant correlations with HDL-C, WC, and markers of inflammation, such as MCP-1 and CRP.
Our correlation studies reveal that the M1 phenotype correlates with the prototypic marker of inflammation, CRP. Previously, Devaraj and Jialal 16 showed that CRP induces a proinflammatory M1 phenotype. Also, MCP-1 levels appear to correlate well to a M1 phenotype. Thus, it is likely that the underlying inflammation in metabolic syndrome drives monocytes toward an M1 phenotype and promotes chemotaxis and infiltration of these macrophages into the adipose tissue. Furthermore, the M1 phenotype is associated with central obesity and HDL-C; even after adjusting for central adiposity, the M1 phenotype numbers are significantly increased compared to those of matched controls.
Thus, in this small study, we have demonstrated that increased M1 macrophage phenotype levels in metabolic syndrome subjects correlate with inflammation and central obesity. Such macrophages may accentuate the inflammatory burden in these subjects. Further studies in larger cohorts will be performed, and we will examine mechanisms by which this M1/M2 ratio can be altered and attenuate the increased cardiometabolic burden in these subjects.
Footnotes
Acknowledgments
We thank Alka Redkar and Hanna Uhrova for flow cytometry, German Vargas for technical assistance, and the Ching Ou Endowment in Clinical Chemistry.
Author Disclosure Statement
No conflicting financial interests exist.