
Abstract
Introduction:
Type 2 diabetes presents with numerous macrovascular and microvascular impairments, which in turn lead to various co-morbidities. Vascular co-morbidities can be seen when examining arterial stiffness (AS), which is a predictor for endothelial health and cardiovascular disease risk. Pulse wave analysis (PWA) and pulse wave velocity (PWV) are two tests that are commonly used to measure AS. Currently, disease states and progression are tracked via blood biochemistry. These gold standards in monitoring diabetes are expensive and need optimization.
Research Question:
To investigate which biophysical and biochemical parameters correlated best with AS, which may reduce the number of biochemical tests and biophysical parameter measurements needed to track disease progression.
Methods:
Data from 42 subjects with type 2 diabetes mellitus for ≤10 years, aged 40–70 years, were analyzed at a single time point. We investigated various blood biochemistry, body composition, and AS parameters.
Results:
A combination of fat mass and fat-free mass was most associated with PWA over any other parameters. Leptin and high-sensitivity C-reactive protein seem to be the next two parameters that correlate with augmentation index. No other parameters had strong correlations to either PWA or PWV values.
Conclusions:
Body composition methods seemed to be better predictors of type 2 diabetes mellitus patient's vascular disease progression. Our study indicates that body composition measurements may help replace expensive tests. This may have public health and health surveillance implications in countries facing financial challenges.
Background
T
Vascular co-morbidities can be seen when examining the arterial system, however, structural degeneration to this system is also a naturally occurring process as we age. 3 –5 With time, the endothelium becomes damaged, elastin degenerates, and vessel walls thicken due to increased collagen deposition. 4,5 This process is accelerated with onset of vascular complications.
Many of these changes are represented as arterial stiffness (AS). AS is a measure used to determine vascular well-being. It is an established predictor of endothelial health and cardiovascular disease risk. 6 –8 An increase in AS manifests physiologically as an increased velocity of the blood pressure wave and eventually results in the complication of an increased cardiac afterload. 3,6 An increased cardiac afterload places more pressure on the left ventricle, which can ultimately lead to cardiac complications, including hypertension, pulmonary congestion, and heart failure.
Pulse wave analysis (PWA), and pulse wave velocity (PWV) are two tests that are commonly used to measure AS. 9 These measurements provide many values, including augmentation index-75 (AI-75), augmentation pressure (AP), and carotid–femoral PWVs (C-F PWVs). A higher value for each of these measures, compared to health controls, indicates a higher level of AS. Of these three, specifically C-F PWV is a validated marker of the AS over the central arteries. It has, therefore, been established as an important predictor of future cardiovascular risk. 7,10
One implicated cause of accelerated arterial stiffening is chronic hyperglycemia, a common state in diabetes. 7 The presence of AS in diabetes has been shown to be associated with endothelial dysfunction 5,8 as well as vascular smooth muscle cell dysfunction, and systemic and vascular inflammation, over a background of genetic predisposition. 5,8
The diagnostic criteria for diabetes are selected on the basis of plasma glucose levels at which microvascular complications such as diabetic retinopathy occur; however, the risk of macrovascular disease with affection of the cardiovascular system and neurological system starts increasing well before this diagnostic point. For this reason, early determination of a patient's vascular health is an important step in preventing disease progression. Diabetes has been established as a cardiovascular disease equivalent based on epidemiological studies such as Framingham multigenerational cohort data 10 ; however, studies based on AS and cell-based endothelial dysfunction in early stages of diabetes are lacking 11,12
Although serum biochemistry is a gold standard in monitoring diabetes, some of these measurements are expensive and need optimization. Considering that the goal of diabetes treatment is prevention of progressive vascular disease and AS, we decided to investigate which biophysical and biochemical parameters correlated best with AS, which may help us reduce the number of expensive biochemical tests and biophysical parameter measurements needed to track disease progression.
To investigate this question, we used a population of early type 2 diabetes, with no established cardiovascular disease and no more advanced CKD than stage 2 calculated by the Cockcroft–Gault formula. No study subject had established retinopathy or neuropathy and no subject was on any other diabetic medication other than metformin. Some of the subjects are hypertensive and controlled adequately with antihypertensive medications.
Methods
AS is commonly measured by two tests: PWV and PWA. The latter primarily involves looking at augmentation index-75 (AI-75) and AP.
Serum biochemistry is used to track the progression of diabetes and CKD stage. Worsening of CKD is a common complication of type 2 diabetes, and so we wished to examine the subjects in two groups, one group with CKD (estimated glomerular filtration rate [eGFR] <90) and the other one without.
Study population
Data from 42 subjects with diabetes mellitus ≤10 years, age 40–70 years, and a body mass index (BMI) of 25–39.9 were analyzed. All participants were required to be on a stable dose of metformin for at least 3 months, but still remain adequately controlled with an HbA1c of 6.0%–9.0% (both values inclusive). Pregnant women were excluded from the study.
Subject population characteristics
There were 42 subjects with ages 41–69 years (average 57 years). Average BMI = 31.89, mean duration of diabetes was 3.98 years with average HbA1c of 6.81. Gender and ethnic diversity in our population was 24 males and 18 females with racial mix as detailed here: Caucasians (11), Asians (2), Hispanics (1), African American (26), and Africans (2).
Data collection
After fasting for a minimum of 8 hrs, study subjects had blood pressure, laboratory data, AS data, and anthropometric measures collected by trained study personnel.
Peripheral blood draws were performed to obtain the following measures: high-sensitivity C-reactive protein (hs-CRP), IL6, TNF-α, leptin, adiponectin, fasting insulin, fasting glucose, and low-density lipoprotein (LDL) and non-high-density lipoprotein (non-HDL) cholesterol.
A Tanita Body Composition Analyzer scale was used to assess total fat mass, fat-free mass (FFM), % fat, and % body water.
Assessment of vascular function was determined through measures of carotid–femoral PWV (C-F PWV) and PWA, which included augmentation index (AI) and AP. A single trained operator took PWA measurements. A hand-held tonometer attached to the SphygmoCor system was applied to the skin surface at the radial artery as per SphygmoCor instructions. SphygmoCor software linked to a computer was then used to digitize the radial artery waveforms acquired. To maintain quality control, only measurements with a quality index of ≥90% were accepted. AI is influenced by heart rate; thus, values were adjusted to a 75 beats per minute standard.
Data analysis
Variable distributions were examined for outliers and non-normality using histograms, and were natural log transformed or coded into quartiles if necessary. Pearson r was examined between all variables, including glucose, BMI, fat mass (lbs), FFM, insulin, eGFR, IL6, LDL, non-HDL cholesterol, hs-CRP, TNF-α, leptin, and adiponectin. Those that had a correlation with AS measures with P < 0.10 were included in a linear regression model.
A separate model was used for two indicators of AS (PWV and augmentation index-HR75). This used backward elimination with P < 0.20 required to remain in the model. The final model was used to calculate a risk score for AS using a linear equation of the form:
where n is the number of predictor variables in the final regression model, b is the model parameter estimate (beta) for each variable, and v is each subject's score for that variable. A scatterplot of the risk score by the AS score was used to visualize the correlation. Sensitivity, specificity, positive and negative predictive values, and total prediction accuracy were assessed using a median split for both the calculated AS score and the observed AS score. We tested whether the calculated AS score worked equally well as a predictor of observed AS in patients with versus without CKD, using a linear model that included the calculated AS score, eGFR, and the AS score × eGFR interaction. A significant interaction would indicate that the association of the AS score with observed AS varied based on whether or not the patient had CKD.
Results
Several predictor variables were not normally distributed and were natural log transformed. These included IL6, LDL, non-HDL-cholesterol, CRP, TNF-α, leptin, and adiponectin. Insulin was converted into quartiles because of outliers. Pearson correlations between the predictors and the measures of AS are shown in Table 1. Predictors that had significant univariate associations with augmentation index-HR75 included fat mass (r = 0.40), FFM (r = −0.59), CRP (r = 0.36), and leptin (r = 0.45). Predictors with trend-level associations included eGFR (r = 0.30), LDL (r = 0.28), and non-HDL cholesterol (r = 0.29). There was no predictor significantly associated with PWV, and BMI had the strongest association (r = 0.27). Thus, no regression model was created to try to predict PWV.
Some variables had missing data, and thus, the sample size varied across correlations.
Bold figures are statistically significant.
BMI, body mass index; CRP, C-reactive protein; eGFR, estimated glomerular filtraton rate; FFM, fat-free mass; HDL, high-density lipoprotein; LDL, low-density lipoprotein; PWV, pulse wave velocity.
The final regression model predicting augmentation index-HR75 had R
2
= 0.50, indicating that a large proportion of the variance in this measure of AS was explained by the model. The simplified equation to calculate each subject's level of AS was as follows:
The Pearson r between this calculated AS score and the observed augmentation index-HR75 was 0.71 (P < 0.0001), indicating very strong association (Fig. 1). When both the calculated AS score and the observed augmentation index-HR75 were split at the median, we found sensitivity, specificity, positive and negative predictive values for the calculated AS score predicting the observed score were all = 0.76, and total prediction accuracy was also 0.76. In the model using the calculated AS score, eGFR, and the AS score × eGFR interaction, we found that the interaction was not significant (P = 0.99), indicating that the calculated AS score worked equally well in patients with and without any stages of CKD.
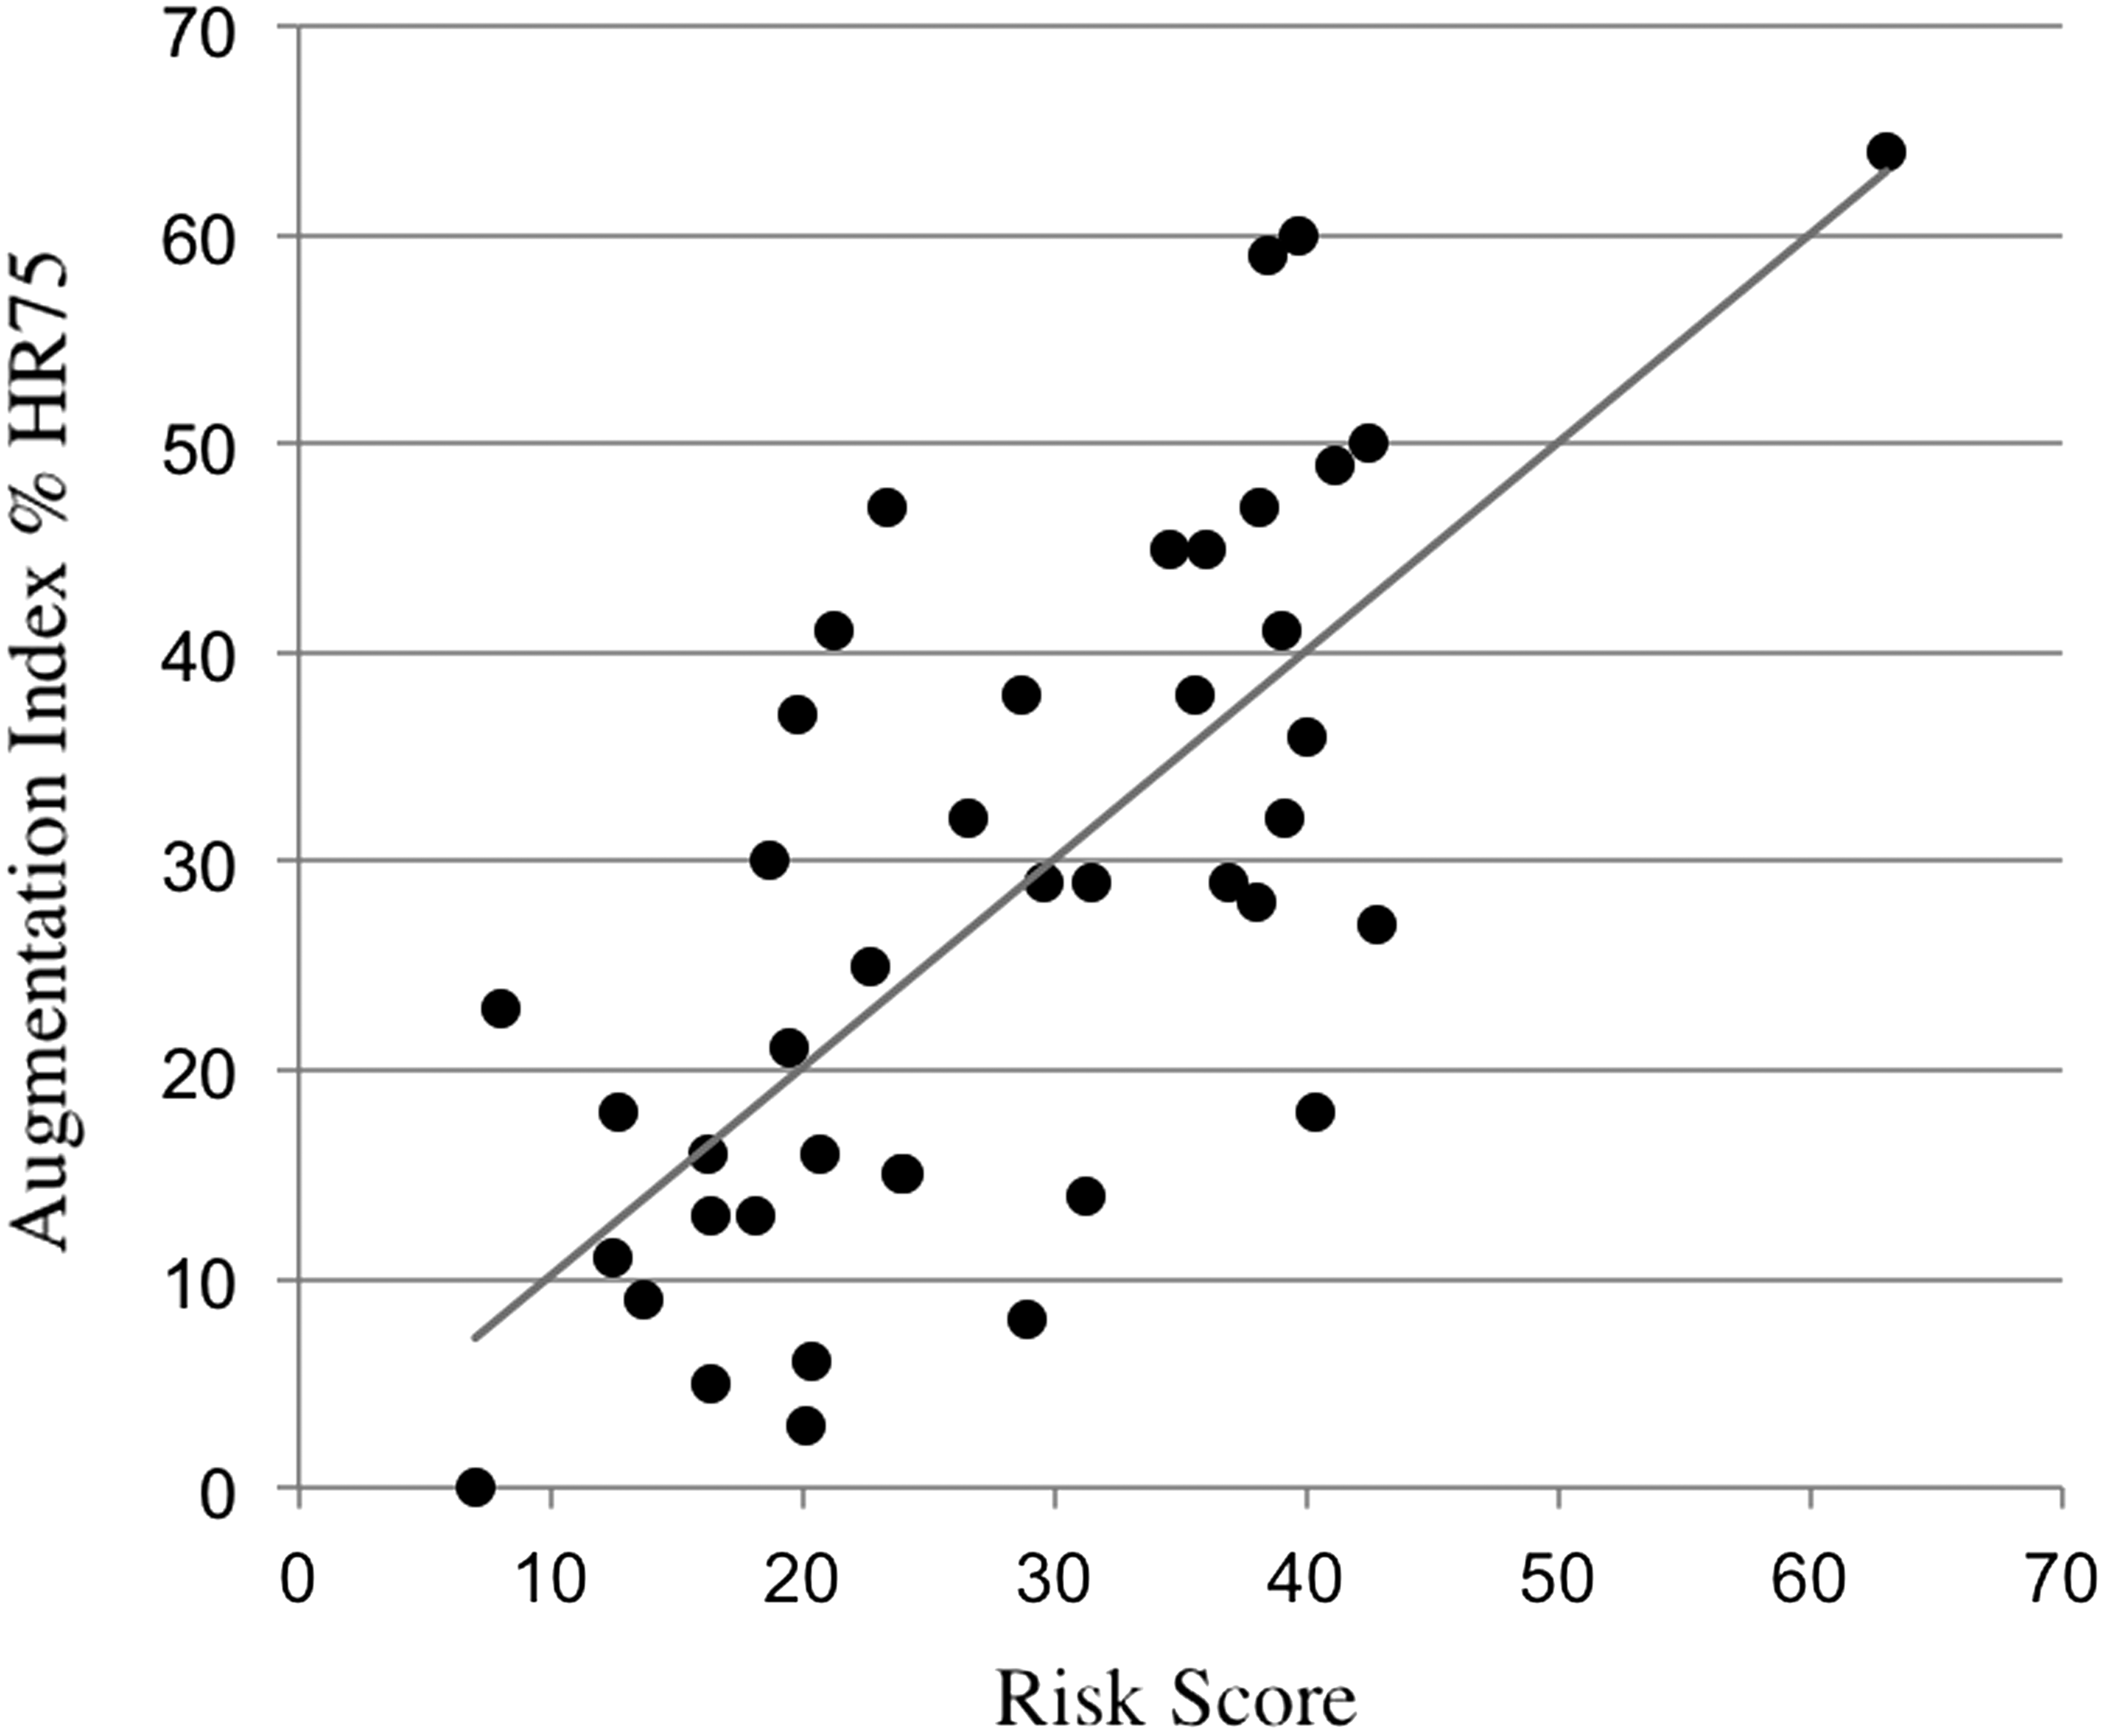
Scatterplot of risk scores calculated from the linear regression model for augmentation index. The Pearson r between the risk score and the augmentation index % 75 score was 0.71 (P < 0.0001).
Interpretation
Based on our results (Table 1), we conclude that a combination of fat mass, which is positively correlated and fat-free mass, which is negatively correlated, is most accurately associated with PWA (augmentation index [AI]).
Leptin and hs-CRP seem to be next two parameters that correlate positively with AI. Unlike leptin, there is no correlation of adiponectin with AI. Both IL6 and TNF-α seem to be less correlated with AI than hs-CRP, with TNF-α having the least correlation. PWV though showed similar trends to AI, but did not demonstrate strong statistical correlation. This could be due to the fact that measurements of PWV involve flow measurement at two sites such as carotid and femoral and not all subjects agreed to two measurements, and as a result, there were few PWV data missing. Interestingly, LDL values do not seem to be correlated with either parameter of AS.
Discussion
Our study indicates that biophysical parameters are more indicative of AS than biochemistry, which has a significant cost implication, where biochemical analysis is often expensive. Inflammation, measured by inflammatory makers such as hs-CRP, appears to play a role in predicting, if not contributing to, AS progression. The adipocyte hormone leptin, rather than adiponectin, is correlated to AS in early type 2 diabetes subjects more so than glucose, insulin, and LDL (the most commonly studied parameters of AS). 2 This result supports our finding that fat mass is the best outcome measure of AS, and it is well known that leptin directly correlates with fat mass. 13 Therefore, one would predict a positive correlation with leptin, as was found in our study. It appears that an increased fat mass is correlated with a high hs-CRP, in other words, obesity along with increased endothelium-specific inflammation has the highest correlation with AS in type 2 diabetes, even in subjects without any obvious vascular complication.
Given the monetary cost of the biochemical tests, it was interesting to note that clinically measured fat mass compounded with FFM seems to be the parameter, over any serum biochemistry value, with the strongest correlation with AS of a type 2 diabetes population. We used an impedance scale (Tanita Scale) rather than the “gold-standard” 14 body composition DEXA scanner, as the Tanita scale can be easily used in a clinical setting. The Tanita scale is much less expensive than a DEXA scanner and is easily portable.
Limitations
Although PWV is considered a gold standard for measuring AS, based on previous studies that have used AI as a measure of AS and the user manual provided by the manufacturers of the SphygmoCor, we believe that AS may also be assessed by other noninvasive methods such as PWA. The choice of radial tonometry using PWA over PWV was a reasonable decision based on previous studies that highlighted challenges in measurements at the carotid and femoral arteries. 15 PWA has been used as a measure of AI as opposed to PWV in patients with abdominal obesity due to difficulties in distance measurements and the difficulty of femoral pulse acquisition, 16 and PWA assessments have been shown to be reliable and reproducible. 17,18
The study sample size is small; however, significant correlations with AS emerged nonetheless. Similar to other diagnostic methods such as ultrasound, PWV measurements using AtCor Medical SphygmoCor® system (pulse wave tonometer) are operator dependent. This may account for the lack of correlation between biophysical and biochemical parameters and PWV that we came across. To minimize interoperator variability, study personnel were trained before commencement of the study on how to operate the tonometer and to obtain readings within the 90th percentile. Also, as mentioned above, for each reading, the best of three readings was used for analysis. However, observer-based differences in our study were minimal for AS measures as opposed to other endothelial dysfunction studies such as ultrasound-based flow-mediated dilatation. 19
Our study indicates that body composition measurements may help to replace expensive biochemical tests in monitoring vascular disease in type 2 diabetes patients. While these results would need to be verified using body composition measuring parameters in an identical cohort, this finding may have public health and health surveillance implications in countries facing the financial challenges of managing diabetes and its complications.
Footnotes
Author Disclosure Statement
No conflicting financial interests exist.