
Abstract
Background:
The prevalence of metabolic syndrome (MetS) has increased dramatically in low- and middle-income countries. Proprotein convertase subtilisin/kexin type 9 (PCSK9) plays a major role in low-density lipoprotein receptor degradation, but its relationship with metabolic parameters is still poorly understood. We aimed to investigate the association between plasma PCSK9 and metabolic parameters in a Kenyan cohort.
Methods:
Total plasma PCSK9 levels were measured in 2016 by an in-house enzyme-linked immunosorbent assay (ELISA) using a polyclonal antibody. The International Diabetes Federation (IDF) 2009 consensus statement criteria were used to assess the presence of MetS.
Results:
In 1338 Kenyans, 11% of the cohort had ≥3 MetS criteria. Total plasma PCSK9 concentration was significantly higher in subjects with MetS than in the non-MetS group (166.8 ± 4.4 vs. 148.0 ± 1.3, P < 0.0001). A progressive increase in circulating PCSK9 was observed when subjects were stratified according to the number of MetS criteria (<3, 3, 4, or 5) [P of the analysis of variance (ANOVA) <0.0001]. In a model corrected for age, sex, lifestyle factors, and body mass index, PCSK9 concentration was a significant predictor of all MetS criteria taken individually, except for waist circumference. Plasma PCSK9 levels were significantly associated with low-density lipoprotein cholesterol, but the strongest association was seen with triglycerides even after multiple adjustments.
Conclusions:
The presence of MetS was significantly associated with the PCSK9 concentration. Further studies are needed to provide a molecular connection between PCSK9 and insulin, as well as triglyceride metabolism.
Introduction
C
The metabolic syndrome (MetS) is a cluster of cardiometabolic risk factors that is associated with increased risk of CVD. Indeed, subjects with MetS are thrice more likely to experience a CVD event and twice as likely to die from this event, compared to subjects without the syndrome. Furthermore, subjects with MetS have a fivefold greater risk of developing T2D, and mortality due to CVD of up to 80% of the type 2 diabetic individuals has been projected. 3
A study of Kaduka et al. reported a high prevalence of MetS in urban Kenyans, reaching 40% in women and 30% in men, compared to the estimated worldwide prevalence of 25%. 3,4 The same trend has been observed in other sub-Saharan African cohorts. 5,6 This increase in the prevalence of MetS in Africa is mainly due to the transition toward a Western lifestyle. 7
Discovered in 2003, 8 –10 proprotein convertase subtilisin/kexin type 9 (PCSK9) is a protein that binds to the low-density lipoprotein receptor and promotes its degradation, resulting in high low-density lipoprotein cholesterol (LDL-C) levels. 11 PCSK9 concentrations have been positively associated with incident CVD, independent of LDL-C levels and other traditional risk factors. 12 Although the role of PCSK9 on hepatic cholesterol metabolism has been well investigated, 13 its relationship to metabolic parameters or altered glucose metabolism remains controversial. 14 –21
To address this issue in a high-risk but understudied population, we measured plasma PCSK9 levels in a cohort of 1443 Kenyans from the Kenya Diabetes Study. The objectives of this study were to explore the association between plasma PCSK9 levels and MetS, as well as lipid parameters, in this relatively healthy population.
Materials and Methods
Study population
Data of 1443 Kenyans from the cross-sectional Kenya Diabetes Study were obtained for the purpose of the present study. Of these, 78 plasma samples were missing or the volume was too small to measure plasma PCSK9. Furthermore, 27 individuals were excluded for incomplete clinical data. A total of 1338 individuals were thus included in the final analysis. This study was conducted among the Luo, Kamba, and Maasai ethnic groups from rural and urban (Nairobi, the capital of Kenya) areas, and all data were collected between August 2005 and January 2006. The majority of rural Luo and Kamba were randomly selected by lot. Some volunteers who showed up at the study site were also included (n = 91). All rural adult Maasai who lived within a 20 km range of the health clinic were invited to participate. In the urban study site, the study participants were recruited on a voluntary basis, following information given by a local social mobilizer individually or in groups. Eligibility criterion for participation was urban residence of minimum 2 years. All potential participants (rural and urban) received information about the study during public meetings. Participants were examined in different pre-established public locations (e.g., schools). Inclusion criterion was to be ≥17 years of age, whereas exclusion criteria included pregnancy, serious illnesses (e.g., malaria), inability to walk unassisted, and severe mental disease. Only 10 subjects in the cohort were treated with hypotensive drugs, and none of them were on lipid-lowering, oral hypoglycemic agents or insulin therapy. A more exhaustive description of the study population and the selection procedure has been presented elsewhere. 22
Oral and written information about the study in Kiswahili, English, and/or the local tribal language was given to participants before obtaining their consent. Written or oral informed consent was obtained from all participants. The study was approved by both the National Ethics Review Committee of Kenya and the Danish National Committee on Biomedical Research Ethics.
Glucose metabolism parameters
In the morning before the oral glucose tolerance test (OGTT), blood samples were taken from an antecubital vein following an 8-hr overnight fast. Blood samples have then been collected 30 and 120 min after the beginning of the standard 75-gram OGTT. Blood glucose was analyzed immediately following the drawing of blood. The glucose dehydrogenase method using hemolyzation and deproteinization on a HemoCue B-Glucose 201+ device (HemoCue AB, Ängelholm, Sweden) was used to analyze blood glucose, whereas blood hemoglobin was measured using a standard Coulter counter technique (model KX-21N; Sysmex Corporation, Kobe, Japan). Insulin concentration was measured by a 1235 AutoDELFIA automatic immunoassay system (sensitivity 0.5 lU/mL) using time-resolved fluoroimmunoassay technique (Kit No. BO80-101; PerkinElmer Life and Analytical Sciences, Wallac Oy, Turku, Finland). Total inter-assay coefficient of variation (CV) for this assay is <6%. Homeostasis model assessment of insulin resistance (HOMA-IR) was then calculated based on fasting glucose and fasting insulin values. 23
Anthropometry and lifestyle variables
All anthropometric parameters were measured in a fasting state. Weight was measured to the nearest 0.1 kg using a portable high precision scale (type BWB-800S MA; Tanita, Tokyo, Japan) and height to the nearest 0.1 cm with a portable stadiometer (Meterex II, D97; UNICEF, Copenhagen, Denmark). Waist circumference (WC) was measured at the middle point between the iliac crest and the costal margin with a body tape (WM02 Body Tape; Chasmors, Hoechstmass, Germany) to the nearest 0.5 cm.
Visceral adipose tissue (VAT) and abdominal subcutaneous adipose tissue (SAT) thickness in cm were measured using ultrasonography method (Aquila Basic Unit, Pie Medical Equipment; Esaote, Maastricht, the Netherlands) with a 3.5/5.0 MHz transducer (Probe Article No. 410638 Curved Array HiD probe R40; Pie Medical Equipment, Maastricht, the Netherlands). Measurements were carried out by qualified professionals using the standardized methods of Stolk et al. 24 For further details on anthropometric measurements, see Christensen et al. 22 Methods concerning the assessment of energy intake 25 and energy expenditure 26 have previously been described.
Blood pressure
After a 15-min rest in a sitting position, blood pressure (BP) was measured twice using an automatic oscillometric device (HEM-7001-E; Omron M6, Kyoto, Japan) on the right mid-upper arm. A third measurement was made if the systolic or diastolic BP differed by more than 5 mmHg between the two initial measurements. The two lowest values were used to calculate the mean BP.
Lipid profile
Methods for lipid profile analysis have been described in more detail elsewhere. 25 Briefly, plasma triglycerides (TG), total cholesterol, and high-density lipoprotein cholesterol (HDL-C) were determined by enzymatic colorimetric methods 27,28 using a Hitachi 912 System (Roche Diagnostics GmbH, Mannheim, Germany). Plasma very low-density lipoprotein cholesterol (VLDL-C) and LDL-C concentration were calculated according to Friedewald equations. 29
PCSK9 measurement
The remaining blood samples were centrifuged, kept on ice in Kenya before being shipped to Denmark, and then kept at −80°C for further analysis. Total plasma PCSK9 concentration was analyzed by an in-house enzyme-linked immunosorbent assay (ELISA) using a polyclonal antibody against human PCSK9. This ELISA has been developed in 2010 at the Montreal Clinical Research Institute (IRCM) and has previously been described in detail. 30 This assay allows to measure concentrations as low as 1 ng/mL. The intra- and inter-CVs were 5.16% and 12.56%, respectively. All PCSK9 analyses were done in February 2016.
MetS definition
The International Diabetes Federation (IDF) 2009 consensus statement criteria were used to assess the presence of MetS. 31
Statistical analyses
Statistical analyses were performed using SAS 9.4 (SAS Institute, Cary, NC) and SPSS 20.0 (IBM Corp, Armonk, NY). A statistical significance level was established at P ≤ 0.05, and all P values are two sided. Continuous normally distributed variables are expressed as mean ± standard deviation, whereas continuous variables with a skewed distribution are presented as median with interquartile range. These variables were logarithmically transformed before the analysis. Categorical variables are summarized as frequency (n (%).
To compare the characteristics of the participants and plasma PCSK9 in the MetS group versus the non-MetS group, Student's t-test (for continuous variables) and Chi-squared test (for categorical variables) were performed. One-way analysis of variance (ANOVA) followed by a post hoc Tukey test for multiple comparisons of means was used to compare plasma PCSK9 according to the number of MetS criteria (<3, 3, 4, or 5).
To evaluate the strength of association between the presence of the MetS or individual MetS criteria and plasma PCSK9, a binary logistic regression was performed according to two different models, whereas the lipid concentration prediction by plasma PCSK9 was assessed by linear regressions.
Results
Prevalence of MetS
In this cohort of 1338 Kenyans from the Kenya Diabetes Study, 24% of the participants did not meet any of the criteria for MetS, whereas the majority presented with 1 (44%) or 2 (21%) MetS criteria. A total of 11% of the cohort was affected by MetS, presenting with 3 (8%), 4 (2%), or 5 (1%) MetS criteria. Among individuals with MetS (n = 141), 129 (91%) had elevated WC, 111 (79%) met the blood pressure criteria, 38 (27%) had elevated blood glucose, 62 (44%) had high TG levels, and 132 (94%) had low HDL-C levels. The prevalence of MetS according to sex, ethnic group, and residency status is presented in Supplementary Figures S1B, 2B, and S3B, respectively. Supplementary Data are available online at
Description of the study cohort
Subject characteristics according to MetS status are shown in Table 1. The two groups were significantly different for all MetS-related parameters, including anthropometric parameters [body mass index (BMI), WC, VAT, and SAT], blood pressure (systolic and diastolic), glucose metabolism parameters [fasting glucose and insulinemia, glycated hemoglobin (HbA1c), 120 min glucose, and HOMA-IR], and all lipid profile parameters (Total cholesterol, LDL-C, VLDL-C, TG, HDL-C, and non-HDL-C). Briefly, WC was 26% higher in the MetS group than in the non-MetS group (95.1 cm vs. 75.5 cm, P < 0.0001, respectively). The systolic and diastolic blood pressures were 19 and 11 mmHg higher in the MetS group, respectively (P < 0.0001). Fasting plasma glucose was normal in both groups, but significantly higher in the MetS group than in the non-MetS group (4.6 mmol/L vs. 4.3 mmol/L, P < 0.0001, respectively). Finally, TG levels were 76% higher (1.46 mmol/L vs. 0.83 mmol/L), whereas HDL-C levels were 16% lower (0.96 mmol/L vs. 1.11 mmol/L) in the MetS group compared to the non-MetS group (P < 0.0001). The cohort comprised 59% women (69.5% in the MetS group and 57.3% in the non-MetS group) and mean age was 37.3 ± 10.4 years in the non-MetS group and 45.1 ± 1.0 years in the MetS group.
Bold values represent P values equal or less than 0.05.
P values for Student's t-test (continuous variables) or Chi-squared test (categorical variables). Data for continuous normally distributed variables are expressed as mean ± SD, whereas continuous logarithmic variables are expressed as median (interquartile range). Categorical variables are expressed as frequency n (%).
BMI, body mass index; CVD, cardiovascular disease; HbA1c, glycated hemoglobin; HDL-C, high-density lipoprotein cholesterol; HOMA-IR, homeostasis model assessment of insulin resistance; kcal, kilocalorie; LDL-C, low-density lipoprotein cholesterol; MetS, metabolic syndrome; SAT, subcutaneous adipose tissue; SD, standard deviation; VAT, visceral adipose tissue; VLDL-C, very low-density lipoprotein cholesterol; WC, waist circumference.
Plasma PCSK9 is higher in the MetS group than in the non-MetS group and increases with the number of MetS components
The mean concentration of PCSK9 in the non-MetS group was 148.0 ng/mL compared to 167.2 ng/mL in the MetS group. This difference was statistically significant (P < 0.0001). A progressive increase in PCSK9 concentrations was also observed when subjects were stratified according to the number of MetS criteria (148.0, 164.9, 171.8, and 177.3 ng/mL for <3, 3, 4, and 5 criteria, respectively, P of the ANOVA <0.0001) (Fig. 1). Supplementary Figures S1A, S2A, and S3A presented the mean concentration of PCSK9 according to sex, ethnic group, and residency status, respectively.
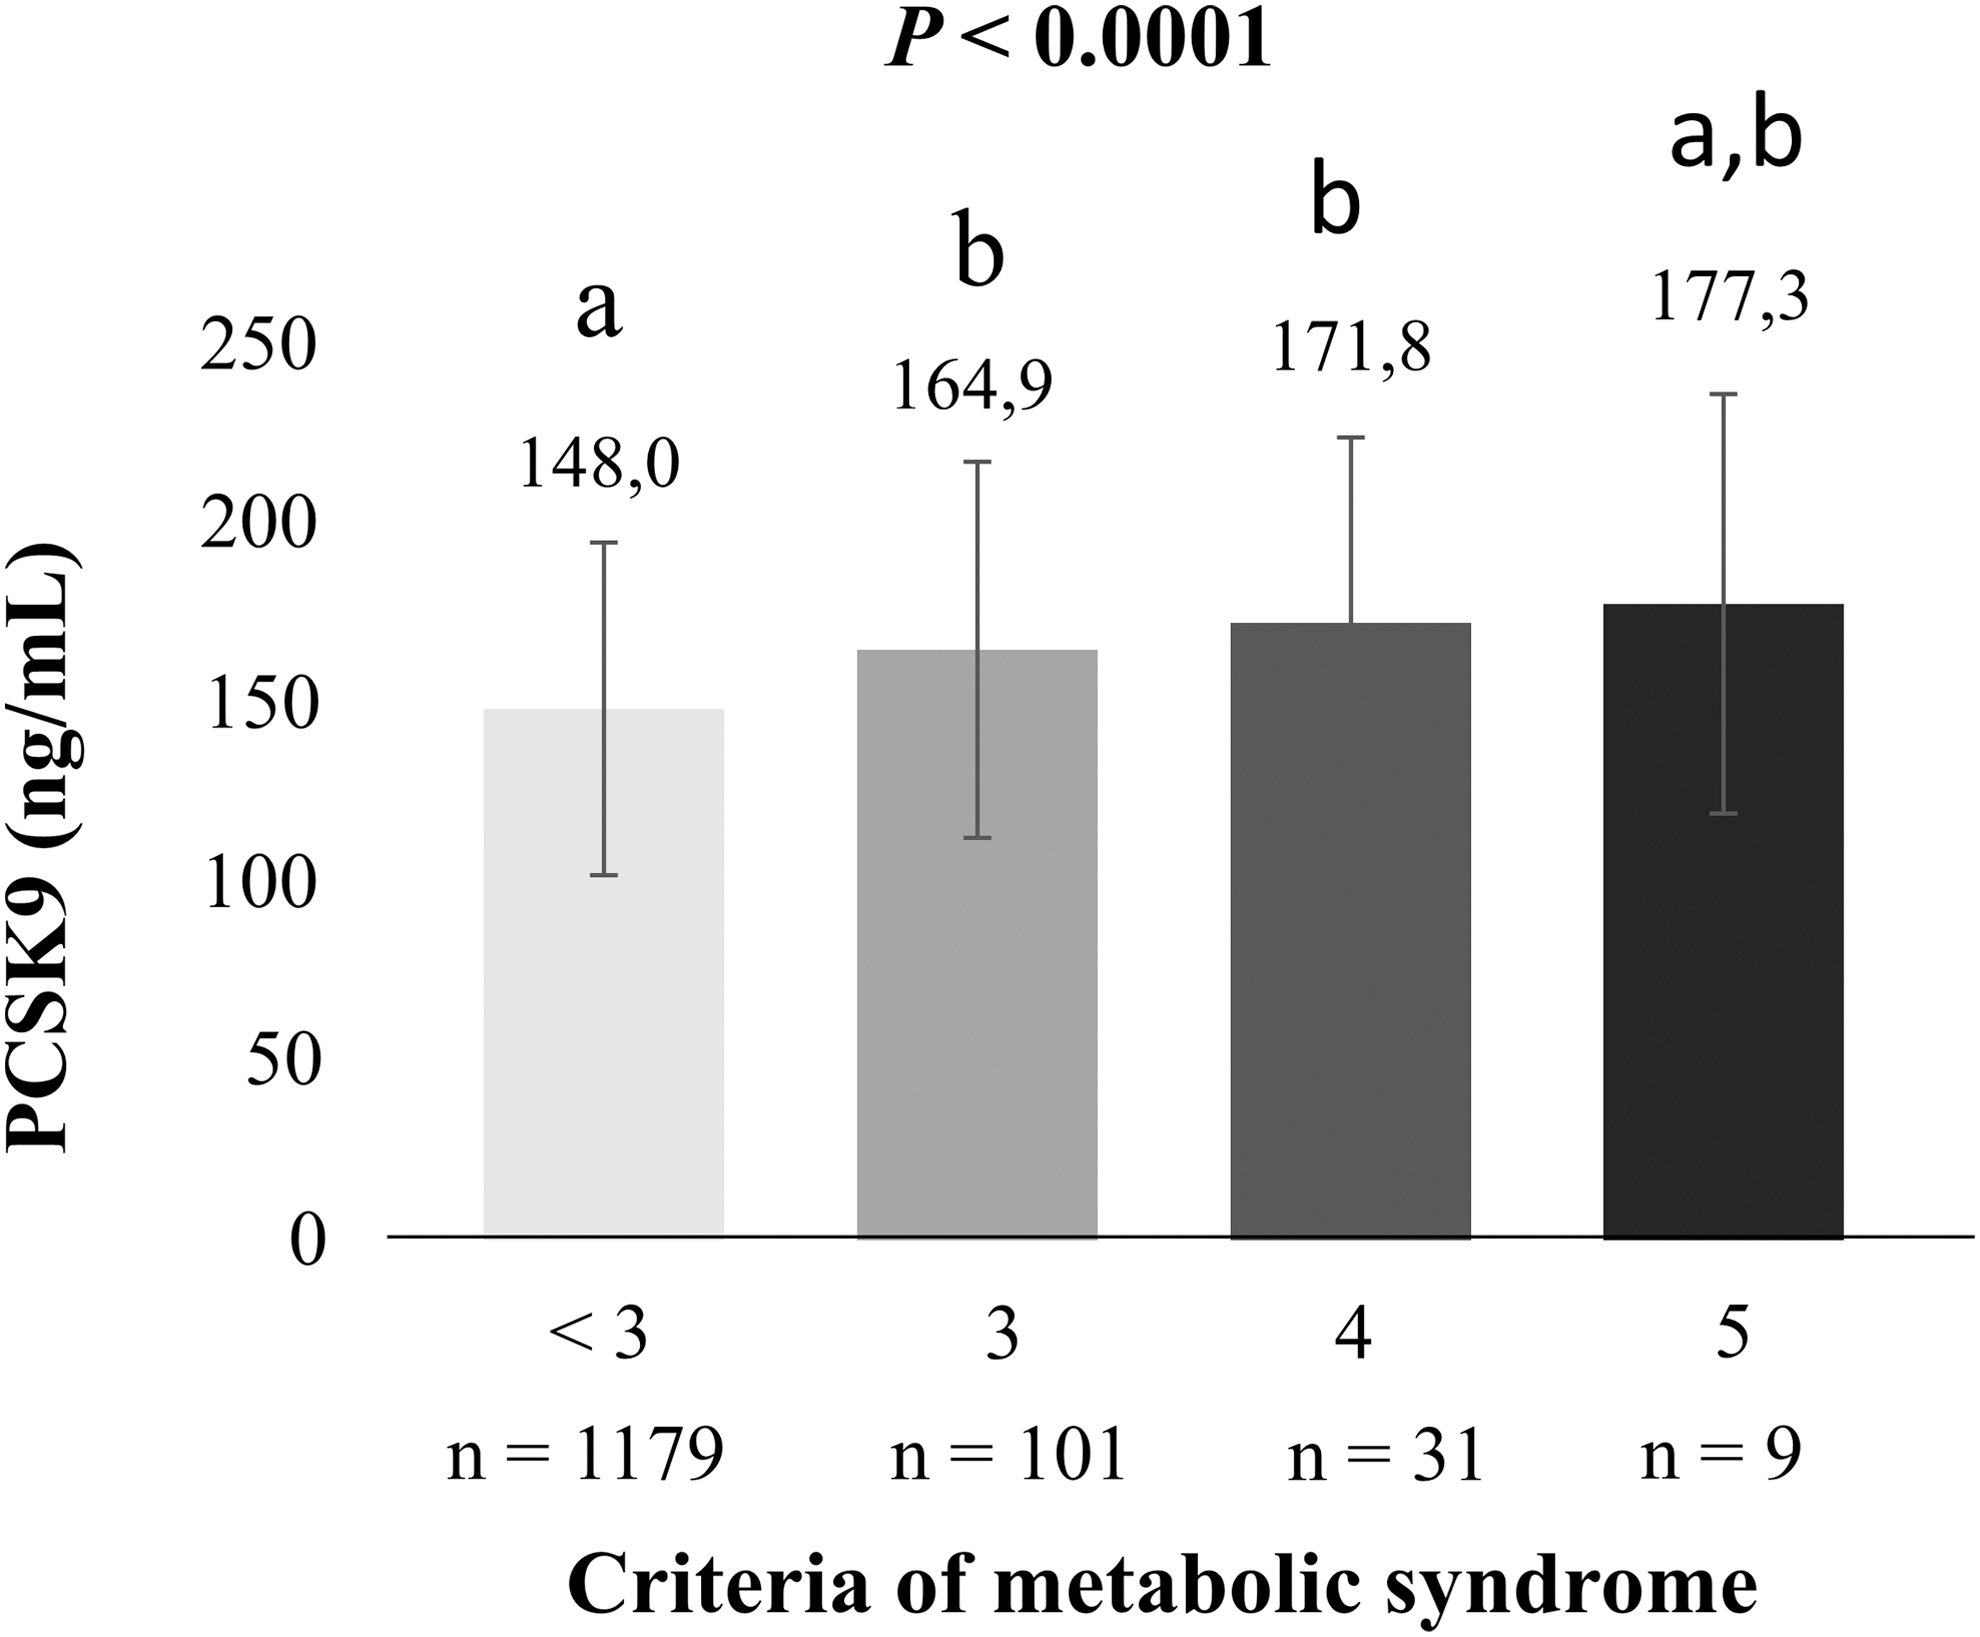
Plasma PCSK9 concentration according to the number of metabolic syndrome criteria. P value for ANOVA between groups, where “a” is significantly different from “b”, and “ab” is not different from either “a” or “b”. The post hoc Tukey test was used for multiple comparisons of means. PCSK9, proprotein convertase subtilisin/kexin type 9. ANOVA, analysis of variance.
Plasma PCSK9 concentrations significantly predict MetS criteria independent of age, sex, lifestyle factors, and BMI
Table 2 presents three models for MetS and individual MetS criteria prediction by plasma PCSK9. In the uncorrected model, plasma PCSK9 significantly predicted the presence of MetS and all individual MetS criteria. When the model was corrected for age, sex, lifestyle factors, and BMI, PCSK9 remained an independent predictor for the presence of all MetS criteria, except for the WC (P = 0.52). When an additional correction for HOMA-IR was added (Model 3), PCSK9 remained an independent predictor only for lipid-related criteria (HDL-C and TG criteria).
Bold values represent P values equal or less than 0.05.
P values for logistic regression.
Model 1: uncorrected model.
Model 2: corrected for age, sex, lifestyle factors, and BMI.
Model 3: corrected for age, sex, lifestyle factors, BMI, and HOMA-IR.
HTN, hypertension; PCSK9, proprotein convertase subtilisin/kexin type 9; TG, triglycerides.
Plasma PCSK9 concentrations significantly predict all lipid parameter concentration independent of age, sex, lifestyle factors, BMI, and HOMA-IR
In both the uncorrected model and the model corrected for age, sex, lifestyle factors, BMI, and HOMA-IR, plasma PCSK9 was still a significant predictor of all lipid parameter concentration (P < 0.0001) (Table 3).
P values for linear regression.
Model 1: uncorrected model.
Model 2: corrected for age, sex, lifestyle factors, BMI, and HOMA-IR.
Discussion
This is the first study to report the association between PCSK9 and the MetS in an African cohort. We observed a positive association between circulating PCSK9 levels and MetS features, as well as lipid parameters in a cohort of 1338 Kenyan individuals.
The MetS prevalence in our Kenyan cohort was found to be only 11%, which is lower than the prevalence previously reported by other authors. 4 –6 However, the importance of each MetS component observed in the present study is highly consistent with the results of a previous report in Africans and African Americans. The study by Sumner et al. also reported that the three most frequent features among individuals with MetS were low HDL-C, central obesity, and hypertension, whereas this population was less likely to have high TG levels or hyperglycemia. 32
The role of PCSK9 on glucose metabolism is still poorly understood. However, an increasing number of evidence suggests that insulinemia, through a pathway involving sterol regulatory element-binding protein (SREBP)-1c and SREBP-2, regulates PCSK9. 33,34 Hyperinsulinemia, as a result of insulin resistance, is the key mechanism thought to underlie MetS. 35 While studies that investigated the effect of acute insulin administration on plasma PCSK9 showed no effect or an inhibitory effect, 21,36 most of the studies that investigated the association between fasting insulinemia and circulating PCSK9 observed a positive correlation. 37,38 In addition, plasma PCSK9 levels are significantly higher in type 2 than in type 1 diabetic patients, 39 suggesting a potential association between insulin resistance and plasma PCSK9. This pathway could thus explain the association between PCSK9 and MetS. The elevation in PCSK9 observed in patients with the MetS could perhaps, in part, explain the higher cardiovascular risk observed in patients affected with the MetS.
Taken in a broader context, our results observed in an African cohort are similar to those observed in Caucasian subjects. 40,41 This would suggest that the relationship between PCSK9 and the MetS is not specific to certain ethnic groups.
It is interesting to note that after correcting for the HOMA-IR there was no significant association between PCSK9 and several features of the MetS (WC, blood pressure, and glycemia), whereas the association remained for lipid parameters (TG and HDL-C). This would suggest that different mechanisms explaining these associations do exist. Surprisingly, TG were more strongly associated with PCSK9 than was LDL-C despite the well-known role of PCSK9 on LDL-C metabolism. Several other studies, including the large multiethnic Dallas Heart Study, have also showed the association between PCSK9 and TG. 30,37,38,42 It is well established that hyperinsulinemia and insulin resistance are associated with very low-density lipoprotein (VLDL) overproduction and consequently with high TG levels. 43,44 However, in the present study, this association appeared to be independent of HOMA-IR and could therefore be driven by insulin-independent mechanisms. It has been suggested that PCSK9 may be directly involved in TG metabolism through an increase in apolipoprotein B (apoB) synthesis (VLDL production) through the inhibition of intracellular apoB degradation 45,46 or through binding and degradation of VLDL receptor. 16
The major strength of our analysis relies on the relatively large size of our cohort, as well as the fact that very few subjects had concomitant disease or were taking medications. Indeed, only 10 subjects in the cohort (0.7%) were taking hypotensive drug and none of them were taking statins.
Our study comprises some limitations that need to be pointed out. First, DNA samples were not available; consequently we could not assess the PCSK9 loss-of-function and gain-of-function variations/mutations present in the analyzed population. Another limitation includes the observational nature of the study, which does not enable us to explain the mechanisms underlying the association between PCSK9 and MetS. It is also important to mention that PCSK9 measurements are still not standardized across laboratories, for which reason any comparison of our results must be interpreted with caution.
Conclusions
In conclusion, circulating PCSK9 level is positively associated with MetS traits and all lipid parameters in a cohort of sub-Saharan Africans. High PCSK9 levels may thus play a role in dyslipidemias and increased cardiovascular risk occurring in patients with the MetS. PCSK9 could therefore represent a potential biomarker of MetS. Further investigations are necessary to unravel the mechanisms behind the association of PCSK9-MetS and to determine whether high PCSK9 level is a cause or a consequence of MetS, or both.
Footnotes
Acknowledgments
The authors are grateful to all participants, the local chiefs and sub-chiefs, the local elder councils, and district politicians. The authors are also indebted to the late Benedict Omondi (KEMRI), Tobias Oketch (CVBCR and KEMRI), Arthur J. Ukumu (DVBD), Odero Sabiano (DVBD), and Saidi Kisiwa (KEMRI) for their skillful collection and analysis of blood samples in the field. The authors sincerely thank Philista Singore for excellent clinical health assessment of the study participants and are thankful to all local assistants for their effort in excellent social mobilization and collection of data. The authors acknowledge the permission by the Director of KEMRI to publish this article.
Authors' Contributions
The authors' contributions were as follows: All authors contributed to the discussion and data interpretation and have drafted and reviewed the article for the intellectual content. M.P. and Y.G.L.S. performed statistical analysis. All authors have read and approved the final article. A.B. had primary responsibility for final content.
Author Disclosure Statement
A.B. and R.D. received research grants from Merck Frosst, Amgen, AstraZeneca, CIHR, and the Fondation Leducq. They have participated in clinical research protocols from Pfizer, Regeneron Pharmaceuticals, Inc., The Medicines Company, Amgen, Acasti Pharma, Inc., Novartis, Sanofi, Ionis Pharmaceuticals, Inc., AstraZeneca, and Merck Frosst. Both have served on advisory boards for Amgen and Sanofi and received honoraria for symposia from Amgen and Sanofi. D.L.C. has received consultancy payment from Novo Nordisk A/S. M.P., Y.G.L.S., A.C., A.P., F.L.-T., L.K., and N.G.S. have no disclosures to report.
References
Supplementary Material
Please find the following supplemental material available below.
For Open Access articles published under a Creative Commons License, all supplemental material carries the same license as the article it is associated with.
For non-Open Access articles published, all supplemental material carries a non-exclusive license, and permission requests for re-use of supplemental material or any part of supplemental material shall be sent directly to the copyright owner as specified in the copyright notice associated with the article.