
Abstract
Background:
Metabolically healthy obese (MHO) individuals generally show better cardiovascular prognosis compared with metabolically unhealthy counterparts, which may be related to different patterns of target organ damage (TOD). We aimed to investigate the patterns of TOD related to obesity and metabolic unhealthiness.
Methods:
A total of 659 Korean adults (mean age, 60.0 ± 11.8 years; male, 51.1%) undergoing health examinations were stratified into four groups according to obesity (body mass index ≥25.0 kg/m2) and metabolic healthiness (meeting ≤1 criteria of metabolic syndrome excluding abdominal circumference): metabolically healthy nonobese (MHNO), metabolically unhealthy nonobese (MUNO), MHO, and metabolically unhealthy obese (MUO). Four measures of TOD were evaluated: arterial stiffness, renal dysfunction, left ventricular (LV) diastolic dysfunction, and LV hypertrophy (LVH).
Results:
In multivariable analyses, compared with the MHNO group, the MHO group showed 2.31 times higher odds for LVH, whereas, the MUNO group showed 3.14 and 6.28 times higher odds for increased arterial stiffness and renal dysfunction, respectively. Metabolic unhealthiness was associated with increased arterial stiffness [odds ratio (OR) 2.73; confidence interval (95% CI) 1.72–4.34], renal dysfunction (OR 4.02; 95% CI 1.54–10.49), and LV diastolic dysfunction (OR 2.28; 95% CI 1.14–4.55). Meanwhile, obesity showed weaker association with LVH and LV diastolic dysfunction, and was not associated with increased arterial stiffness and renal dysfunction in multivariable analyses.
Conclusions:
Metabolic unhealthiness shows more association with TOD than obesity, which may contribute to the higher risk of cardiometabolic abnormalities in MUNO compared with MHO.
Introduction
A
Metabolic syndrome (MetS), a clustering of metabolic abnormalities such as central obesity, insulin resistance, raised blood pressure, and dyslipidemia, is associated with increased risk of diabetes mellitus and CVD. 4 The prevalence of MetS has increased worldwide in the recent decades, and a quarter to a third of the population in most countries is reported to have MetS. It has been suggested that the increasing trend of central obesity is 1 of the main factors in the growth of MetS. 5,6
A subset of obese individuals who have otherwise metabolically healthy profiles can be classified as the “metabolically healthy obese (MHO).” 7 On the other hand, there is a subgroup of individuals having normal BMI, but displaying a cluster of obesity-related abnormalities [ = metabolically unhealthy nonobese (MUNO)]. 8 In the United States, the prevalence of MHO among obese adults has been reported as 31.7% (16.6% using more stringent criteria), and the prevalence of MUNO as 23.5%. 7 It has been reported that the health outcomes of these subgroups are different; however, results are still conflicting. 9,10
Metabolic unhealthiness appears to be more harmful than simple obesity; MUNO groups have worse health outcomes and organ damage compared with MHO groups. Previous studies have demonstrated the different patterns of subclinical target organ damage (TOD) appearing in the MHO and MUNO groups. MUNO groups tend to have increased arterial stiffness and more pronounced cardiac dysfunction, 11 –13 while MHO groups show left ventricular hypertrophy (LVH), 11,12 but not significantly different TOD, 14 –18 compared with controls or less TOD compared with MUNO groups. 13,15 –18 Although some studies have examined the separate measures of TOD and its relationship with MetS or obesity, 11,12,19,20 systematic investigations using various TOD parameters in the Korean population have been rarely performed.
Through a cross-sectional study of asymptomatic adults who visited the hospital for health examinations, we aimed to assess the effects of BMI and metabolic risk factors on subclinical TOD, and whether there is a difference in odds for subclinical TOD among subgroups according to obesity and metabolic health status.
Materials and Methods
Study subjects
This single-center study was performed at Boramae Medical Center (Seoul, Korea), a tertiary teaching hospital with 763 beds and around 3300 daily outpatients. Between August 2013 and June 2014, a total of 784 asymptomatic adults who visited our hospital for health examinations and voluntarily chose packages including cardiovascular options were retrospectively reviewed. Blood tests, measurements of brachial-ankle pulse wave velocity (baPWV) and transthoracic echocardiography were performed on the same day. Subjects with the following conditions were excluded from the study: (1) documented coronary artery disease (myocardial infarction or coronary revascularization) or stroke, (2) LV ejection fraction <50%, (3) nonsinus rhythm, and (4) ankle-brachial index <0.9. After these exclusions, 659 subjects were finally analyzed in this study. This study protocol was approved by the Institutional Review Board (IRB) of Boramae Medical Center (Seoul, Korea) (IRB No. 26-2016-170), and informed consent was waived by IRB due to the retrospective study design and routine nature of information collected.
Data collection
All study subjects were medically stable at the time of health checkup. They underwent comprehensive history taking, physical examination, and laboratory tests by sampling venous blood in the morning after overnight fasting. BMI was calculated as weight in kilograms divided by the square of height in meters (kg/m2). Systolic and diastolic blood pressure (SBP and DBP, respectively) and heart rate were measured by a trained nurse using an oscillometric device; subjects on antihypertensive medication were given notice to take them as usual. Traditional cardiovascular risk factors, including hypertension, diabetes mellitus, dyslipidemia, and smoking status, were assessed by a standardized questionnaire. Hypertension was defined as the use of antihypertensive medications or SBP ≥140 mmHg and/or DBP ≥90 mmHg. Diabetes mellitus was defined as the use of oral hypoglycemic medications or insulin, or serum fasting glucose level ≥126 mg/dL. Dyslipidemia was defined as the use of antidyslipidemic medications or low-density lipoprotein cholesterol (LDL-C) level ≥160 mg/dL. Subjects were classified as smokers if they had smoked regularly during the previous 12 months. Fasting glucose, total cholesterol, LDL-C, high-density lipoprotein cholesterol (HDL-C), triglyceride, creatinine, and C-reactive protein were measured by an automated enzymatic procedure. Estimated glomerular filtration rate (eGFR) was calculated using 4-component Modification of Diet in Renal Disease (MDRD) Study equation incorporating age, race, sex, and serum creatinine level. 21
Transthoracic echocardiography
Transthoracic echocardiography was performed using a 2.5-MHz probe with commercially available ultrasound systems (Sequoia; Siemens Medical Solutions, Mountain View, CA or Vivid 7; GE Medical Systems, Milwaukee, WI). The LV ejection fraction was calculated using Simpson's biplane method. M-mode was used to measure LV chamber dimensions and wall thickness, and LV mass was calculated with a validated formula and indexed to the body surface area. 22 The peak early transmitral filling velocity during early diastole (E) was imaged at the tip of the mitral leaflets from an apical four-chamber view, and color-coded tissue Doppler imaging was applied to the apical four-chamber view to determine mean early (e′) velocity at the septal mitral annulus. E/e′ was calculated as an index of LV filling pressure. 23 All measurements represented the average of three consecutive cardiac cycles. Two experienced cardiosonographers performed echocardiography. The correlation coefficient for interobserver agreements was 0.92 for E/e′ in our laboratory.
baPWV measurement
The baPWV was measured using a previously described protocol. 24 All the regular medications were permitted, but caffeine ingestion and cigarette smoking were not allowed before the measurement. All measurements were conducted in a quiet room at a constant temperature, and subjects were examined in the supine position after at least 5 min of rest. Then, baPWV was measured by a volume-plethysmographic apparatus (VP-1000; Colin Co., Ltd., Komaki, Japan) according to the manufacturer's instructions, by the same experienced investigator. Phonogram and pulse volume waveform were obtained with cuffs placed around both the brachia and the ankles. The mean value of the right- and left-sided baPWV was used for the analysis. Blood pressure and heart rate were measured and recorded by using the same device. The intraobserver coefficient of variation in the baPWV measurement was about 5% in our laboratory.
Definitions and subject grouping
The World Health Organization (WHO) Asia-Pacific definitions of obesity and BMI groups were adopted in our study 25 : underweight (≤18.4 kg/m2), normal weight (18.5–22.9 kg/m2), overweight (23–24.9 kg/m2), obesity stage 1 (25–29.9 kg/m2), and obesity stage 2 (≥30 kg/m2). To define metabolic healthiness, we referred to the standard definition of MetS 4 and prior studies regarding MHO. 7,26,27 Metabolic unhealthiness was defined as meeting two or more of the following four risk factors of MetS: (1) elevated blood pressure (SBP ≥130 mmHg or DBP ≥85 mmHg) or use of relevant medications, (2) elevated fasting glucose (≥100 mg/dL), or use of relevant medications, (3) elevated triglycerides (≥150 mg/dL), (4) reduced HDL-C (<40 mg/dL for men and <50 mg/dL for women). Subjects with none or one of the above risk factors were considered metabolically healthy. Participants were stratified into four groups by obesity (BMI ≥25 kg/m2) and metabolic health status: the metabolically healthy nonobese (MHNO), MUNO, MHO, and metabolically unhealthy obese (MUO) groups.
Target organ damage
In this study, we focused on four major measures of TOD: increased arterial stiffness, renal dysfunction, LV diastolic dysfunction, and LVH. Increased arterial stiffness was defined as baPWV ≥1700 cm/s. 28,29 Renal dysfunction was defined as eGFR <60 mL/min/1.73 m2. 21 Septal E/e′ ≥15 was considered to be indicative of increased LV filling pressure and thus LV diastolic dysfunction. 23 LVH was defined as LV mass index (LVMI) ≥115 g/m2 for men and LVMI ≥95 g/m2 for women. 22
Statistical analysis
Descriptive data are presented as means ± standard deviation for continuous variables and n (percentage) for categorical variables. Differences in clinical characteristics among the groups were compared using the analysis of variance for continuous variables or the chi-square test for categorical variables. The association of BMI, metabolic health status, and subsequent groups with subclinical TOD were calculated using logistic regression analysis, and expressed as odds ratios (OR) with confidence intervals (95% CI). Multivariable adjustment was done for age and sex; and MetS risk factors (elevated blood pressure, elevated fasting glucose, high triglycerides or low HDL-C) in the case of obesity; and obesity in the case of metabolic healthiness. Mean values of the parameters were adjusted for sex and age, and compared using analysis of covariance and Bonferroni post hoc analysis. Significance level was set at two-sided P value <0.05. All statistical analyses were performed using SPSS version 21 (IBM Co., Armonk, NY).
Results
Clinical characteristics of the study population
The mean age of the total study subjects was 60.0 ± 11.8 years, and 51.1% were male. Mean BMI was 24.7 ± 3.3 kg/m2, and 278 (42.2%) were classified as obese. Hypertension was present in 397 subjects (60.2%), diabetes mellitus in 151 subjects (22.9%), and dyslipidemia in 421 subjects (63.9%). A total of 429 subjects (65.1%) were classified as metabolically unhealthy. Of the obese population, 72 subjects (25.9%) were classified as MHO, while of the nonobese population 223 subjects (58.1%) were classified as MUNO (Fig. 1).
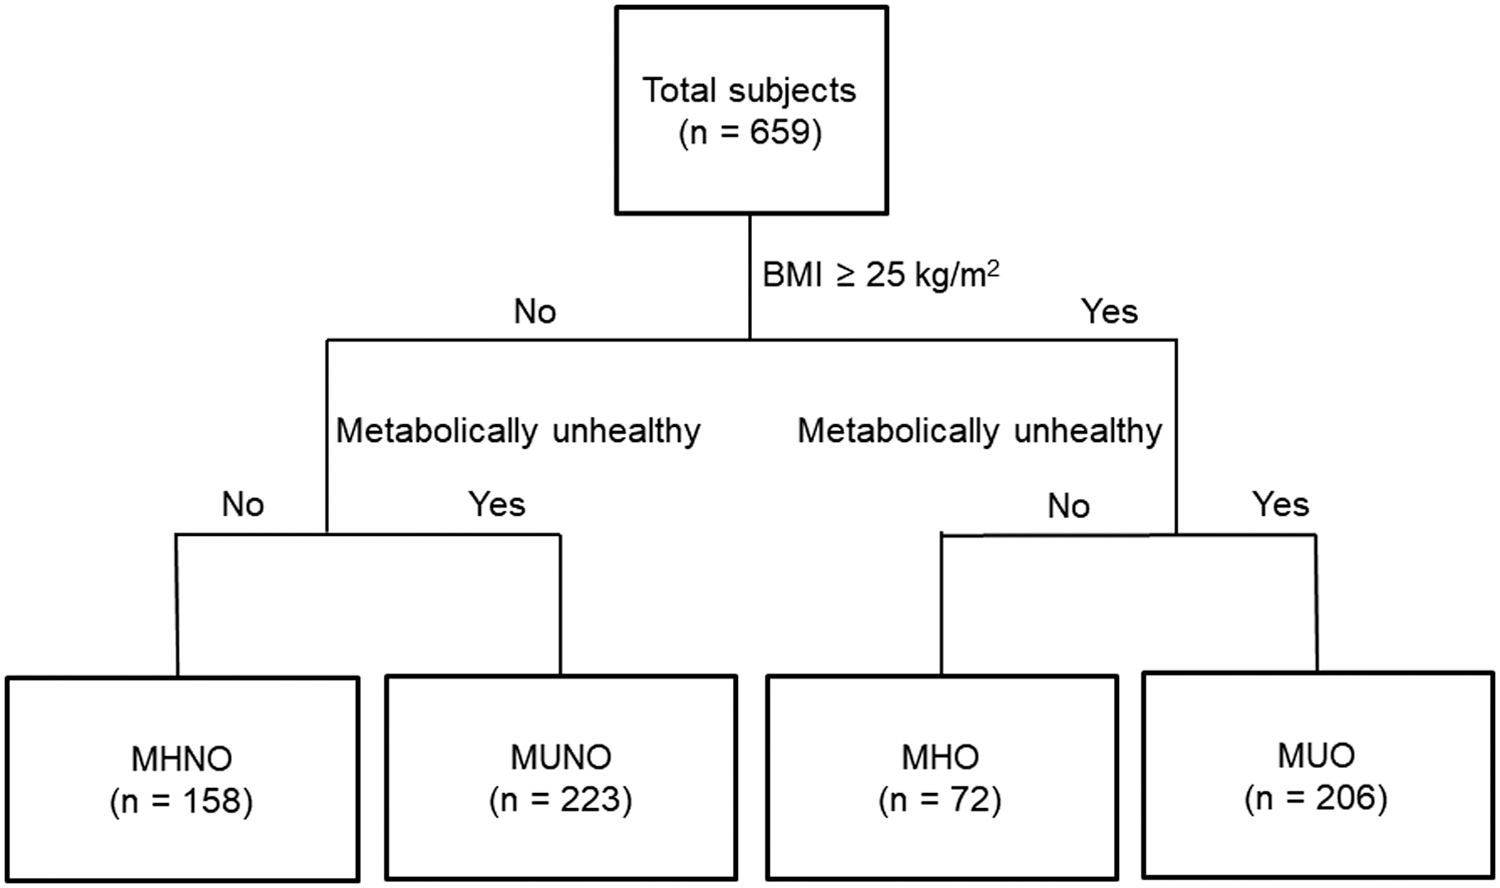
Four groups stratified according to obesity and metabolic health. MHNO, metabolically healthy nonobese; MHO, metabolically healthy obese; MUNO, metabolically unhealthy nonobese; MUO, metabolically unhealthy obese.
Participants were stratified into four groups according to BMI and metabolic health status: 158 participants in the MHNO group, 223 in the MUNO group, 72 in the MHO group, and 206 in the MUO group. The clinical characteristics of each group are summarized in Table 1. The mean BMI of the obese groups were between 27 and 28 kg/m2, while that of the nonobese groups were between 22 and 23 kg/m2. The metabolically unhealthy groups were older, and the MUNO group was the oldest with a mean age of 62.3 ± 10.5 years, while the MHO group was the youngest with a mean age of 55.5 ± 13.8 years. The obese groups had a higher percentage of men. The metabolically unhealthy groups had higher incidences of coronary risk factors, including hypertension, diabetes mellitus, and dyslipidemia. Blood pressure increased in the order of MHNO, MHO, MUNO, and MUO group. Fasting blood glucose and triglyceride levels were higher in metabolically unhealthy groups than those of metabolically healthy groups. LDL-C and HDL-C levels were higher in metabolically healthy groups compared with metabolically unhealthy groups. There was no significant difference in LV ejection fraction between these groups.
P values are for comparisons among the four groups by analysis of variance for continuous variables or the chi-square test for categorical variables. Elevated blood pressure indicates SBP ≥130 mmHg or DBP ≥85 mmHg or use of relevant medications; elevated fasting glucose indicates fasting glucose ≥100 mg/dL or use of relevant medications; high TG or low HDL cholesterol indicates TG ≥150 mg/dL or HDL cholesterol <40 mg/dL for men and <50 mg/dL for women.
baPWV, brachial-ankle pulse wave velocity; DBP, diastolic blood pressure; eGFR, estimated glomerular filtration rate; HDL, high-density lipoprotein; LDL, low-density lipoprotein; LV, left ventricular; MHNO, metabolically healthy nonobese; MHO, metabolically healthy obese; MUNO, metabolically unhealthy nonobese; MUO, metabolically unhealthy obese; SBP, systolic blood pressure; TG, triglycerides.
Association between obesity and TOD
Associations between BMI and TOD are demonstrated in Table 2. Obesity (BMI ≥25 kg/m2) had significantly greater association with LV diastolic dysfunction (OR 1.82; 95% CI 1.05–3.15) and LVH (OR 1.84; 95% CI 1.21–2.80), after adjustment for age, sex, hypertension, diabetes mellitus, and dyslipidemia. Each 1 kg/m2 increment in BMI was associated with 13% increase in OR for LV diastolic dysfunction and LVH. Compared with normal weight, stage 1 obesity was associated with 2.43-fold increase in OR for LV diastolic dysfunction, and there was a linear increase in OR for LVH according to the severity of obesity. Though not significant, the OR for renal dysfunction increased in proportion to BMI. The severity of obesity was not associated with arterial stiffness.
Numbers represent odds ratio and 95% confidence interval. aAge, sex, and metabolic syndrome risk factors were adjusted for.
BMI, body mass index; LVMI, LV mass index.
Association between metabolic health status and TOD
Associations between metabolic health status and TOD are demonstrated in Table 3. Metabolic unhealthiness was associated with increased arterial stiffness (OR 2.73; 95% CI 1.72–4.34), renal dysfunction (OR 4.02; 95% CI 1.54–10.49), and LV diastolic dysfunction (OR 2.28; 95% CI 1.14–4.55), while its effect on LVH was not significant, after adjustment for age, sex, and obesity. Each increment in the number of metabolic risk factors was associated with an approximately twofold increase in OR for arterial stiffening (OR 1.93; 95% CI 1.56–2.39) and renal dysfunction (OR 2.05; 95% CI 1.48–2.84). The degree of association with arterial stiffening and renal dysfunction increased in proportion to the number of metabolic risk factors (Table 3). However, the number of risk factors did not show any significant association with LV diastolic dysfunction or LVH. The prevalence of TOD was very low in the subgroup with 0 risk factors (Supplementary Table S1; Supplementary Data are available online at
Numbers represent odds ratio and 95% confidence interval. aAge, sex, and obesity were adjusted for.
Associations of obesity and metabolic health with TOD
As there were significant differences in age and sex between the groups, mean values of the parameters, indicating TOD, were compared after adjustment for age and sex (Table 4). In all parameters of TOD, the MHNO group showed the best values, while the MUO group showed the worst values. Compared with the MHNO group, the MUNO group showed higher baPWV and E/e′, and the MHO group had a greater LVMI. Compared with the MHO group, the MUNO group had a higher baPWV.
Numbers represent mean value ± standard deviation, adjusted for sex and age, and compared using ANCOVA and Bonferroni post hoc analysis. P values were obtained from the comparisons among four groups by ANCOVA; the superscript letters indicate statistically significant differences between groups with the same letters on post hoc analysis.
ANCOVA, analysis of covariance; MUO, metabolically unhealthy obese; TOD, target organ damage.
TOD in each group compared with the MHNO group
The OR for TOD in each group compared with the MHNO group with adjustment for age and sex is shown in Table 5. The MUNO group showed 3.14 and 6.28 times higher odds for increased arterial stiffness and renal dysfunction, respectively, compared with the MHNO group. Meanwhile, the MHO group showed 2.31 times higher odds for LVH compared with the MHNO group. The odds for all four TOD parameters were significantly higher in the MUO group compared with the MHNO group: ORs were 2.34, 10.68, 4.15, and 2.01 for increased arterial stiffness, renal dysfunction, LV diastolic dysfunction, and LVH, respectively.
Numbers represent odds ratio and 95% confidence interval. aAge and sex were adjusted for.
MUO, metabolically unhealthy obese.
Discussion
This study reveals that obesity and metabolic unhealthiness are associated with different patterns of TOD. Obesity was associated with LV diastolic dysfunction and LVH, but not with increased arterial stiffness or renal dysfunction, after multivariable adjustment including metabolic risk factors. Meanwhile, metabolic unhealthiness showed associations with increased arterial stiffness, renal dysfunction, and LV diastolic dysfunction, but not with LVH, after multivariable adjustment including obesity. When grouped by obesity and metabolic healthiness, the MHO group showed increased LVH, and the MUNO group showed increased arterial stiffness, renal dysfunction, and LV diastolic dysfunction compared with the MHNO group.
The underlying pathophysiology between obesity and TOD involves insulin resistance, renin-angiotensin-aldosterone system activation, sympathetic nervous system activation, secretion of proinflammatory adipokines, and endothelial and immune dysfunction. 30 –32 Adipose tissue secretes sympathoexcitatory leptin and many inflammatory cytokines including monocyte chemotactic protein-1 (MCP-1), tumor necrosis factor-α (TNF-α), interleukin-6 (IL-6), and C-reactive protein. These cytokines can trigger inflammatory signaling cascades and fibrosis, in addition to inducing endothelial dysfunction, oxidative stress, impaired insulin signaling, and sympathetic activation. 30,31 Obesity is known to be related to the development of cardiomyopathy and myocardial scarring, LVH and diastolic dysfunction, LV dilatation, and systolic dysfunction. 33 Obesity shows dual effects in chronic kidney disease: it is associated with the development of focal segmental glomerulosclerosis-like glomerulopathy and progressive renal failure 34 ; on the other hand, once kidney disease is acquired, higher BMI of overweight and obese ranges is linked with greater survival, 35,36 with data indicating that both higher muscle mass and increased body fat are protective. Meanwhile, there are mixed results on the relationship between obesity and arterial stiffness. 37 –39 These findings are consistent with ours, which showed a significant association of obesity with LV diastolic dysfunction and LVH, borderline association with renal dysfunction, and no significant association with arterial stiffness.
Obesity is commonly accompanied by metabolic derangement, which synergistically acts to deteriorate vascular health and cause TOD. In our study, the obese who did not have metabolic risk factors (MHO group) did not have increased odds for arterial stiffness, renal dysfunction, or LV diastolic dysfunction compared to the reference MHNO group. On the other hand, the metabolically unhealthy groups, even those who were nonobese (MUNO), showed significantly increased odds for these parameters of TOD. Otherwise, LVH was shown to be related to obesity rather than metabolic unhealthiness. The different patterns of subclinical TOD appearing in the MHO and MUNO groups can also be seen in prior studies. The MHO group had similar baPWV values, but higher LVMI and LV filling pressure compared with the MHNO group, while the MUNO group showed significantly higher baPWV and other parameters. 11,12 While the MHO group showed lower global longitudinal strain, greater dyssynchrony, and early diastolic dysfunction compared with nonobese controls, the MUO group showed more pronounced abnormalities. 13 Another study showed that decreased early diastolic strain rate, early diastolic tissue velocity, and systolic strain indicative of subclinical systolic and diastolic cardiac dysfunction are correlated with the number of components of MetS, but not with BMI or degree of fat deposition. 14 Previous studies found MUNO phenotype is associated with higher 15 –18 or at least similar 40 risk of incident chronic kidney disease compared with the MHO phenotype, while the MHO group showed no increase 15 –18 or some increase 40 in risk for CKD compared with the reference MHNO group. All these findings are in line with our results suggesting that while metabolically healthy obesity is not completely benign, it may have some protective effects against TOD.
The different patterns of subclinical TOD in the MHO and MUNO groups may correlate with different prognoses. The pattern of TOD in the MUNO group appears to be associated with worse outcome. The MHO phenotype was initially proposed to have a better cardiovascular prognosis compared with metabolically unhealthy counterparts. A systemic review indicated that around two-thirds of studies showed the MHO groups to have similar all-cause mortality, CVD mortality, and incident CVD compared to the MHNO group, while one-third of the studies showed them to have increased risk. 9 Another meta-analysis showed that patients with MHO are at increased risk of cardiovascular events compared with healthy normal-weight participants. 41 Meanwhile, the MUNO group consistently shows increased risk for mortality and CVD compared to the MHO group. 10,41,42 The pattern of TOD related to metabolic unhealthiness appears to be more strongly linked to CVD risk, compared with the pattern of TOD related to obesity.
This study has several limitations. First, as health examinations were done before the latest guidelines on LV diastolic dysfunction 23 were published, measurements for some criteria were unavailable. We used only septal E/e′ values indicating increased LV filling pressure to represent diastolic dysfunction, and this may limit its diagnostic accuracy. 43 Second, lifestyle information including diet, physical activity, vitamin supplement, and other medications were not available; thus, we could not examine the potential influence of these lifestyle factors. Finally, this is a cross-sectional study, which is not sufficient for a causal relationship. Further studies are needed to verify the different patterns of TOD appearing in MHO and MUNO groups and its effect on prognoses.
Conclusions
Among four parameters of TOD, obesity is mainly associated with LVH, while metabolic unhealthiness shows more association with increased arterial stiffness, renal dysfunction, and LV diastolic dysfunction. These results could partially explain the worse cardiovascular outcomes of metabolic unhealthiness compared with simple obesity. Preventive interventions targeting metabolic abnormalities should be more emphasized.
Footnotes
Author Disclosure Statement
No competing financial interests exist.
References
Supplementary Material
Please find the following supplemental material available below.
For Open Access articles published under a Creative Commons License, all supplemental material carries the same license as the article it is associated with.
For non-Open Access articles published, all supplemental material carries a non-exclusive license, and permission requests for re-use of supplemental material or any part of supplemental material shall be sent directly to the copyright owner as specified in the copyright notice associated with the article.