
Abstract
Objective:
This meta-analysis aimed to compare the effect of the real-time continuous glucose monitoring (rt-CGM) and flash glucose monitoring (FGM) on glycemic control in adults with type 1 diabetes mellitus (T1DM).
Methods:
A systematic literature search of all relevant studies comparing the clinical effectiveness of rt-CGM and FGM in adults with T1DM on Cochrane Library, PubMed, Embase, Web of Science, and Scopus from January 2015 to June 2023 was performed. The primary endpoints were glycated hemoglobin (HbA1c) and TIR (time in range). Secondary endpoints included time below range [TBR (<3.9 mmol/L) and (<3.0 mmol/L)], time above range [TAR (>10.0 mmol/L) and (>13.9 mmol/L)], mean glucose, and glycemic variability (GV) [standard deviations (SD) and coefficient of variation (CV)].
Results:
Six studies with 1516 TIDM patients, including three randomized controlled trials and three observational studies, were enrolled in this meta-analysis. Compared to FGM, rt-CGM led to greater glycemic control, represented by higher TIR (%, 3.9 ∼ 10 mmol/L) (SMD = 0.59, 95% CI: 0.37 ∼ 0.81, p < 0.001), decreased TBR (%, <3.9 mmol/L) (SMD = −1.45, 95% CI: −2.33 ∼ −0.57, p = 0.001), decreased TAR [(%, >10.0 mmol/L) (SMD = −0.38, 95% CI: −0.71 ∼ −0.04, p = 0.03) and (%, >13.9 mmol/L) (SMD = −0.42, 95% CI: −0.79 ∼ −0.04, p = 0.03), respectively], lower mean glucose (SMD = −0.18, 95% CI: −0.31 ∼ −0.06, p = 0.003), decreased SD (SMD = −0.70, 95% CI: −1.09 ∼ −0.31, p < 0.001), and decreased CV (SMD = −0.76, 95% CI: −1.05 ∼ −0.47, p < 0.001). However, there was no difference in lowering HbA1c and TBR (%, <3.0 mmol/L) between groups.
Conclusion:
The rt-CGM outperformed FGM in improving several key CGM metrics among adults with T1DM, but there is no significant difference in HbA1c and TBR (<3.0 mmol/L).
Introduction
Glycated hemoglobin (HbA1c) is confirmed as the most meaningful predictor for diabetic complications by the Diabetes Control and Complications Trial (DCCT). 1,2 However, HbA1c cannot display a comprehensive glycemic exposure for patients with type 1 diabetes mellitus (T1DM), who are more susceptible to glycemic fluctuations. 3 The attainment of HbA1c alone cannot bring additional macrovascular benefits. 4 –6 Continuous glucose monitoring (CGM) can provide real-time trends in hypoglycemia, hyperglycemia, or day-to-day glycemic fluctuation and help make a personalized treatment plan. 7 Now, CGM is becoming part of standard care for people living with T1DM.
CGM technology first emerged in the early 2000s, offering a more convenient and comprehensive alternative to self-monitoring of blood glucose (SMBG). With the rapid development of CGMs, these systems are increasingly popular among patients with diabetes due to their improved accuracy, comfortable experience, and ease of use. Currently, there are two available types of personal CGM systems, including real-time CGM (rt-CGM) system and flash glucose monitoring (FGM) system. 8,9 FGM is also named intermittently scanned CGM (is-CGM). Different CGM systems have unique features that may affect their usefulness and acceptability among different subpopulations. The rt-CGM can automatically and continuously measure the interstitial glucose every1 to 5 min, visualize real-time sensor glucose information on its application, and alert users high or low glucose, enabling users and their clinical teams to adjust insulin doses based on the data. In contrast to rt-CGMs, the first generation of FGM systems is a more affordable alternative technology that measures glucose values continuously, but requires the user to swipe a receiver over the device at least every 8 h to review and store data without gaps.
Previous meta-analyses compared the efficacy of rt-CGM or FGM and SMBG on glycemic control, indicating that CGM use was associated with better glycemic control among patients with diabetes. 10,11 So far, there has been the lack of a head-to-head comparison between the two types of CGM.
We conducted this meta-analysis to provide evidence on the effect of these two available types of personal CGM systems (rt-CGM and the first-generation FGM) on glycemic control.
Materials and Methods
Search strategy and study selection
Electronic searches were performed using Cochrane Library, PubMed, Embase, Web of Science, and Scopus from January 2015 to June 2023. Only peer-reviewed articles in the English language were included. The following search terms were used: “real-time continuous glucose monitoring,” “rt-CGM,” “continuous glucose monitoring,” “CGM,” “flash glucose monitoring,” “FGM,” “intermittently scanned continuous glucose monitoring,” “isCGM,” “intermittently viewed continuous glucose monitoring,” “iCGM,” “diabetes mellitus, type 1,” “type 1 diabetes mellitus,” “T1DM,” “type 1 diabetes,” and “T1D,” as either keywords or MeSH term. Reference lists of all included studies were scanned to identify additional potentially relevant studies. Two researchers independently screened the titles and abstracts of identified articles, and full-text copies of all potentially relevant studies were obtained. The registration number of this meta-analysis in PROSPERO is CRD42022381796.
Inclusion criteria
Studies were included if they met the following criteria: Patients were diagnosed with T1DM and were older than 18 years; Clinical trials or prospective/retrospective cohort series studies; rt-CGM and FGM were adopted in the intervention group and the control group, respectively; The main outcome of the studies was glycemic control, including HbA1c, and/or time in range (TIR), and/or time below range (TBR), and/or time above range (TAR), and/or mean glucose, and/or glycemic variability (GV) [standard deviations (SD) and coefficient of variation (CV)].
Exclusion criteria
Studies were excluded if they met the following criteria: Patients with acute complications such as diabetic ketoacidosis or hyperosmolar coma, severe hepatic or renal impairment, acute infection, or other severe stress states were included in the studies; Patients with conditions that may affect the endpoint (e.g., anemia, recent massive blood transfusion or blood loss, pregnancy, etc.); Duplication of publications; Without primary data or consistent endpoints that cannot be merged; Without full text; Unrelated to research topics and animal experiments; case report, letter, review, conference abstract, protocol; Non-English reporting.
Endpoints
The primary endpoints were HbA1c and TIR. Secondary endpoints included TBR, TAR, mean glucose, and GV (SD and CV). TIR in these studies was all defined as the percentage of time spent in the recommended glucose control target range (3.9–10.0 mmol/L). TBR level 1 and TBR level 2 were defined as the percentage of time spent below the glucose 3.9 mmol/L and 3.0 mmol/L, respectively. TAR level 1 and TAR level 2 were defined as the percentage of time spent above glucose 10.0 mmol/L and 13.9 mmol/L, respectively.
Data extraction
All search results from the databases were downloaded into EndNote X9 (Clarivate Analytics, London, United Kingdom), and duplicates were removed. Full texts of all included studies were then assessed, and co-authors were contacted for additional information if needed. Data extraction was conducted by two co-authors (D.R.C. and B.S.L.), who independently screened the literature according to the inclusion and exclusion criteria. For each eligible article, study characteristics (e.g., title, study sign, first author, year of publication, intervention group, control group), participant information (e.g., age, the total number of subjects, duration of diabetes, follow-up time), and outcome measures (e.g., HbA1c, TIR, TAR, TBR, mean glucose, SD, CV) were extracted. All extracted data were confirmed by three principal investigators (W.X., D.Z.Y., and J.H.Y.), who also resolved conflicts.
Data analysis
A pooled analysis of means was performed for continuous variables. Heterogeneity was tested using Chi-square test and quantified by calculating I 2 statistic. We considered there was substantial heterogeneity when p < 0.1 and I 2 > 50%, and the random-effects model was used, otherwise, the fixed-effects model was used. The standard mean difference (SMD) was used as the effect indicator for continuous variables and the effect size range was expressed by 95% confidence interval (CI). Statistical analysis was performed using RevMan software version 5.4 (The Cochrane Collaboration, Copenhagen, Denmark) and Stata version 15.1 (Stata Corp LP, College Station, TX). Statistical significance was defined as two-tailed p < 0.05.
Quality assessment and publication bias
The Cochrane Collaboration risk of bias tool was used to evaluate the quality of randomized controlled trials (RCTs). 12 The following domains make up this tool: (1) detection selection bias and other biases, (2) allocation of arms, (3) participant and investigator blinding, (4) assessment of outcomes and their blinding, and (5) randomization of the population. The possibility of bias in judgment can be a high, low, or ambiguous risk of bias. The Newcastle-Ottawa Quality Assessment Scale (NOS) was used for quality evaluation of observational trials. 13 The total score of the NOS is nine points, zero to three points indicate low quality, four to six points indicate moderate quality, and seven to nine points indicate high quality. The observational trials with scores above five were included in this meta-analysis. Sensitivity analysis was performed by removing studies one by one to assess the robustness of the summary estimates. Egger’s test was drawn to evaluate the publication bias risk. 14
Results
The characteristics of the included studies
A total of 1390 articles were retrieved, 714 duplicate articles were excluded, and 655 articles were further excluded due to conferences, reviews, case reports, letters, protocol, animal experiments, and unrelated research topics after reviewing the titles and abstracts of the articles. After the researchers reviewed the full texts of the remaining 21 articles, six articles 15 –20 were finally included based on the inclusion and exclusion criteria, which included three RCTs and three observational studies. The literature screening process is shown in Figure 1.
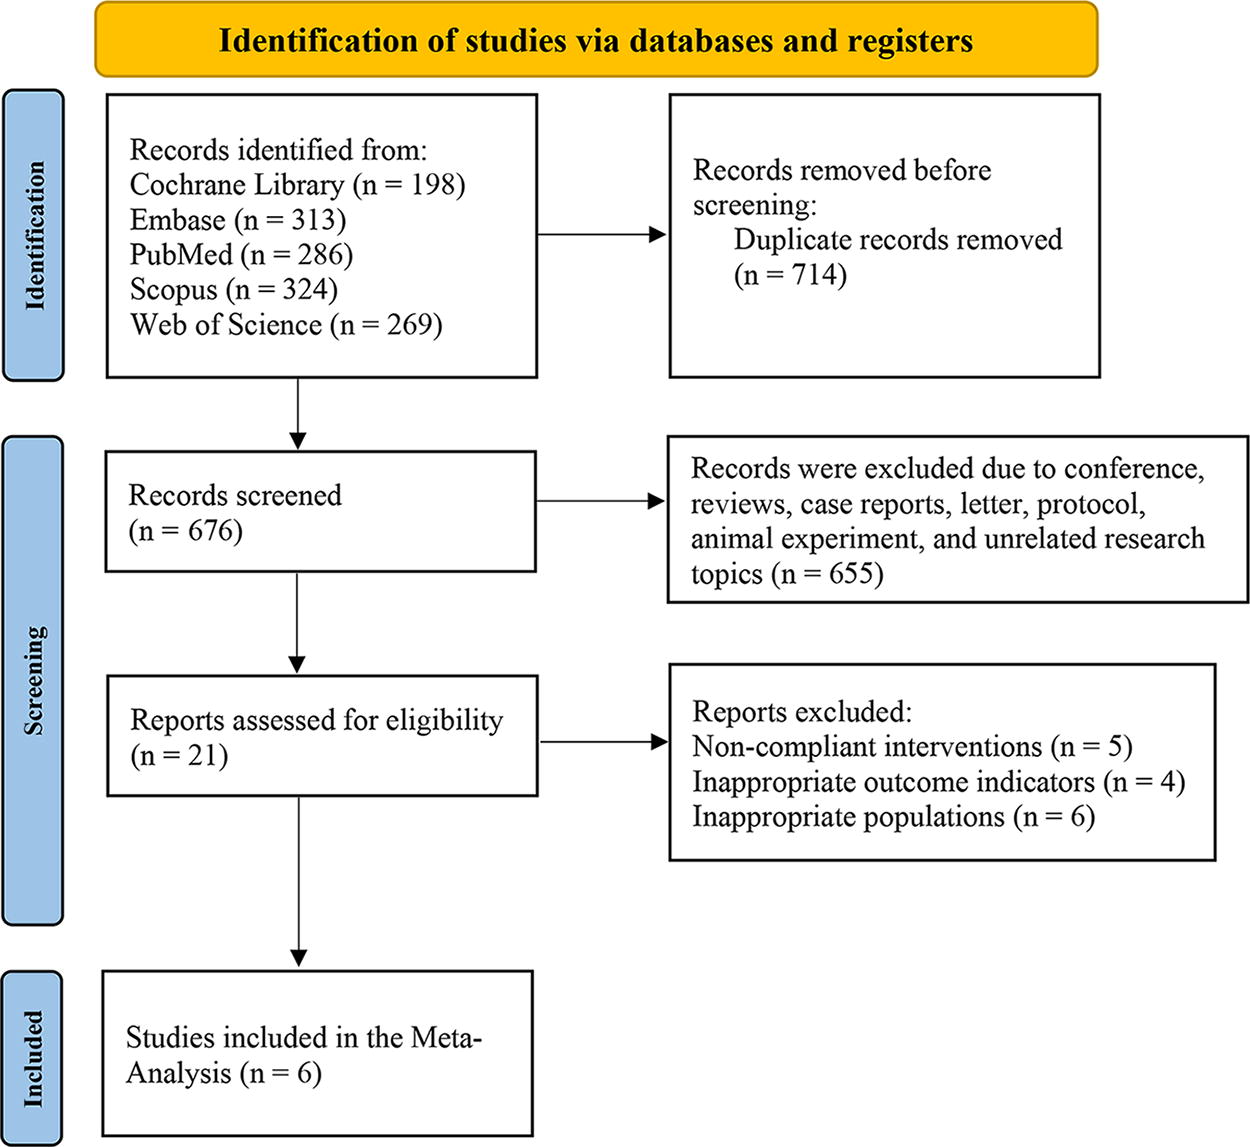
Flow diagram showing the search and screening process.
The characteristics of the included literatures are shown in Table 1. The mean age of the 1516 participants was 40.6 (10.6) years old. The intervention method was rt-CGM, and the control was FGM. Based on the Cochrane Risk-of-Bias Tool, the RCTs had a moderate risk of bias (Supplementary Fig. S1). The domain with the highest risk of bias was blinding of participants and outcome assessment, while most studies have a low risk of bias regarding random sequence generation, selective reporting, and incomplete data domains.
Characteristics of Included Studies
FGM, flash glucose monitoring; isCGM, intermittently scanned continuous glucose monitoring; RCT, randomized controlled trial; rt‐CGM, real‐time continuous glucose monitoring.
Three observational studies were included. All three studies explained how confounding factors were handled. In Lee’s study, 17 they compared TIR across groups stratified by gender, age (≤30 vs. >30 years), Multiple Deprivation Index (1–5 vs. 6–10), and insulin delivery modality (CSII vs. MDI). In Brown’s study, 18 participants initiating an rt-CGM device were matched 1:1 to participants initiating an FGM device by using propensity score matching. The propensity score, representing the odds of participants’ receiving rt-CGM, was estimated with a logistic regression model. Participants were matched using a greedy nearest neighbor process without replacement, within a caliper width equal to 0.2 of the SD of the logit of the propensity score. In Radovnická’s study, 19 they demonstrated a significant difference (p < 0.05) in mean change from baseline of HbA1c with an SD of 0.92 at 90% power and at 80% power for secondary endpoints. They used a repeated-measures analysis of variance procedure to compare the change in HbA1c, minimizing the impact of between-subject variability. The NOS score of the three observational studies was above five (Supplementary Table S1). In other words, all studies included in this meta-analysis were based on moderate- to high-quality evidence.
Outcomes from meta-analysis
Efficacy was assessed by HbA1c, TIR, TBR, TAR, SD, CV, and mean glucose. Random-effects models were used for analysis due to heterogeneity in the studies regarding HbA1c, TIR, TAR, TBR, SD, and CV. A fixed-effects model was used to analyze mean glucose.
Primary and secondary outcomes were assessed. Primary outcomes included HbA1c and TIR. HbA1c was investigated in five included studies, and TIR in six included studies. Secondary outcomes were TBR, TAR, mean glucose, and other GV indexes analyzed in these studies, including SD and CV. TBR and TAR were reported in five studies; SD was reported in three studies; mean glucose and CV were reported in four studies.
Primary outcomes
HbA1c (%)
Five studies were involved (n = 1456). 15 –19 There was no significant difference in HbA1c between rt-CGM and FGM (SMD = −0.06, 95% CI: −0.62 ∼ 0.51, p = 0.84), with high heterogeneity (I 2 = 95%, p < 0.001), but no publication bias (Egger’s test, p = 0.30, Fig. 2).
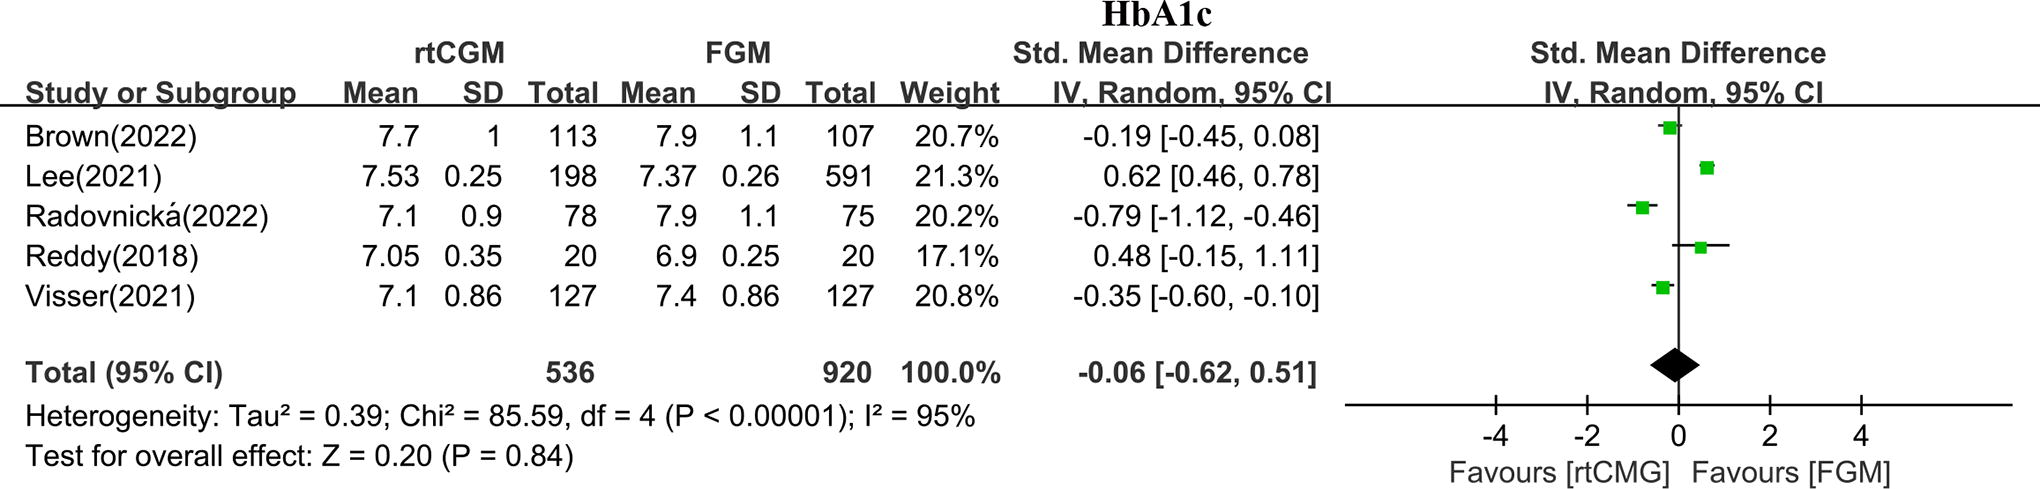
Forest plot of meta-analysis for HbA1c by rt-CGM and FGM. HbA1c, glycated hemoglobin. FGM, flash glucose monitoring; rt-CGM, real-time continuous glucose monitoring.
TIR (%, 3.9–10 mmol/L)
Six studies were involved (n = 1516). 15 –20 Compared with FGM, rt-CGM demonstrated a favorable effect on TIR (SMD = 0.59, 95% CI: 0.37 ∼ 0.81, p < 0.001), with high heterogeneity (I 2 = 68%, p = 0.007), but no publication bias (Egger’s test, p = 0.77, Fig. 3).
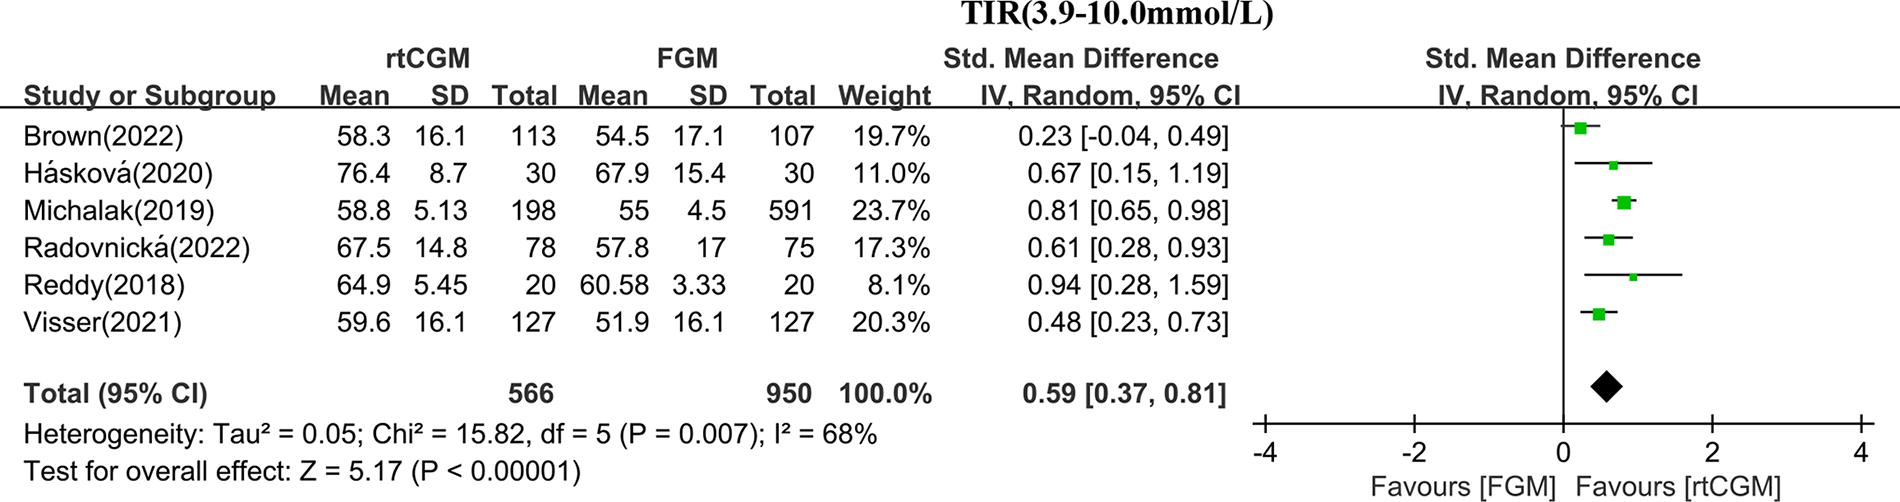
Forest plot of meta-analysis for TIR (3.9–10.0 mmol/L) by rt-CGM and FGM. FGM, flash glucose monitoring; rt-CGM, real-time continuous glucose monitoring; TIR, time in range.
Secondary outcomes
TBR level 1 (%, <3.9 mmol/L)
Five studies were involved (n = 1154). 15,17 –20 The rt-CGM led to significantly greater TBR (<3.9 mmol/L) reduction than FGM (SMD = −1.45, 95%CI: −2.33 ∼ −0.57, p = 0.001), with high heterogeneity (I 2 = 96%, p < 0.001), but no publication bias (Egger’s test, p = 0.58, Fig. 4A).
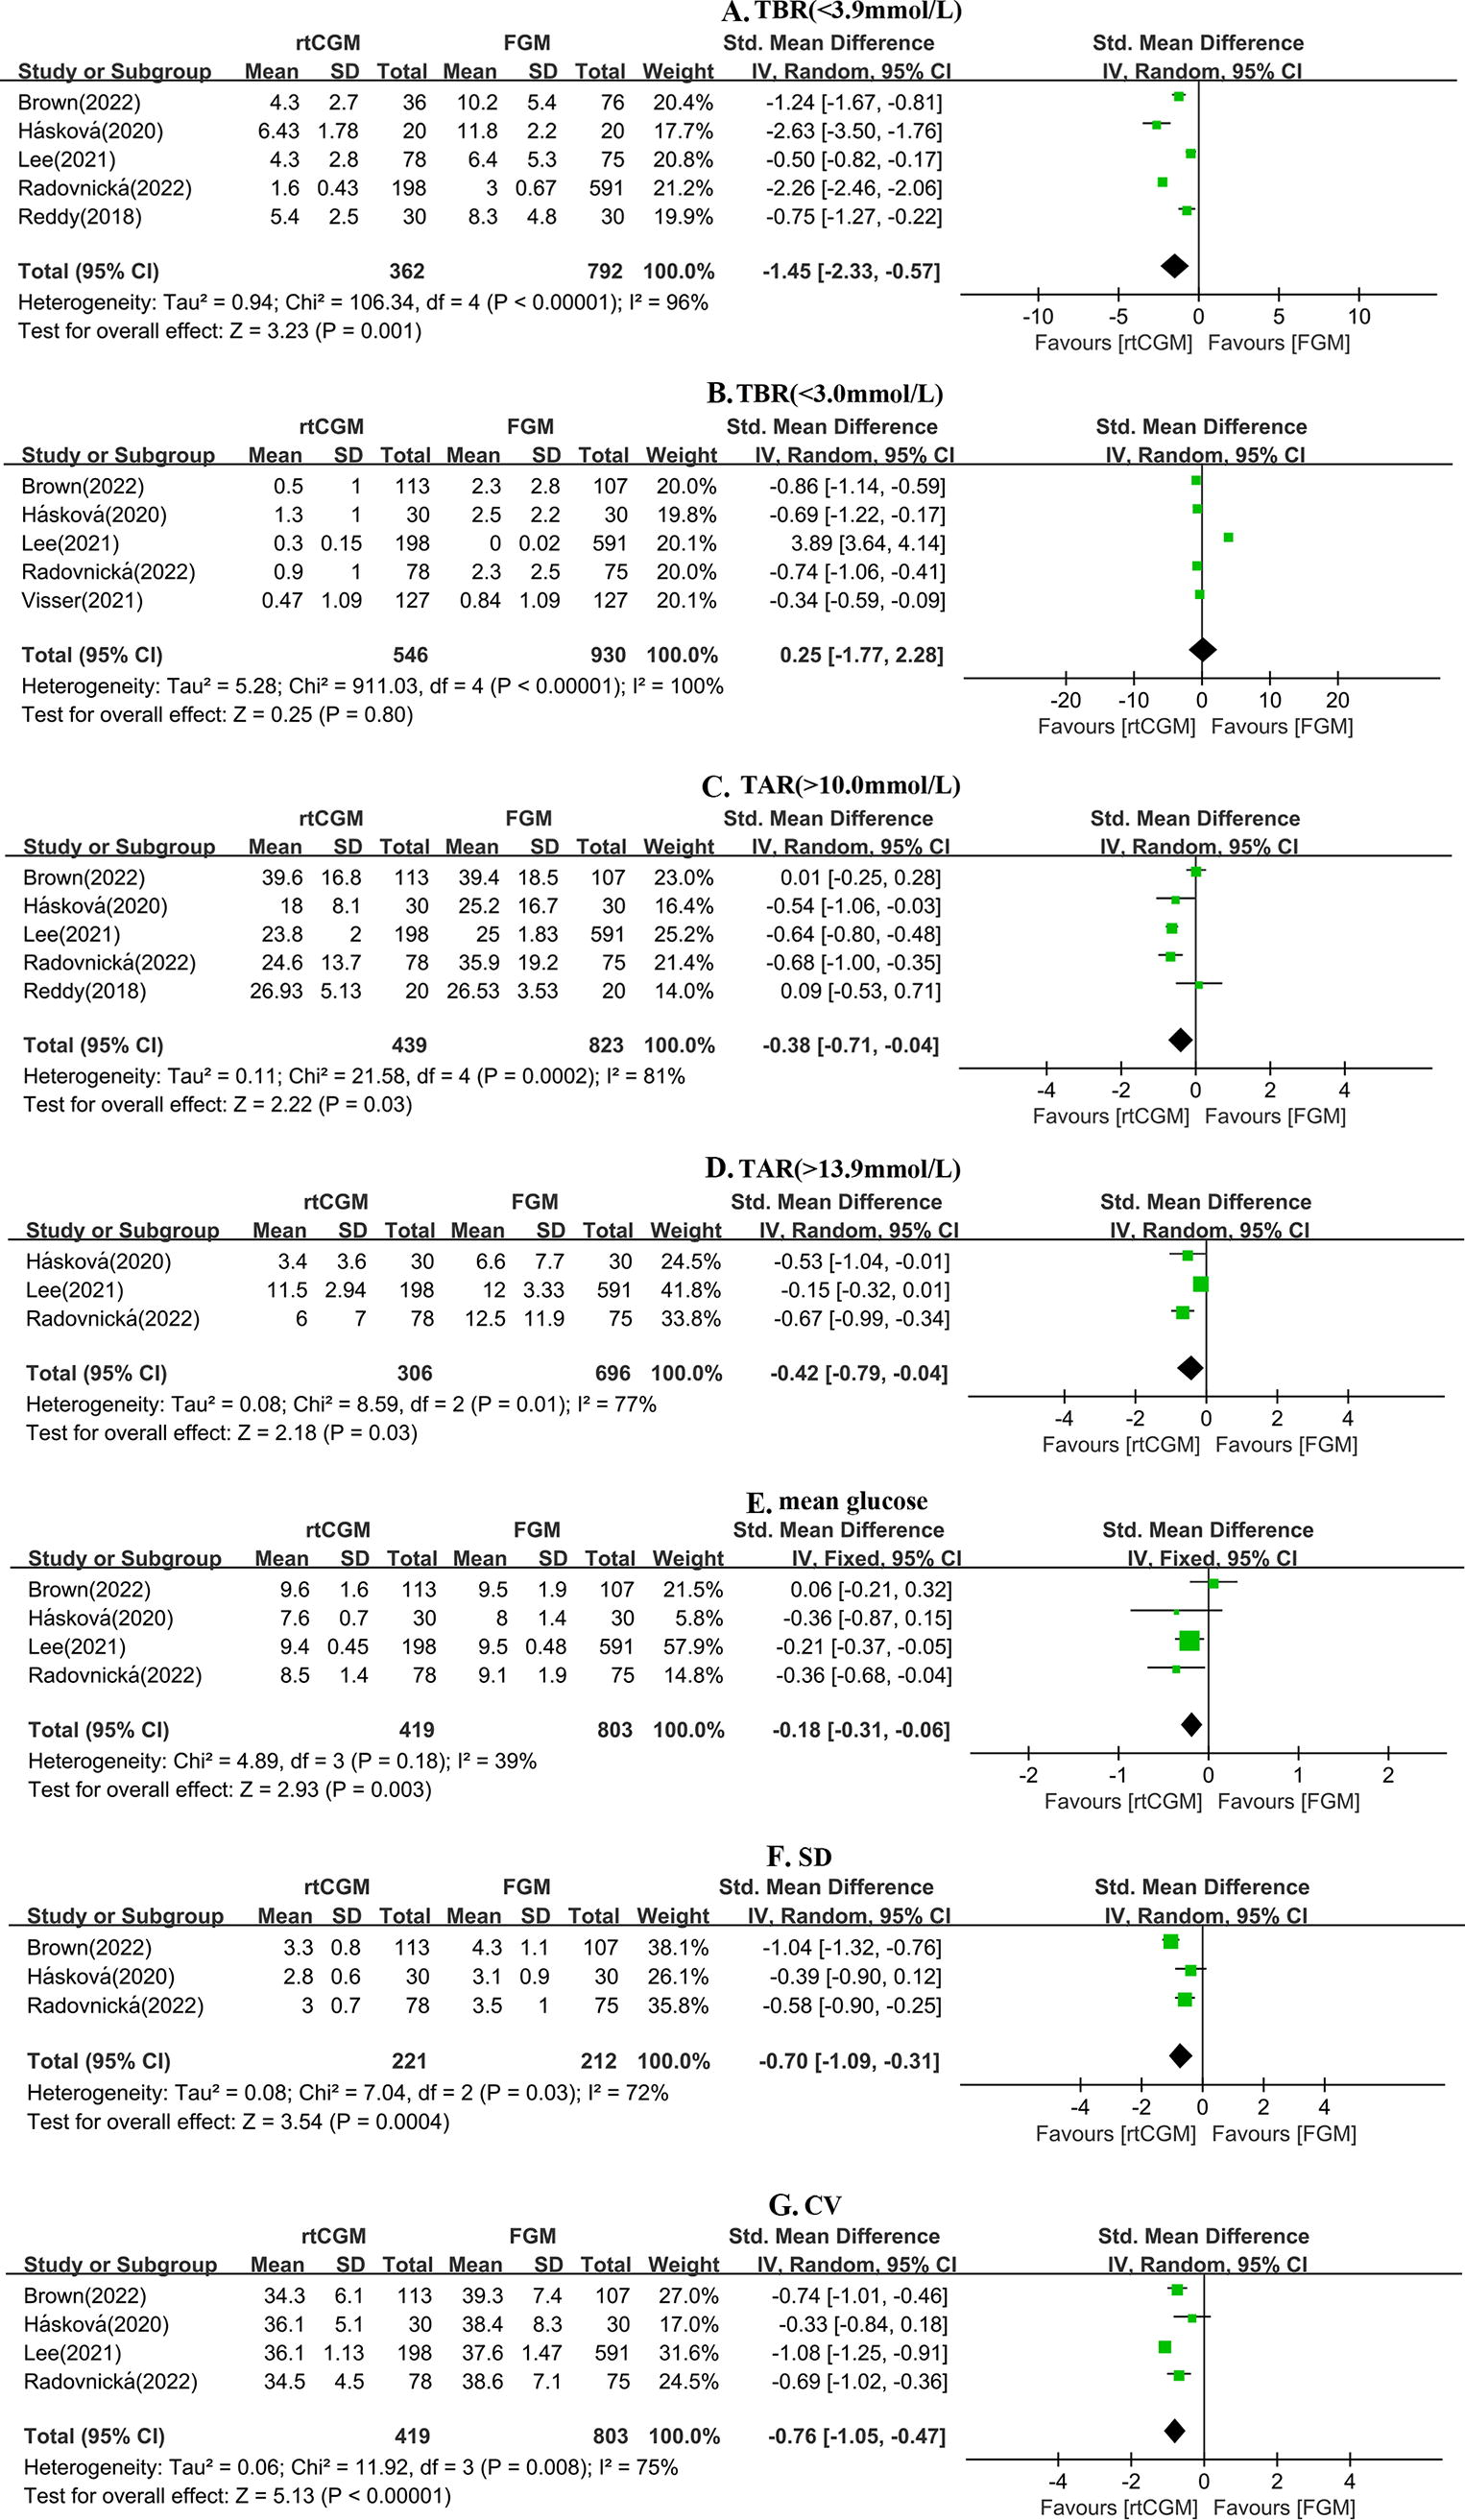
Forest plot of meta-analysis for secondary glycemic outcomes by rt-CGM and FGM.
TBR level 2 (%, <3.0 mmol/L)
Five studies were involved (n = 1476). 16 –20 No difference in TBR (<3.0 mmol/L) reduction was identified between rt-CGM and FGM groups (SMD = 0.25, 95% CI: −1.77 ∼ 2.28, p = 0.80), with high heterogeneity (I 2 = 100%, p < 0.001), but no publication bias (Egger’s test, p = 0.57, Fig. 4B).
TAR level 1 (%, >10.0 mmol/L)
Five studies were involved (n = 1262). 15,17 –20 TAR (>10.0 mmol/L) in the rt-CGM group was lower compared with the FGM group (SMD = −0.38, 95% CI: −0.71 ∼ −0.04, p = 0.03), with high heterogeneity (I 2 = 81%, p < 0.001), but no publication bias (Egger’s test, p = 0.49, Fig. 4C).
TAR level 2 (%, >13.9 mmol/L)
Three studies were involved (n = 1002). 17,19,20 TAR (>13.9 mmol/L) in the rt-CGM group was lower compared with the FGM group (SMD = −0.42, 95% CI: −0.79 ∼ −0.04, p = 0.03), with high heterogeneity (I 2 = 77%, p = 0.01), but no publication bias (Egger’s test, p = 0.34, Fig. 4D).
Mean glucose (mmol/L)
Four studies were involved (n = 1222). 17 –20 The rt-CGM led to greater improvement of mean glucose than FGM (SMD = −0.18, 95% CI: −0.31 ∼ −0.06, p = 0.003), with low heterogeneity (I 2 = 39%, p = 0.18) and no publication bias (Egger’s test, p = 0.82, Fig. 4E).
SD (mmol/L)
Three studies were involved (n = 433). 18 –20 SD in the rt-CGM group was lower compared with the FGM group (SMD = −0.70, 95% CI: −1.09 ∼ −0.31, p < 0.001), with high heterogeneity (I 2 = 72%, p = 0.03), but no publication bias (Egger’s test, p = 0.42, Fig. 4F).
CV (%)
Four studies were involved (n = 1222). 17 –20 CV in the rt-CGM group was lower compared with the FGM group (SMD = −0.76, 95% CI: −1.05 ∼ −0.47, p < 0.001), with high heterogeneity (I 2 = 75%, p = 0.008) and publication bias (Egger’s test, p = 0.02, Fig. 4G).
Discussion
Glucose monitoring is regarded as a fundamental component of T1DM management. Different CGM devices have been widely used for glycemic control and diabetes daily care in recent years. With the CGM applications, a great abundance of glycemic data can be acquired, contributing to the observation of glycemic control. Several CGM metrics, including TIR, TBR, TAR, SD, CV, and MAGE, have been introduced in clinical applications. Compared with HbA1c, key CGM metrics reflect relatively short-term but more comprehensive information on glycemic control, taking into account both intraday and interday variability. As the effects of various types of CGM vary, it is highly necessary to conduct our study to directly compare the effect of glycemic control, providing important evidence for personalized management.
This is the first meta-analysis to head-to-head compare the effect of rt-CGM and FGM on glycemic control in adults with T1DM. Our analysis showed that rt-CGM helped adults with T1DM achieve better glycemic control, including TIR, TBR level 1 (<3.9 mmol/L), TAR, mean glucose, and decreased GV (SD and CV) than FGM. However, there was no statistically significant difference in HbA1c and TBR level 2 (<3.0 mmol/L) between the two groups.
TIR is considered the most valuable metric to assess glycemic control among the CGM metrics. Many studies have already proved that higher TIR was significantly associated with a reduced risk of both microvascular and macrovascular complications. 21 TIR has been recommended in guidelines since 2020 as an important index in diabetes management. 22,23 According to the recent guidelines, 22,23 TIR greater than 70% is recommended as the target for patients with T1DM and T2DM. Maintaining a higher TIR indicates better glycemic control, which potentially minimizes the risk of diabetic complications. 24 Compared with FGM, improvements were found in the rt-CGM group of TIR, TBR level 1 (<3.9 mmol/L), TAR (level 1 and level 2), mean glucose, SD, and CV in our study, indicating a better glycemic control in users of rt-CGM.
The effects of rt-CGM in glycemic control surpass that of the FGM, owing to its ability to deliver real-time glucose readings at five-minute intervals, augmented by customizable alerts for high and low glucose levels. The rt-CGM enables users to make rapid adjustments to prevent the occurrence of hyperglycemia or hypoglycemia. 8 Unlike the first- and second-generation FGM, which require manual sensor scans to acquire glucose readings, rt-CGM automates data recording and transmission, thereby reducing the user’s burden of engagement, especially during nighttime or active periods. 9
There was no statistically significant difference in HbA1c control between the two groups. It is well known that HbA1c has been considered the gold indicator for assessing long-term glucose control in diabetes. A previous meta-analysis conducted by Maiorino showed a 0.17% reduction of HbA1c with CGM compared to SMBG. 11 However, HbA1c reflects the average blood glucose levels over the past two to three months and is unable to reflect intraday and interday GV. Thus, the difference in duration of wearing CGM (intervention time) can lead to different study outcomes. In the six studies with HbA1c reduction as the primary endpoint included in our analysis, the intervention durations ranged from 6 to 14 days, and the follow-up durations varied from four weeks to one year. This variability in intervention and follow-up durations may explain the different outcomes of these studies.
In terms of adverse reactions, seven minor skin reactions in FGM and five in rt-CGM were reported by Radovnicka. 19 Similarly, Visser found that CGM-related adverse skin reactions were more frequently observed with FGM. 16 Overall, the number of individuals experiencing skin adverse reactions in the rt-CGM group is fewer compared to the FGM group.
This is the first meta-analysis directly comparing rt-CGM and FGM on glycemic control in adults with T1DM. Apart from the CV, there is no publication bias in other outcomes, which increases the reliability of our research findings. However, some limitations of this study should be addressed. First, the intervention period, comparator, study design, and setting varied among studies, which may cause clinical heterogeneity. Second, the progressive technological advances in CGMs across the extensive periods in which the three RCTs and three observational studies were conducted could represent an additional potential confounding factor. Of note, these findings only focus on the comparisons between first-generation FGM devices. This potentially means that standalone FGM in all forms will have diminished clinical relevance in the future, thereby reducing the importance of conducting further head-to-head trials. The impact of this technological development on our research findings remains uncertain.
Conclusion
The available evidence supports that rt-CGM leads to favorable outcomes in improving several key CGM metrics among adults with T1DM, including TIR, TBR (<3.9 mmol/L), TAR (>10.0 mmol/L and 13.9 mmol/L), mean glucose, SD, and CV. However, there is no significant difference in HbA1c and TBR (<3.0 mmol/L) between rt-CGM and FGM. Based on these findings, we conclude that CGM is preferred over FGM in the management of T1DM.
Footnotes
Authors’ Contributions
D.C. and B.L. designed the study, screened the title and abstract, and participated in data extraction, statistical analysis, and draft of the article. Z.L. and M.L. designed the study, performed the statistical analysis, and reviewed the article. Y.Y. and B.Y. were involved in data analysis and revised the article. W.X., D.Y., and J.Y. were responsible for the overall supervision, conducted the quality appraisal, and reviewed the article. All the authors critically revised the article and agreed to be accountable for all aspects of the work.
Author Disclosure Statement
No conflicting financial interests exist.
Funding Information
This study was supported by diabetes mellitus research fund program from
Supplementary Material
Supplementary Figure S1
Supplementary Table S1
References
Supplementary Material
Please find the following supplemental material available below.
For Open Access articles published under a Creative Commons License, all supplemental material carries the same license as the article it is associated with.
For non-Open Access articles published, all supplemental material carries a non-exclusive license, and permission requests for re-use of supplemental material or any part of supplemental material shall be sent directly to the copyright owner as specified in the copyright notice associated with the article.