
Abstract
Traumatic brain injury (TBI) is responsible for up to 45% of in-hospital trauma mortality. Computed tomography (CT) is central to acute TBI diagnostics, and millions of brain CT scans are conducted yearly worldwide. Though many studies have addressed individual predictors of outcome from findings on CT scans, few have done so from a multivariate perspective. As these parameters are interrelated in a complex manner, there is a need for a better understanding of them in this context. CT scans from 861 TBI patients were reviewed according to an extensive protocol. An extended analysis of CT parameters with respect to outcome was performed using linear and non-linear methods. We identified complex interactions and mutual information in many of the parameters. Variables predicting death differ from those predicting unfavorable versus favorable outcomes (Glasgow Outcome Scale scores of 1–3 versus 4–5 [GOS]). The most important parameter for prediction of unfavorable outcome is the magnitude of midline shift. In fact, this parameter, as a continuous variable, is by itself a better predictor and is better calibrated than the Marshall CT score, even for predicting death. In addition, hematoma volumes are nearly co-linear with midline shift and can be substituted for it. A score of traumatic subarachnoid/intraventricular blood components adds substantially to model calibration. A CT scoring system geared toward dichotomous GOS scores is suggested. CT parameters were found to add 6–10% additional estimated explained variance in the presence of the important clinical variables of age, Glasgow Coma Scale score, and pupillary response. Finally we present a practical clinical “rule of thumb” to help predict the probability of unfavorable outcome using clinical and CT variables.
Introduction
T
Despite this, CT scoring systems have been suggested to aid interpretation and prognostication of TBI. The dominant scoring system, and that with which all others are compared, is that of Marshall (Marshall et al., 1991). The Marshall score, devised to categorize the severity of CT findings related to mortality, has a limited capacity to predict outcome, with an area under the curve (AUC) of receiver operating curves (ROC) reported as 0.67 (Maas et al., 2005). An enhanced Rotterdam score (Maas et al., 2005) re-weights the Marshall score variables and adds additional information from CT scans such as the presence of traumatic subarachnoid hemorrhage, strengthening predictions (AUC of 0.77) of survival. The IMPACT study (Maas et al., 2007) also addressed multivariable information on CT scans pertaining to a dichotomized and ordinal Glasgow Outcome Scale (GOS) (Jennett and Bond, 1975). It uses CT variables available from several large databases comprising the IMPACT database, mostly from large clinical pharmaceutical TBI trials.
The interpretation of CT scans often involves much additional pathology that is recognized and commented on by radiologists, but it is unclear how this information is related to outcome. A subjective grading scale of “overall appearance” has been found to be a strong predictor of outcome (Wardlaw et al., 2002) suggesting that there may be additional “weighted” information in CT scans that can be recognized clinically, but may not be incorporated into current scoring systems. Parameters identified on CT are highly interrelated in a complex way, and a need to further investigate their relationships has been identified (Murray et al., 2007; The Brain Trauma Foundation, 2000). To our knowledge only one large multivariate study with multiple CT parameters, collected with the objective of extensively examining their relationships to each other and their effects on outcome, has been done previously (Eisenberg et al., 1990).
The integrated weighted information in CT scans pertaining to outcome is expected to be multivariable, non-linear, and to have multiple interdependencies. Machine-learning methods are a group of algorithms developed in the computer sciences that are used in pattern recognition, and may have advantages (Mjolsness and DeCoste, 2001) over conventional statistical methods in identifying patterns in complex and noisy data sets. Machine-learning techniques, such as artificial neural networks and support vector machines (SVM) (Ben-Hur et al., 2008; Noble, 2006), have in common an ability for adaptive “learning,” most often through an iterative process. Many algorithms can be thought of as non-linear regression models, and several are claimed to be robust in settings with large data sets and abundant artifacts. Machine-learning methods, previously used sparingly in clinical research, may provide new tools to extract weighted non-linear information from CT scans, possibly enabling a better understanding of the information content.
The objective of this study was to analyze the multiple pathological parameters found on early CT scans of mild to severe TBI patients, and to investigate their integrated relations to GOS. To this end we created an extensive protocol for CT evaluation, and used it to review scans from a large set of TBI patients. The purpose was to generate a better understanding of the compound and individual relevance of CT findings in TBI, and to enhance scoring, CT interpretation, and outcome prediction.
Methods
The study was approved by the local ethics committee on human research at the Karolinska Institutet and the Karolinska University Hospital. No interventions were employed as part of this investigation.
Patients
The first CT scan after injury was sought from all patients in the Karolinska Brain Trauma Injury database from 1996 to 2001 (1029 patients). These were patients admitted to the neurosurgical department due to TBI, and 931 patients had retrievable CT scans, 890 of which were in individuals ≥15 years of age. If two scans were available within a 24-h period, the later scan was reviewed. Only scans taken prior to lesion evacuation were reviewed (thus no Marshall category V patients were included in the study).
CT review
The CTs were reviewed under a protocol formulated to capture parameters known to be significantly related to outcome and additional pathology (Table 1). Currently used scores (Marshall and Rotterdam) could also be computed using this protocol. The CTs were reviewed by a radiologist without access to clinical data except for age and gender. The direction of midline-shift (ML-shift) was recorded and the magnitude (in millimeters) was measured on the basal region of the septum pellucidum. Location (frontal, temporal, parietal, occipital, cerebellar, falx, left, and right) and type (epidural hemorrhage [EDH], subdural hemorrhage [SDH], and contusion [CONT]) of all extra-cerebral and superficial traumatic lesions were noted, and their volumes were estimated as (length*max-breadth*height)/2 (Gebel et al., 1998). Basal cisterns (or cisterna interpeduncularis) (COMP-bas-cist), lateral ventricles (COMP-ventr), and convexity gyri (COMP-conv) were noted as normal (0), mildly compressed (1), or highly compressed/obliterated (2), and related to age. Traumatic subarachnoid hemorrhage (SAH) or intraventricular hemorrhage (IVH) was identified as: convexities (SAH-conv), basal cisterns (SAH-bas-cist), and ventricles (IVH). SAH-conv was graded: 0 = no blood, 1 = visible in gyri, and 2 = extensive-bilateral (approximately >90% filled convexity). SAH thickness (SAH-mm) was graded (visible blood is assumed >1 mm): 0 = no blood, 1 = 1–5 mm, and 2 = > 5 mm. SAH-bas-cist was graded: 0 = no blood, 1 = visible blood, and 2 = filled cisterns. SAH-ventr was graded: 0 = no blood, or 1 = visible blood. CT visible deep traumatic lesions indicative of diffuse axonal injury (DAI) were recorded as subcortical (DAI-sub-cort), corpus callosum (DAI-corp-call), brainstem (DAI-brainstem) and basal ganglia (DAI-bas-gangl), and graded 0–1. Fractures were recorded if visible on tissue windows, or if there existed a skeletal window, as: basal skull fracture, depression fracture, or as any fracture or the presence of intracranial air. The presence of hydrocephalus, infarction, or a chronic component of SDH, or prior trauma pathology, such as old parenchymal defects, was also recorded. A second radiologist reviewed 50 CTs in order to identify ambiguities in the protocol and to detect inter-rater discrepancies.
Incidences and univariate analyses of CT variables predicting unfavorable outcome are shown. When significant (*p < 0.05), the Nagelkerke pseudo-R2 is given, estimating explained variance. Incidences are of non-zero instances. No analysis was done for extremely sparse data (n = 628, training data).
DAI, diffuse axonal injury; DAI-sub-cort, subcortical DAI; DAI-corp-call, corpus callosum DAI; DAI-brainstem, brainstem DAI; DAI-bas-gangl, basal ganglia DAI; SAH-conv, SAH convexities; SAH-bas-cist, SAH basal cisterns.
Outcome scale
The GOS is registered in the Karolinska Traumatic Brain Injury database at three time-points: at discharge, at 3–6 months, and ≥1 year after trauma. The highest score of these three time points was termed “best GOS” and used as the prediction target. Patients lacking the 3–6 month and 1-year GOS values, and with discharge GOS values of 2–4, were excluded. A dichotomized GOS (Dich-GOS), of favorable versus unfavorable (GOS 4/5 versus GOS 1/2/3) was the primary outcome measure. Death versus survival (GOS 2/3/4/5 versus GOS 1) was a secondary outcome measure.
Data preparation
All primary CT variables were recorded with no missing data. A set of secondary derived variables was formed with computed volumes, scores, and condensed regions of sparse data (Table 1). Age, GCS score, and pupillary (response, size, and size differences) data were retrieved from the Karolinska Traumatic Brain Injury database. Of these variables, only pupil responses had missing data (6%), that were statistically imputed with regression of the other explanatory variables. The patients were randomly divided according to common practice into a training set (2/3) used for variable and model selection, and a validation set (1/3) used for statistics to identify overfitting of models to our data.
Analysis
Data parameter reduction and feature selection were performed along three arms: (1) all-in and complex models, using all available CT parameters or parameters suggested by univariate analysis; (2) statistical reduction, using Akaike information criteria (AIC) and group-lasso (Meier et al., 2008) for feature selection of variables for logistic regression; and (3) prior knowledge, using prior knowledge and beliefs to condense, transform, and reduce parameters to related groups, with the goal of representing all groups in a weighted score (Table 1). Logistic regression was performed using statistical packages (Design) for the statistical software R (R Development Core Team, 2008). Data were explored for co-linearity and interactions of explanatory variables. These variables were checked for linearity on the logit scale with splines and polynomials. Adjustments for age, Glasgow Coma Scale scores (GCS), and pupils were explored. A bootstrapped (× 500) Nagelkerke's pseudo-R2 and ROC-AUC were used to evaluate model accuracy (i.e., tests of how well the models discriminate), and the Hosmer-Lemeshow-C goodness-of-fit (HL-gof ) (Hosmer et al., 1997) was used to evaluate calibration (measures of fit between predicted and observed probabilities). The tests were performed separately on training and validation data.
Support vector machine analysis
Support vector machine (SVM) analyses with radial base kernels were performed with the Kernlab and e1071 packages for the statistical software R (R Development Core Team, 2008). SVMs were optimized using a 10-fold cross-validation grid search of the training data set to find best C (cost function) and sigma (radial basis widths). A probabilistic output was produced by the method of Platt (Platt, 1999). A bootstrapped ROC-AUC was used to evaluate model accuracy.
Validation
Models were evaluated for overtraining (overfitting of models to our population) of the validation data. Comparisons with Marshall and Rotterdam scores were also performed. A bootstrapped 95% confidence interval was calculated for predicted probabilities versus true probabilities of the models.
Results
In all, 890 CT scans were reviewed according to our protocol, with no missing CT variable data. Twenty-two patients were excluded due to missing GOS scores. Fifty-five missing pupil responses (6%) were statistically imputed. Seven patients were excluded due to uncertainties in trauma time. The previously randomized groups consisted then of a 628 patient-training and a 233 patient-validation set for the full data set, and 361 and 133 for a GCS ≤ 12 subgroup, respectively. Results of univariate analysis of CT parameters and their incidences are shown in Table 1. It can be seen that the highest estimated explained variance towards Dich-GOS is for ML-shift (R2 = 0.20). Age and GCS, Marshall score and GOS distributions are shown in Figure 1, indicating a 64% incidence of severe-to-moderate TBI, a 32% unfavorable outcome, and a 9.9% mortality rate in the data set. Seventy-four percent were male.
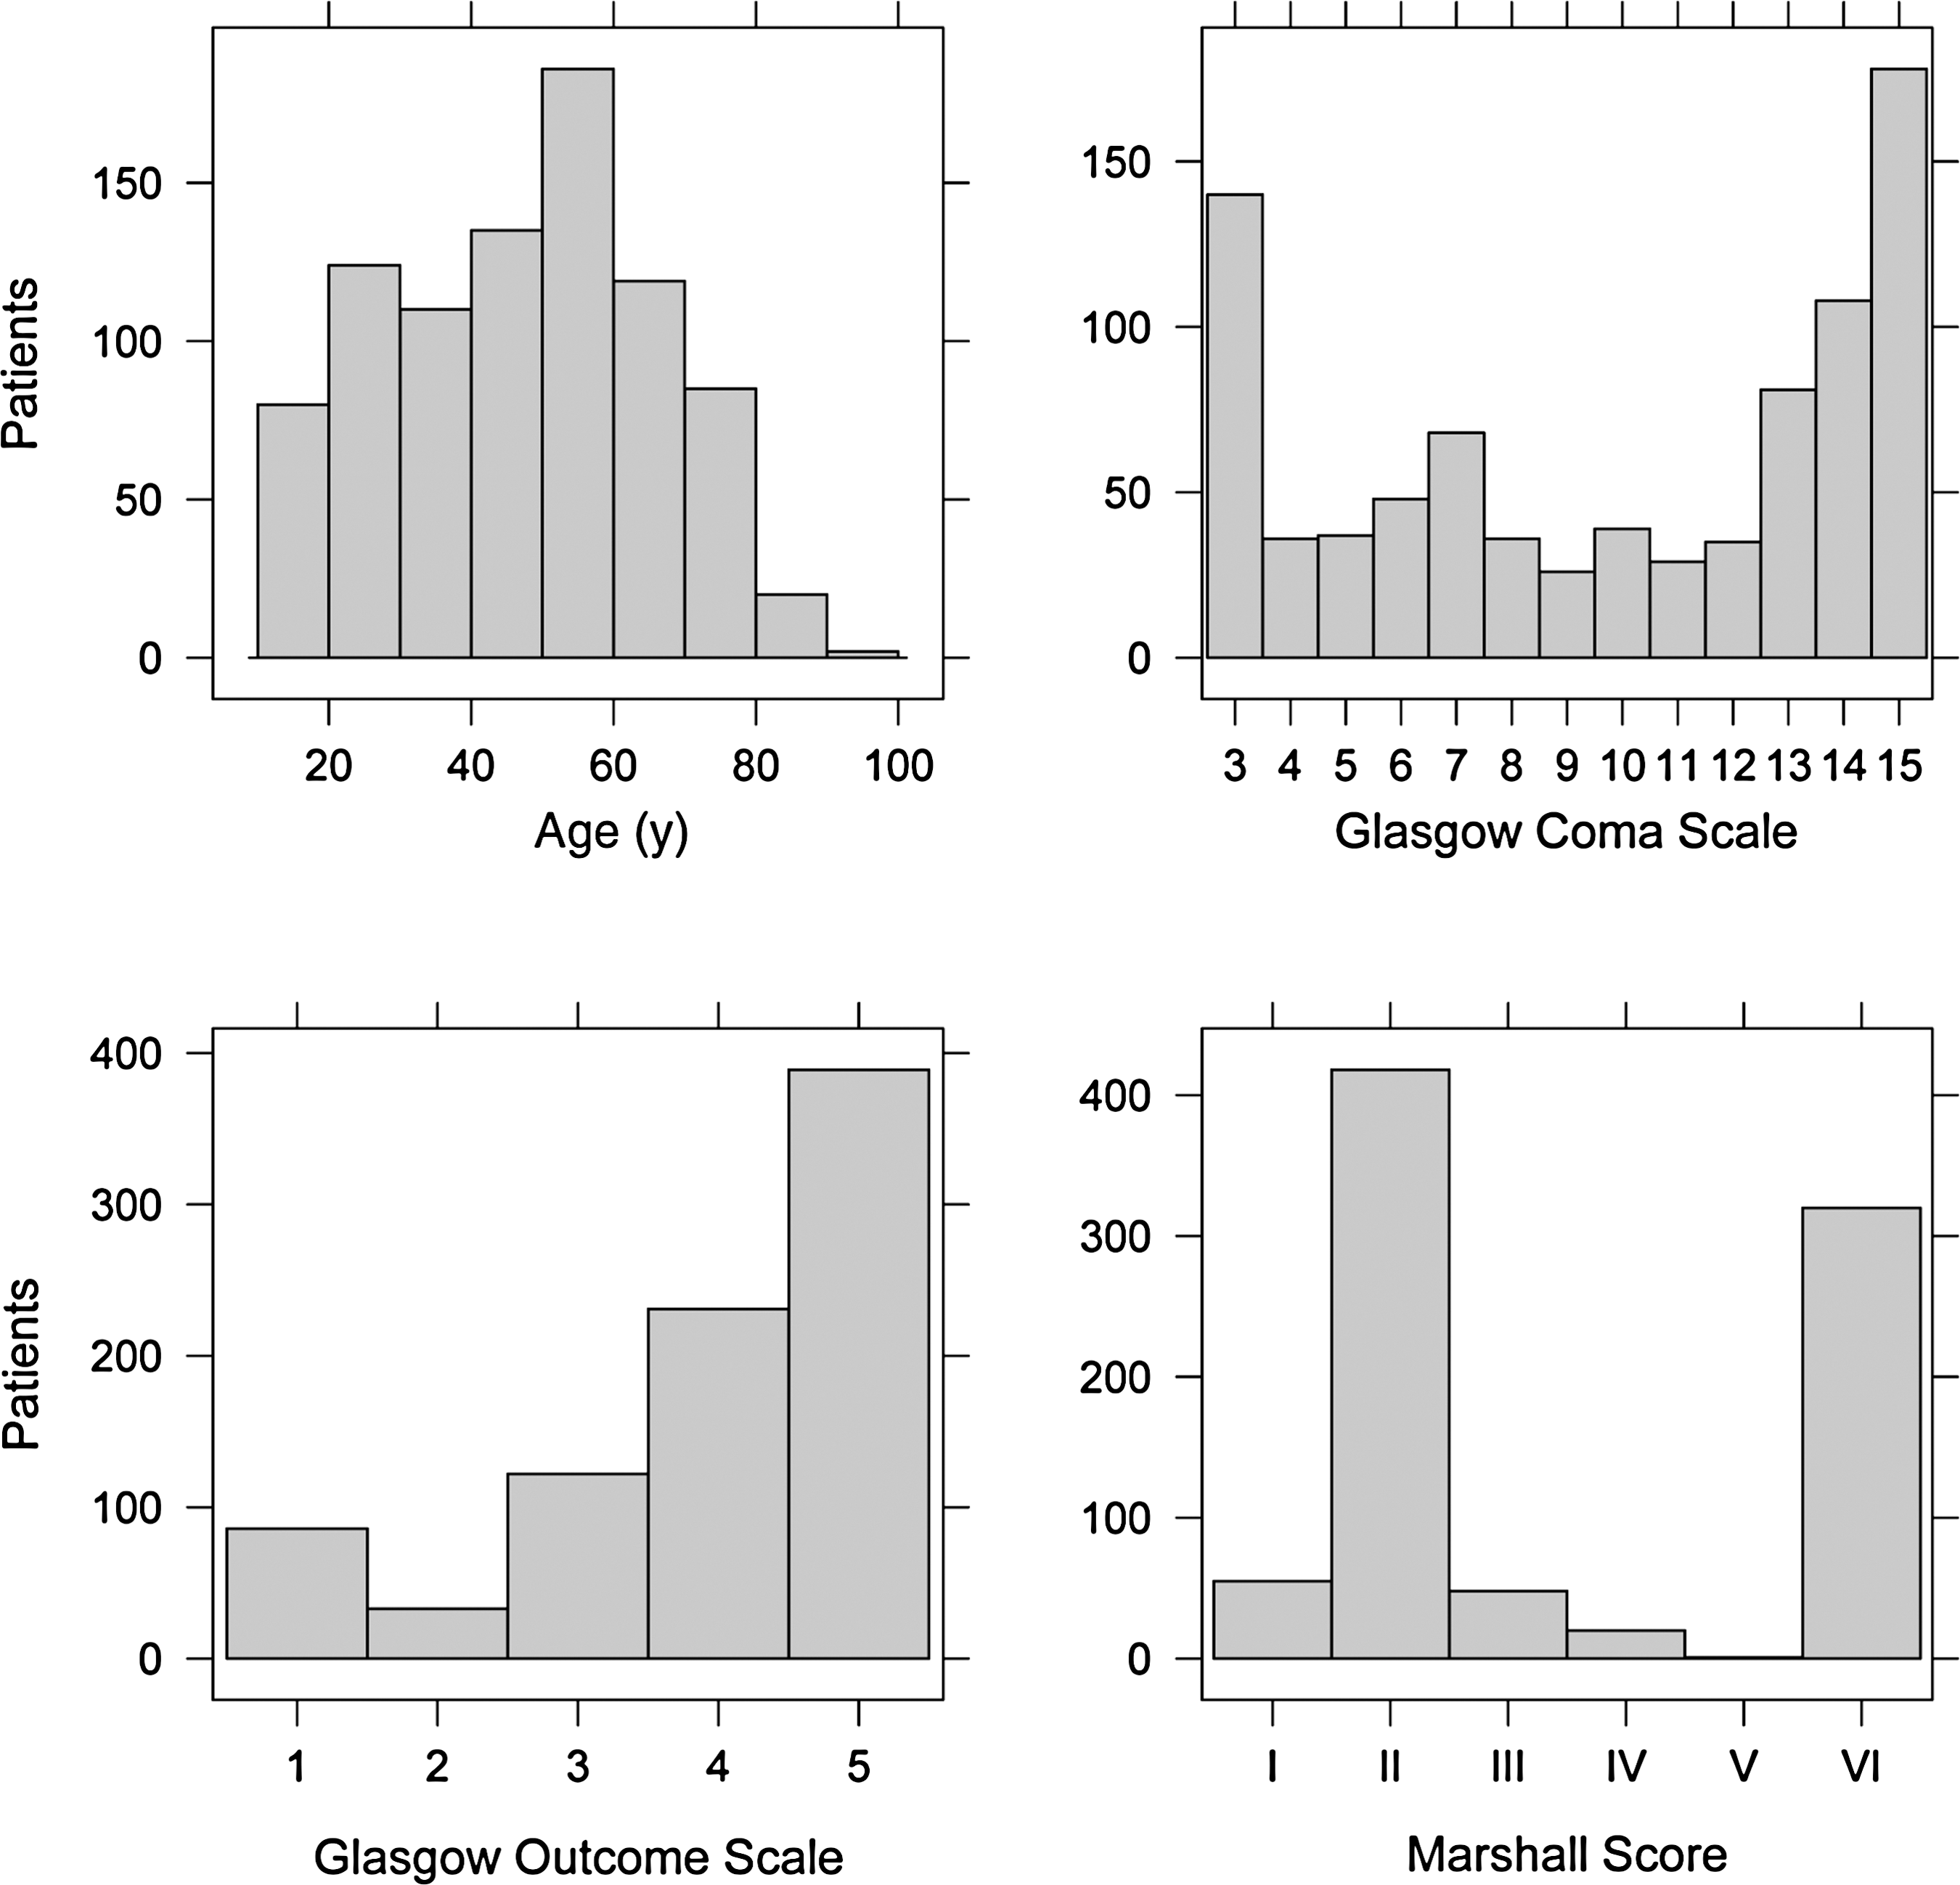
Graphs showing the distribution of age, Glasgow Coma Scale, Glasgow Outcome Scale, and Marshall CT score categories in this study's traumatic brain injury population (n = 861).
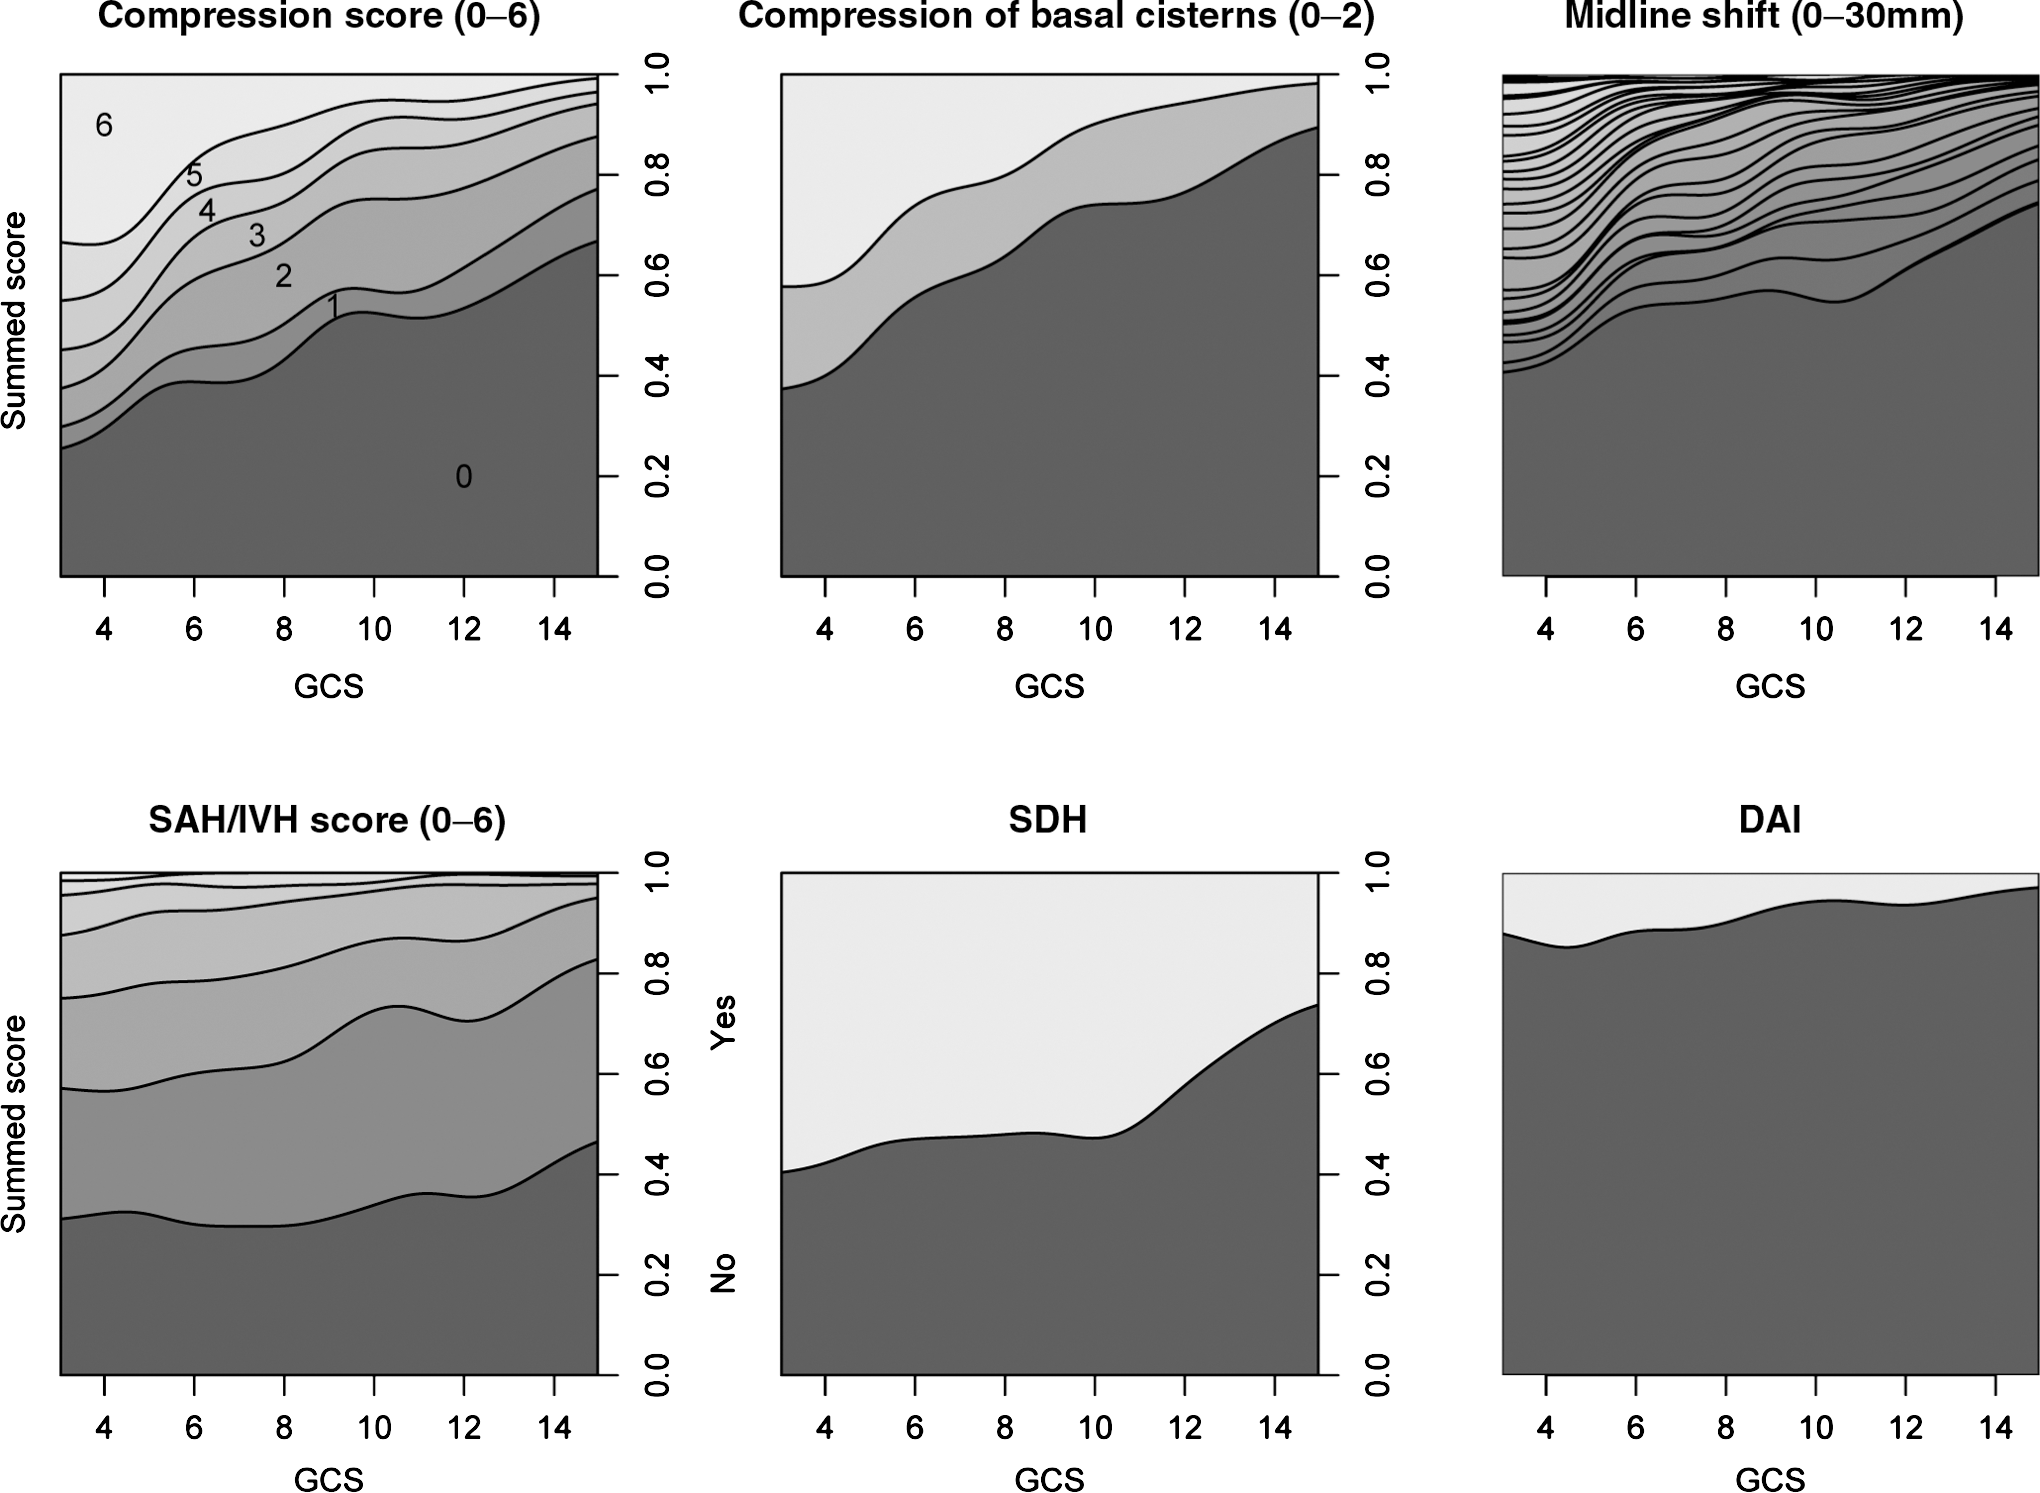
Relations of variables to GOS scores are shown in Figure 2, indicating that ML-shift, SAH/IVH, and compression parameters were strongly related to outcome. A summed score of compression parameters gives a smoother discriminative function than COMP-bas-cist alone, but does not reach higher levels of unfavorable outcome or death, indicating that these variables are highly interrelated. This is confirmed in a correlation matrix, in which compression variables and ML-shift were seen to be highly inter-correlated (0.72–0.83) (data not shown). The summed score of SAH/IVH also exhibits a smooth and near linear behavior for Dich-GOS (Fig. 2). In a logistic regression including the SAH/IVH variables (SAH-conv, SAH-bas-cist, SAH-mm, and IVH) as predictors of Dich-GOS, the SAH-mm component is found to be non-significant. The summed SAH/IVH-score (Table 1) retains double the estimated explained variance, compared with a SAH thickness grading, per the Fisher (Fisher et al., 1980) or Greene (Greene et al., 1995) scores.
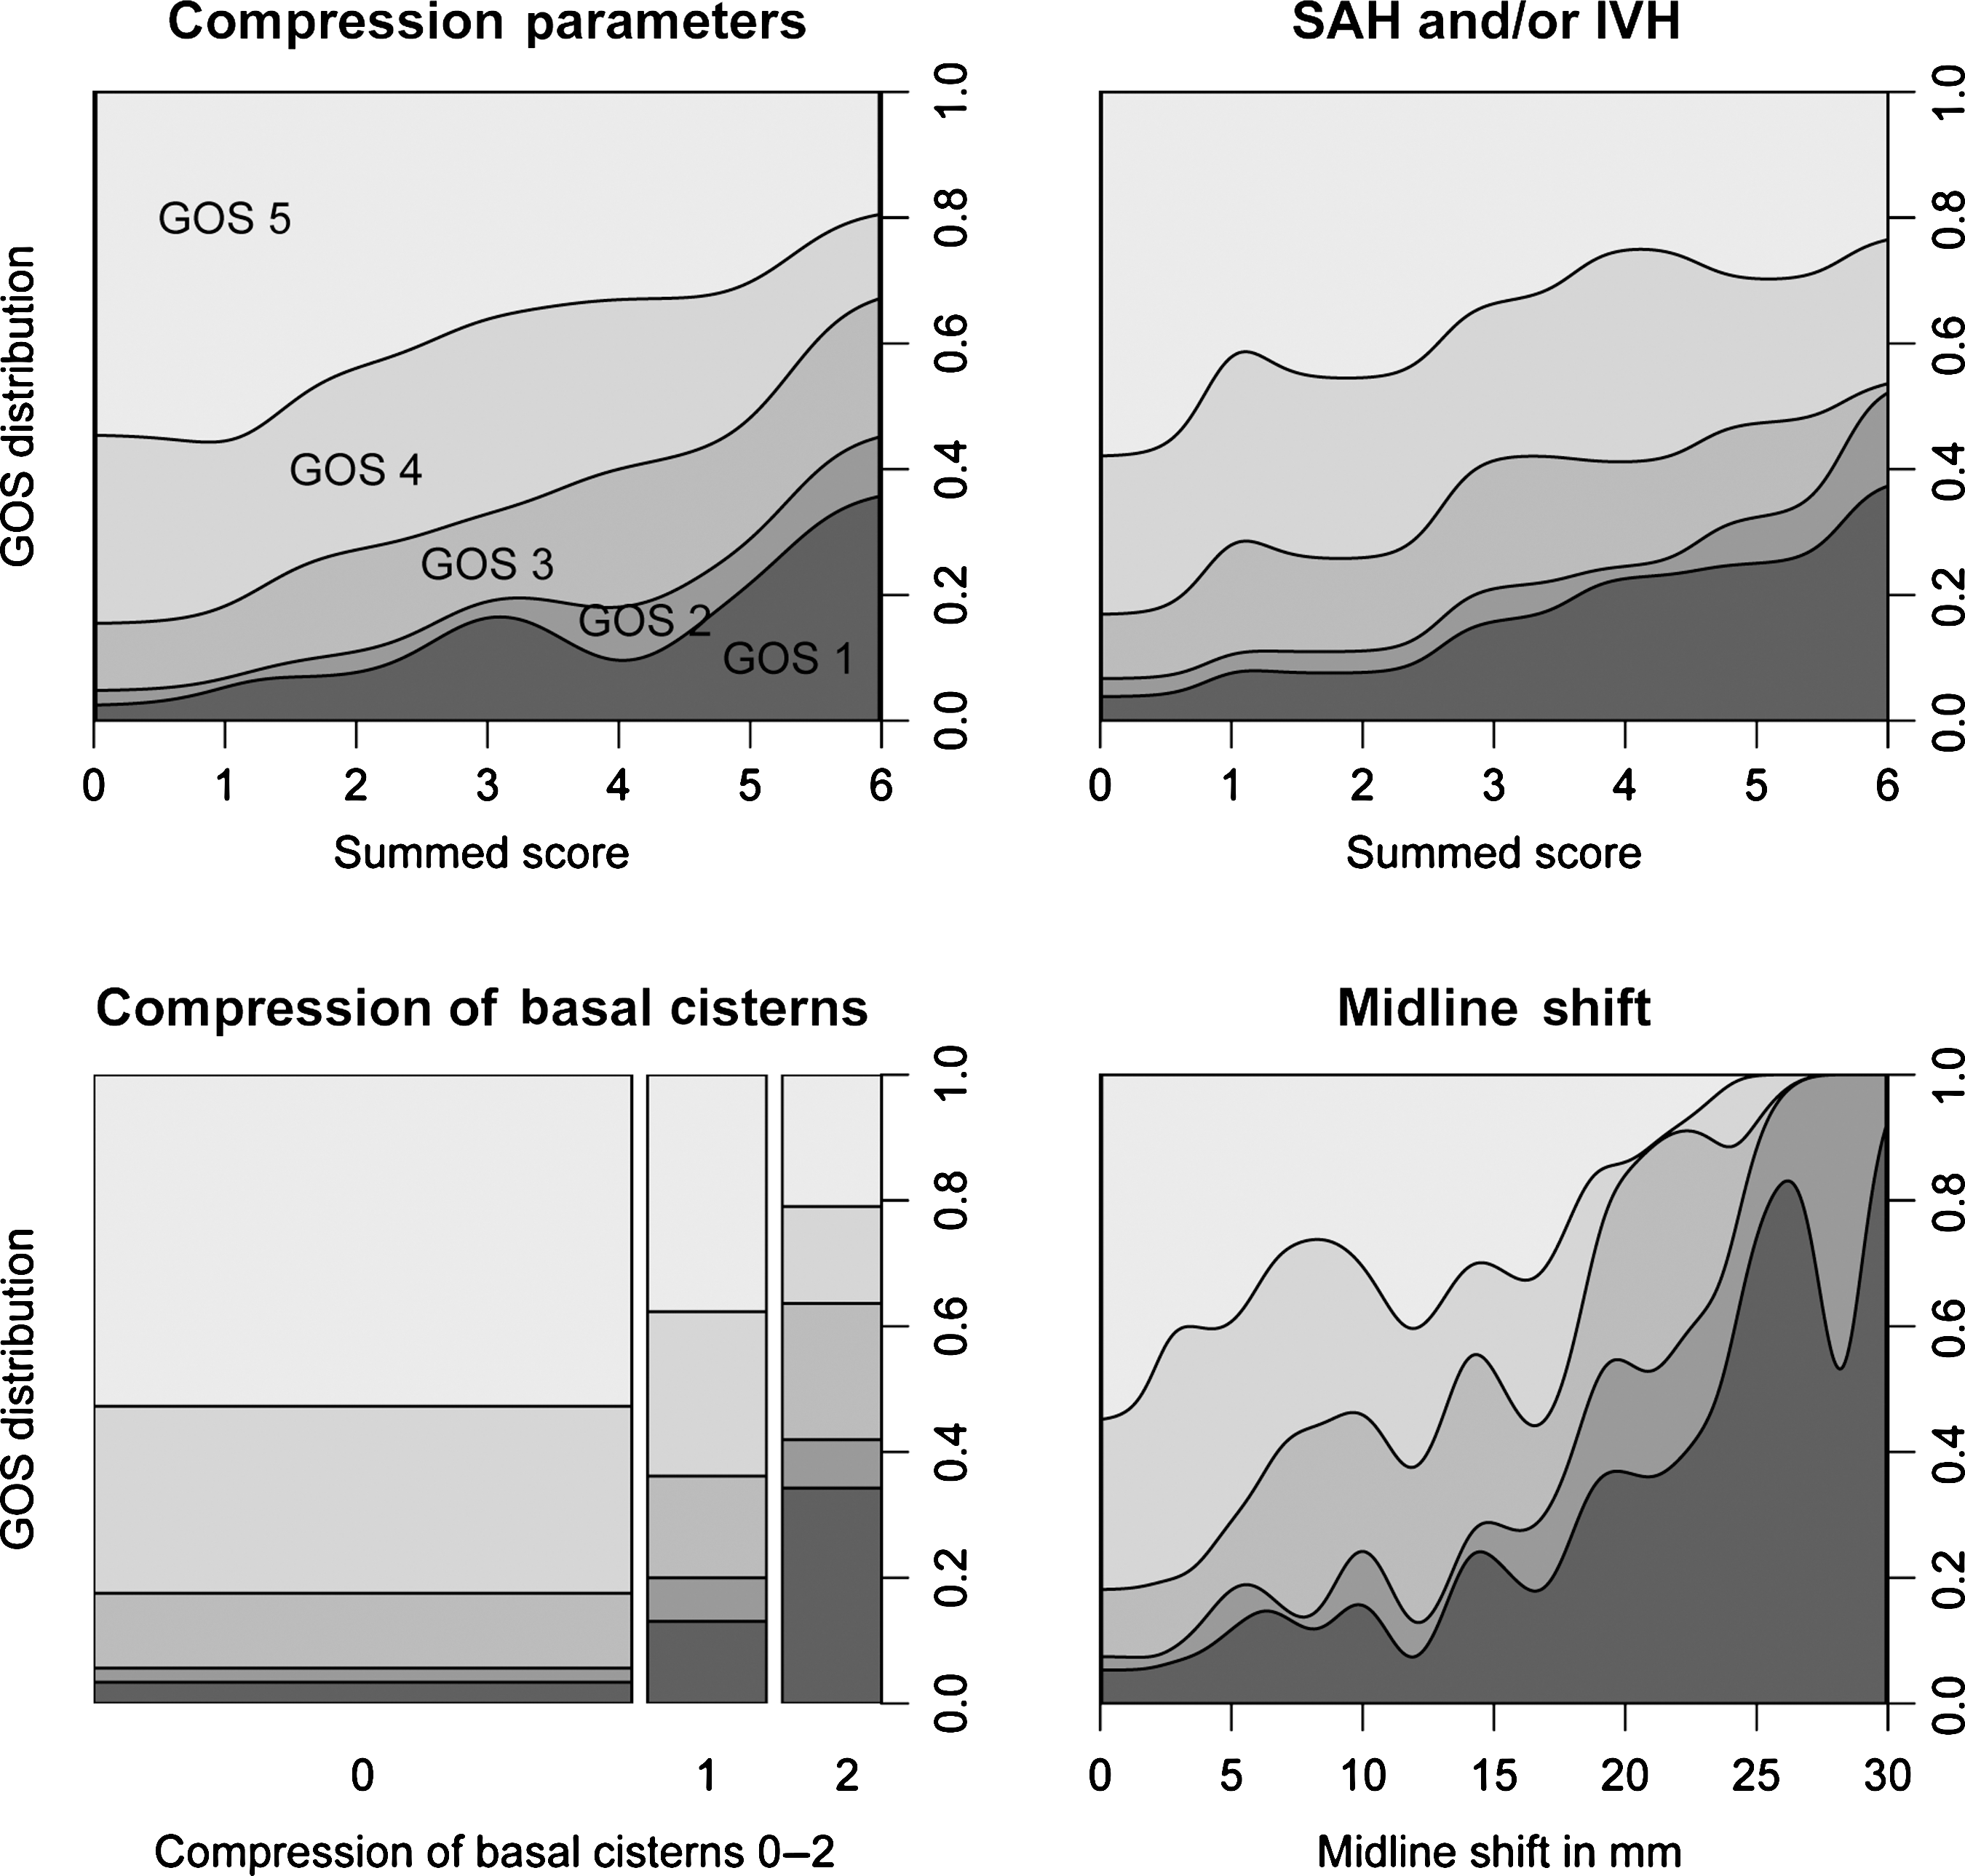
CT parameter relations to outcome. Conditional density (CD) plots of CT variable levels and Glasgow Outcome Scale (GOS) levels, indicating that GOS is highly related to selected CT variables. The CD plots show CT parameter levels on the x-axis and found proportions of GOS levels on the y-axis. Compression and SAH/IVH parameters are summed as scores. The smoothness of the CD plots for the summed parameters supports their use as continuous variables in analyses. The mosaic plot (basal cisterns) shows areas proportionally to incidences (n = 861). For definitions of summed scores see Table 1 (SAH, subarachnoid hemorrhage; IVH, intraventricular hemorrhage).
A near co-linearity of ML-shift with the summed volume of EDH, SDH, and CONT is shown in Figure 3, indicating that volumes of hematomas and contusions can be replaced by ML-shift as a continuous variable. As the shift is highly explained by these volumes, it is clear why low incidences of Marshall category IV (ML-shift > 0.5 cm and lesion volume < 25 mL) are generally found in TBI data.
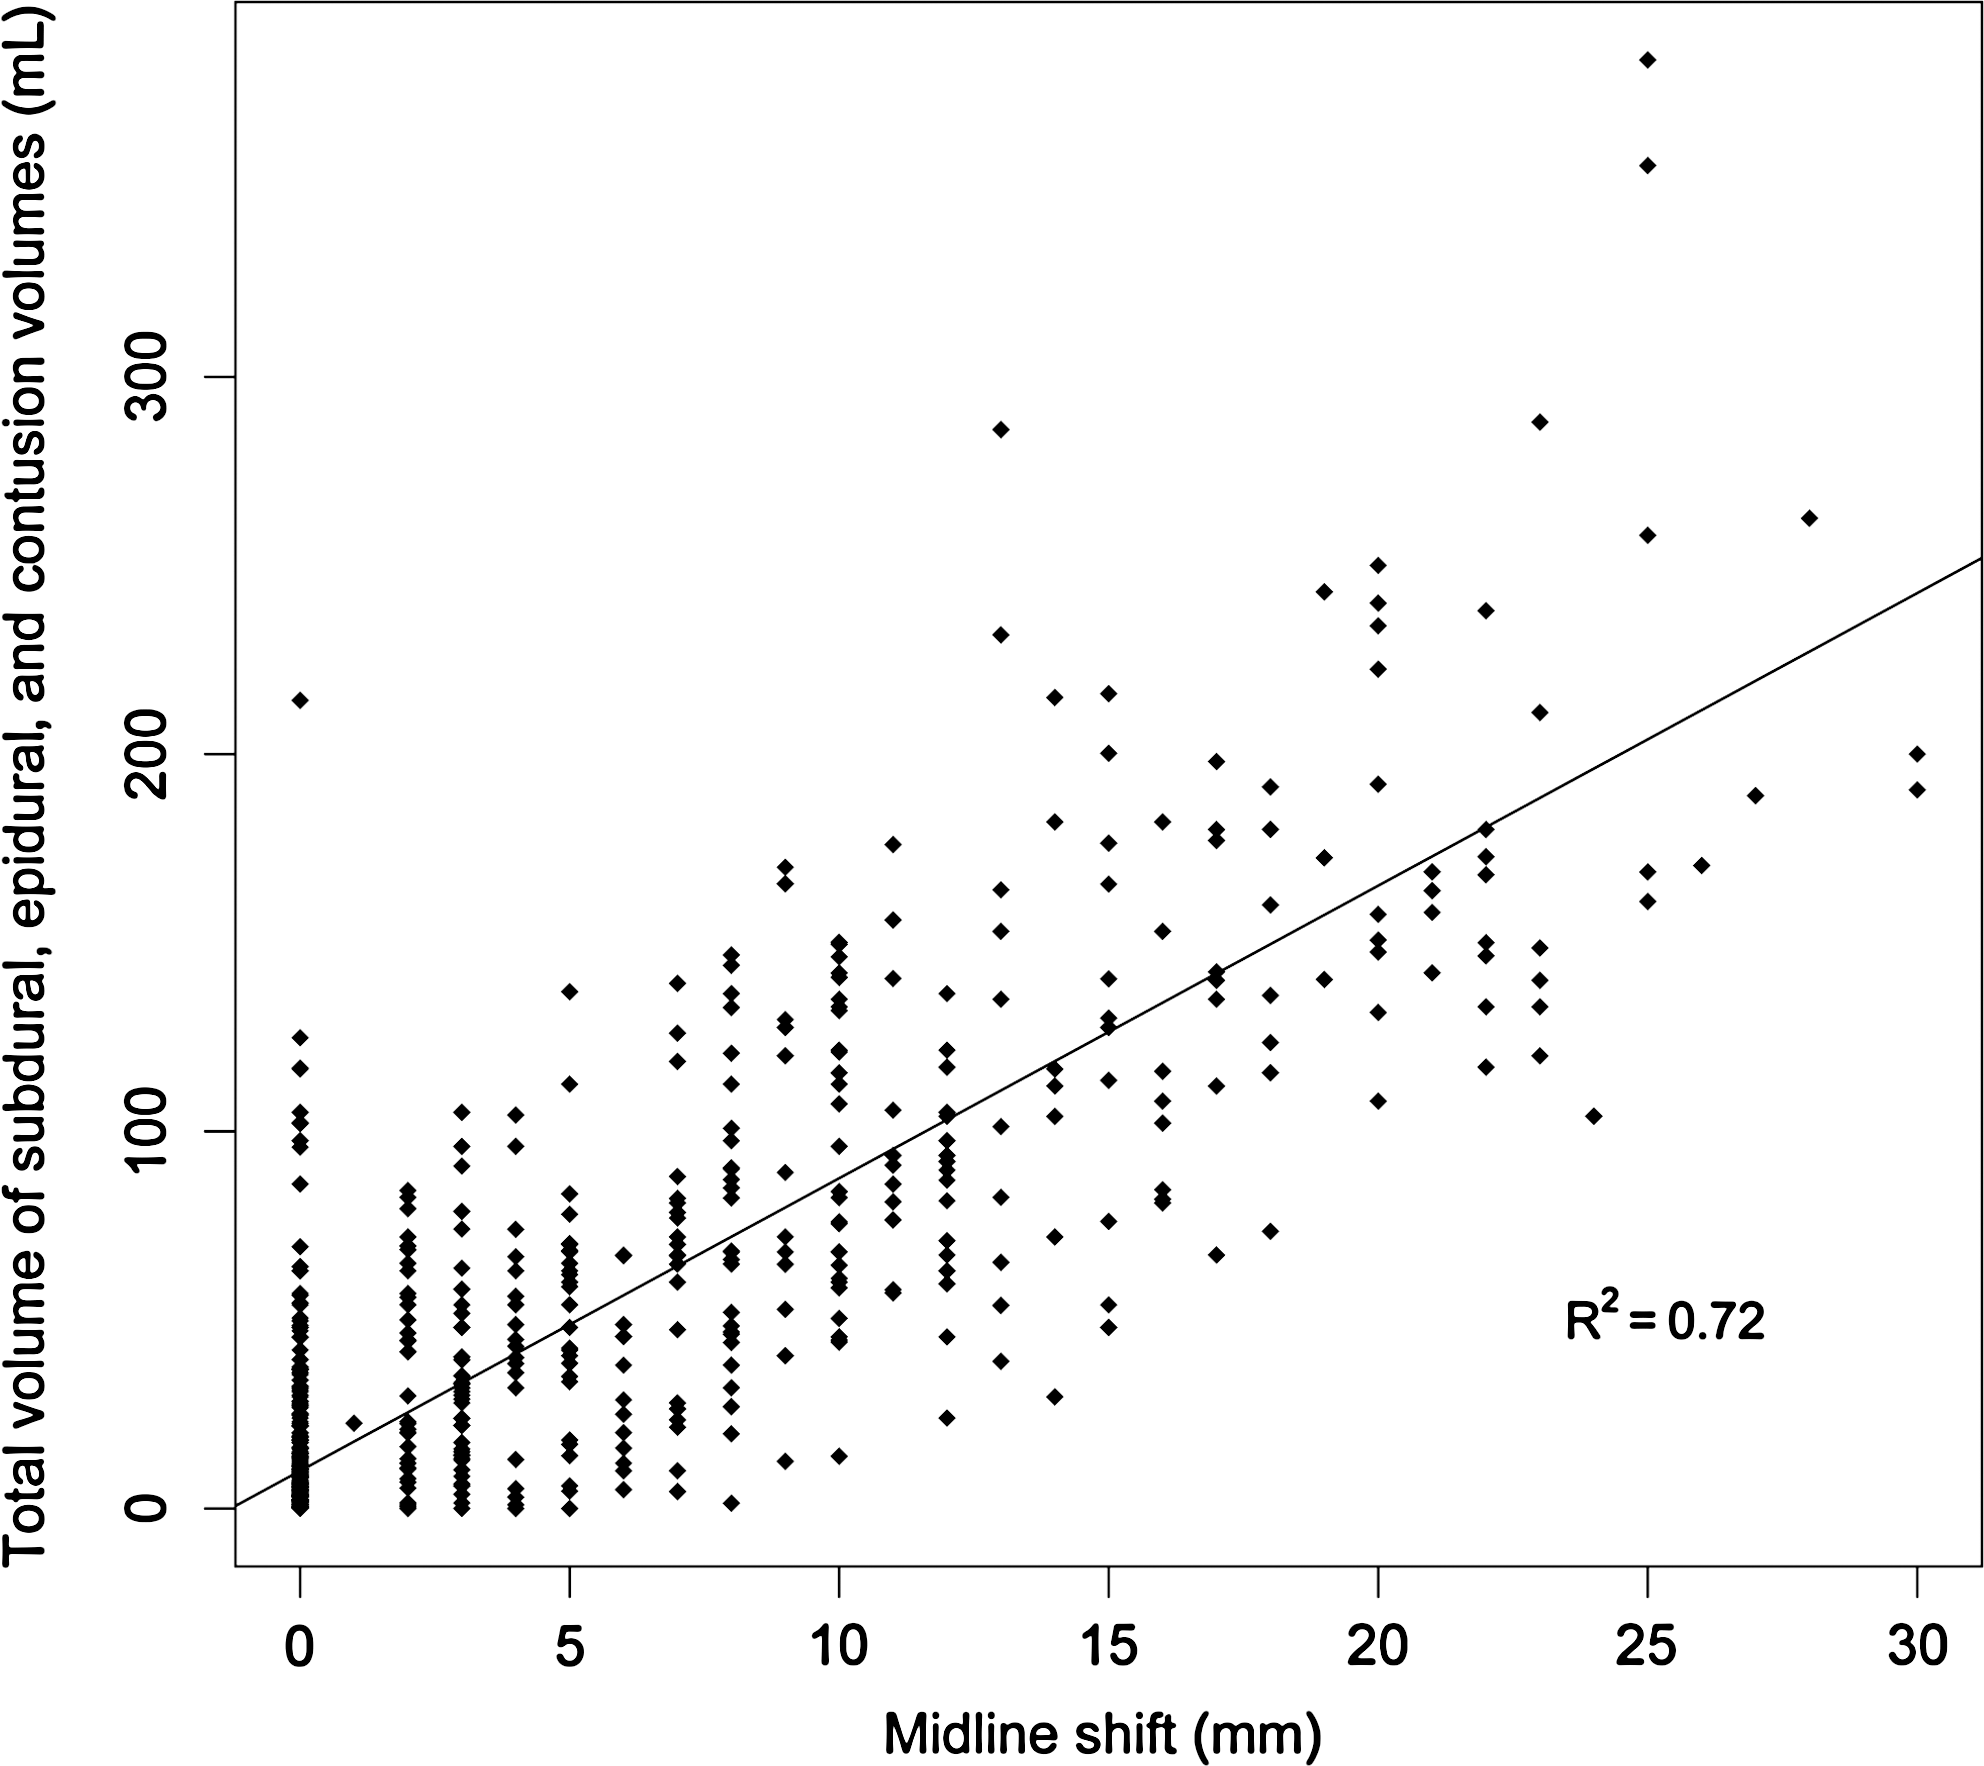
Midline shift and hematomas. Midline-shift (mm) is related to the total volume of subdural, epidural and contusional hematomas, showing a strong correlation (R2 = 0.72). If dual-sided SDHs are excluded, R2 increases to 0.74 (n = 861/832).
Strong dependencies of CT pathology on age and GCS are shown in Figures 4 and 5. Eighty percent of 80 year olds had SDH, compared to 20% of 20 year olds; this relation is near linear. Thus, the inclusion of SDH in a stand-alone CT score (without age or clinical variables) will include a parameter that is in essence an age variable. This identifies why CT information is not immediately additive to general TBI outcome scores, containing these variables. ML-shift (p < 0.001) and SDH (p < 0.001) were most strongly correlated to age. CT variables are multivariately correlated to age (R2 = 0.29). If GCS is treated as a continuous variable (Perel et al., 2008), COMP-bas-cist (p < 0.001) and DAI-brainstem (p < 0.001) are found to be the CT variables most significantly correlated to GCS. CT variables are multivariately correlated to GCS (R2 = 0.31), and few CT variables will be independent predictors in a prediction score including GCS.
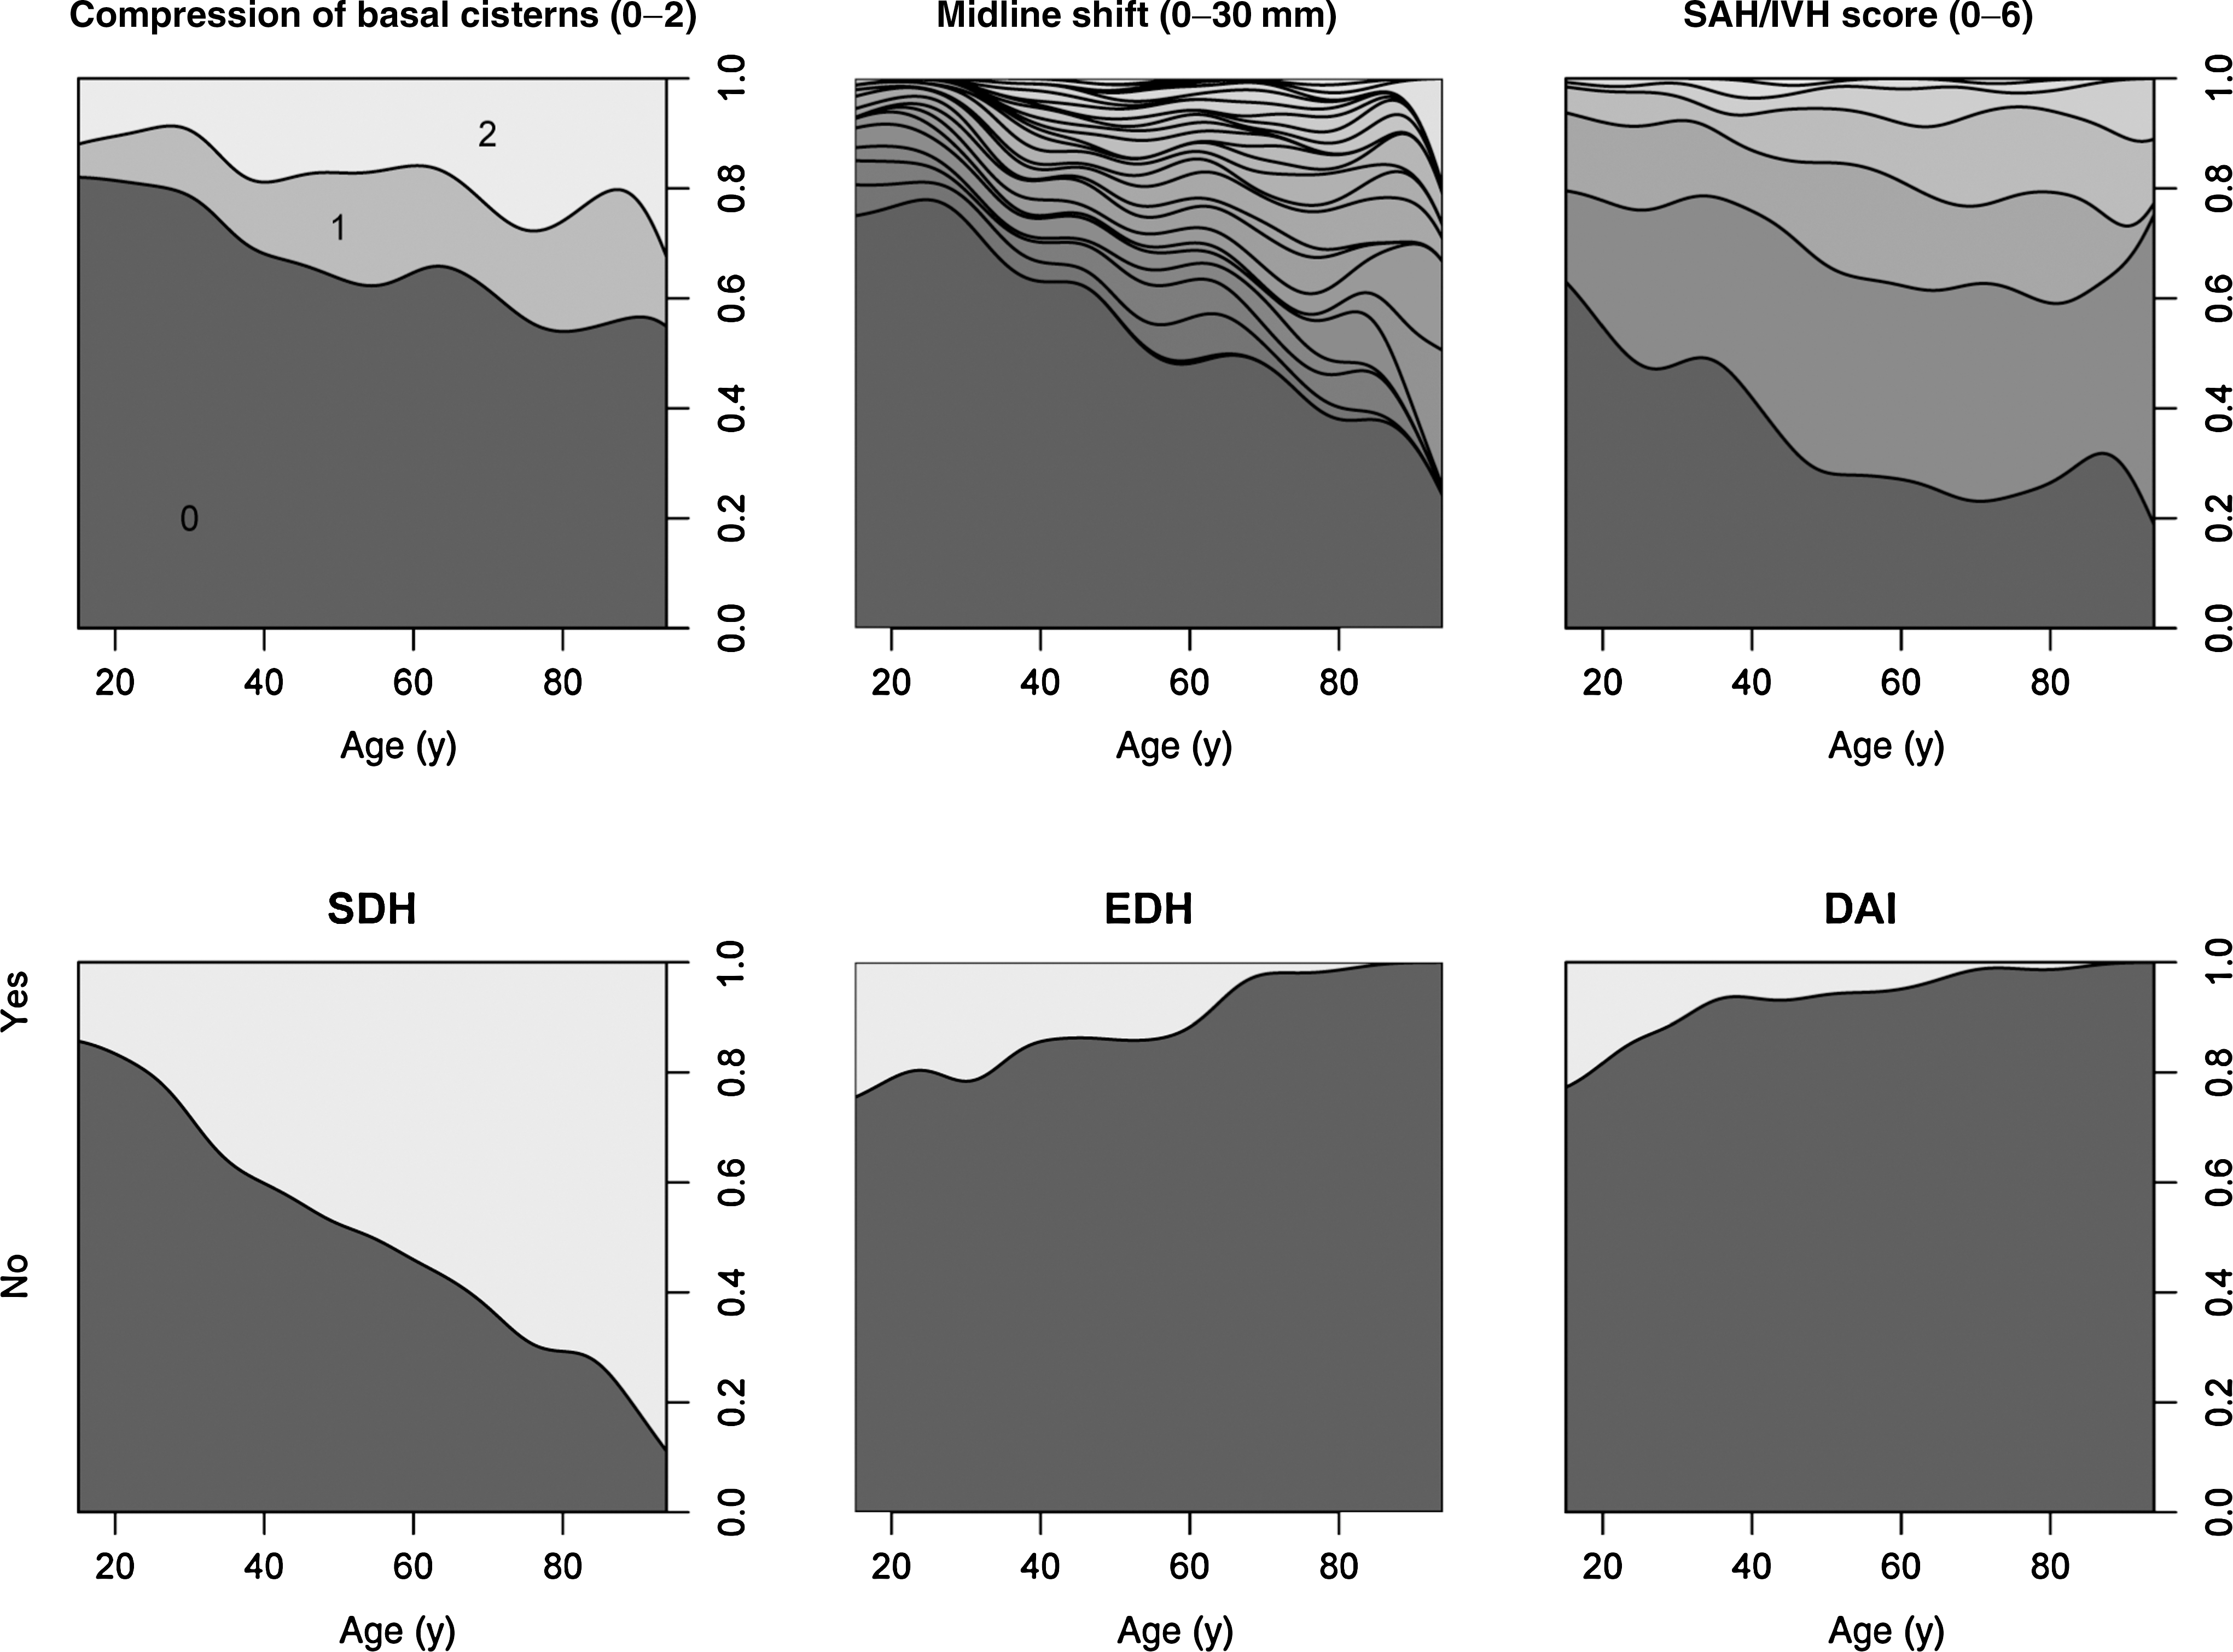
CT variables and age. Conditional density plots of age and relations to central CT variables, indicating the injury profile in traumatic brain injury is strongly related to age. It can be seen that 20% of 20 year olds, and 80% of 80 year olds have subdural hematomas (SDH). For definitions of summed scores see Table 1 (EDH, epidural hemorrhage; DAI, diffuse axonal injury; SAH/IVH, subarachnoid/intraventricular hemorrhage) (n = 861).
CT variables and Glasgow Coma Scale (GCS) score. Conditional density plots of GCS and relations to selected central CT variables, indicating the injury profile in traumatic brain injury is related to GCS, most notably for compression parameters and midline-shift (n = 861). For definitions of summed scores see Table 1 (EDH, epidural hemorrhage; DAI, diffuse axonal injury; SAH/IVH, subarachnoid/intraventricular hemorrhage).
Age, GCS, and pupil responses are highly related to GOS (Fig. 6). These clinical variables alone robustly predict Dich-GOS (pseudo-R2 = 0.418, AUC = 0.846 HL-gof p = 0.66) in our TBI population. Pupil data alone exhibits an estimated explained variance of 24%, but is highly correlated to GCS. Adjusted for GCS, only pupil responses (reactive versus non-reactive pupils) remain significant (pupil sizes and size differences are non-significant). Pupil data adds little prediction to Dich-GOS when GCS is present in the analysis, providing less than 2% additional estimated explained variance. The addition of CT variables to these clinical variables provides, at best, 6.2% added estimated explained variance to Dich-GOS, and 9.9% to survival prediction.
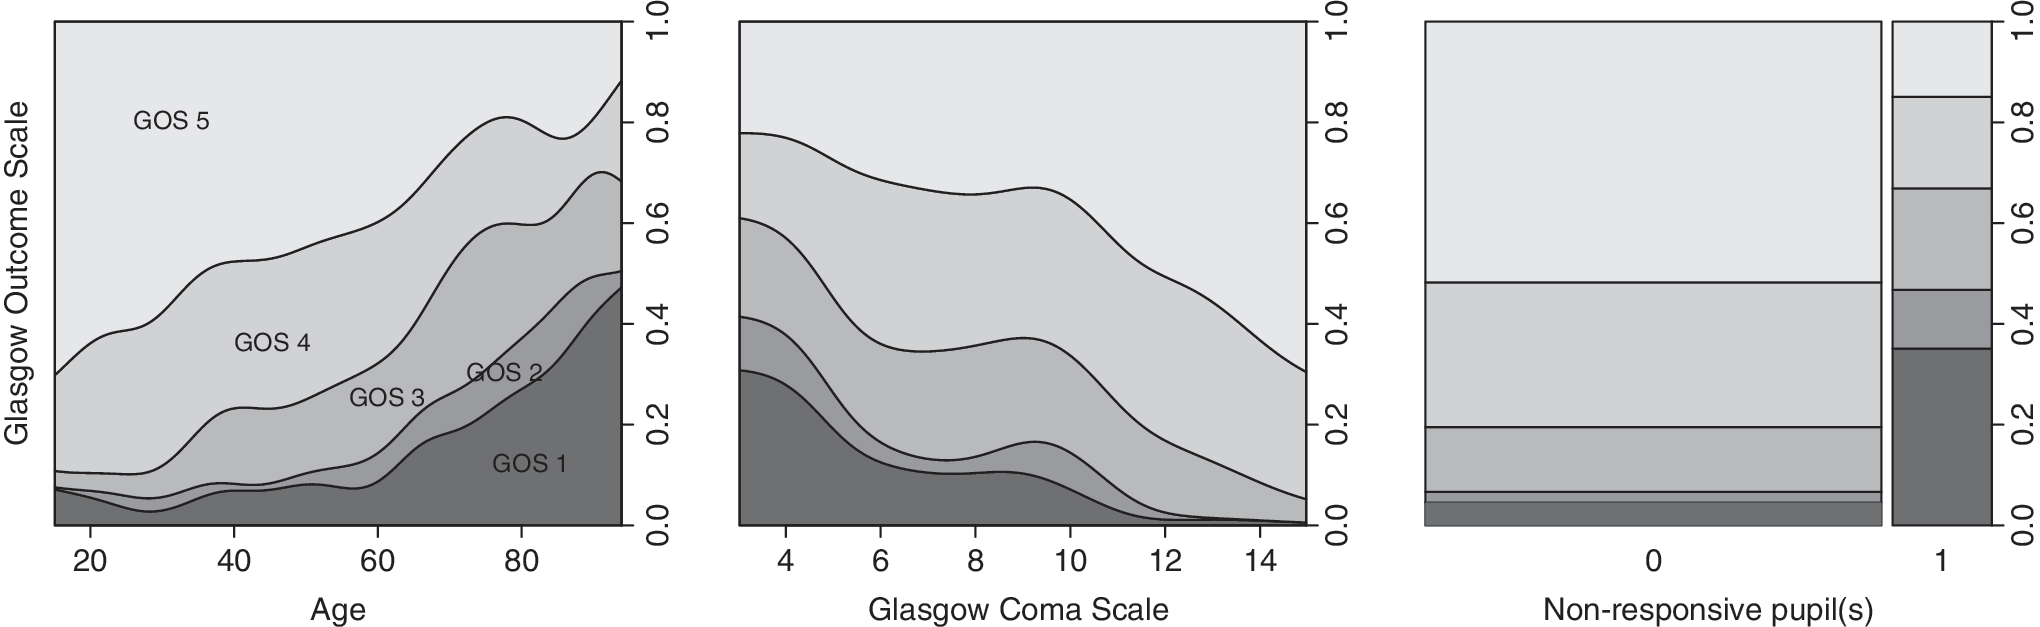
Conditional density plots of the clinical parameters age, Glasgow Coma Scale (GCS) score, and pupil(s) responses are related to Glasgow Outcome Scale (GOS) score (0 = responsive pupils; 1 = non-responsive pupil(s)). The mosaic plot [pupil(s)] shows areas proportionally to incidences (n = 861).
SVM analysis of the all-in data with primary variable data predicts Dich-GOS to AUC 0.834 ± 0.019 SD versus 0.821 ± 0.031 SD, in the training and validation sets, respectively, suggesting a target value for maximum information. This data set cannot be analyzed with logistic regression, as analysis will not converge due to singular and sparse data. Results of analysis with SVM and logistic regression on the subsequent data reductions during feature selection are nearly identical, and only the results of logistic regression will be given.
Analysis results for complex models, reduced models, and simple logistic regression models predicting dichotomized GOS are shown in Table 2, indicating that a simpler model can be constructed that retains much of the accuracy information of the complex models, and is better calibrated than models derived from statistical reduction. All variables and compounded variable scores in the belief approach are retained if AIC reduction is attempted. The belief approach retains much information from the more complex model and appears well calibrated, but remains complicated. The reduction to the final suggested Stockholm score is performed on the training data, retaining variables that add to accuracy and calibration when adjusted for age. The SAH/IVH-score is found to add to both, compared to SAH/IVH yes/no. A simplification of the logistic regression gives a score of probabilities for unfavorable outcome (Table 3).
Data reduction and model performances in feature selection. Models are assessed for accuracy with Nagelkerke's pseudo-R2 and area under the curve (AUC) of receiver operating curves. Calibration is evaluated with the Hosmer-Lemeshow-C goodness-of-fit statistic (HL-gof ). Statistics are shown for the training and validation data. A complex model is reduced with statistical (Akaike information criterion [AIC] and grouped-lasso) methods and a “belief” approach, attempting to include known relations and summed representations of grouped variables. Finally, the variables in a suggested Stockholm score, and two current scores (Rotterdam score and Marshall score) are weighted to a dichotomous outcome and our population (training n = 628; validation n = 233).
Complex: (ML-shift + shift-direction + SDH + SDH-dual + SDH-dx + SDH-sin + SDH1vol + SDH2vol + SDH-volume-total + EDH + EDH-dx + EDH-sin + EDH-volume + contusion-tot-mL + COMP-bas-cist + COMP-ventr + COMP-conv + DAI-corp-call + DAI-sub-cort + DAI-brainstem + DAI-bas-gangl + IVH + SAH-mm + SAH-bas-cist + SAH-conv + depression-fracture + bas-fracture + any-fracture-or-intracranial-air + chronic-SDH + other-pathology + old-parenchymal-defect + hydrocephalus).
Group-lasso: (ML-shift + SDH + SDH-sin + SDH-dual + SDH-volume-total + EDH-dx + EDH + COMP-ventr + COMP-bas-cist + DAI-brainstem + IVH + SAH-bas-cist + SAH-conv).
AIC reduced: (ML-shift + EDH + DAI-brainstem + IVH + SAH-conv).
Belief variables: (ML-shift + shift-direction + SAH/IVH- score + COMP-score + DAI + SDH + EDH + SDH-dual.
Stockholm variables: (ML-shift + SAH/IVH-score + EDH + DAI + SDH-dual).
Rotterdam variables: (Dich-shift + COMP-bas-cist + EDH + SAH-or-IVH).
Marshall variables: (Dich-shift + COMP-bas-cist + lesions > 25 mL + abnormality).
COMP, compression; COMP-ventr, compression lateral ventricles; COMP-conv, compression convexity gyri; EDH, epidural hemorrhage; SDH, subdural hemorrhage; CONT, contusion; SAH, subarachnoid hemorrhage; IVH, intraventricular hemorrhage; SAH-conv, SAH convexities; SAH-bas-cist, SAH basal cisterns; IVH, intraventricular hemorrhage; SAH-mm, SAH thickness; DAI, diffuse axonal injury; DAI-sub-cort, DAI subcortical; DAI-corp-call, DAI corpus callosum; DAI-brainstem, DAI brainstem; DAI-bas-gangl, DAI basal ganglia; GOS, Glasgow Outcome Scale; Dich-GOS, dichotomized GOS; ML-shift, midline shift; SDH1vol, subdural hemorrhage 1 volume; SDH2vol, subdural hemorrhage 2 volume; SDH-dx, right subdural hemorrhage; SDH-sin, left subdural hemorrhage; Contusion-tot-mL, contusion total in milliliters; SDH-dual, dual subdural hemorrhage; SDH-volume-total, SDH total volume; EDH-dx, right epidural hemorrhage; EDH-sin, left epidural hemorrhage; EDH-vol, epidural hemorrhage volume; COMP-bas-cist, compression basal cistern.
SAH/IVH-score is the summed scores of subarachnoid/intraventricular hemorrhage (convexities (0–2) + basal cisterns (0–2) + intraventricular (0–1) * 2).
DAI is the presence of CT-visible lesions in the brainstem, corpus callosum, or basal ganglia (not subcortical). The addition of 1 to the tally ensures it to be positive.
EDH, epidural hemorrhage.
The choice of outcome target (dichotomous versus survival) affects what variables are selected with statistical feature reduction (Table 4). The effect of population choice is less pronounced. ML-shift is the most important feature of Dich-GOS prediction, whereas compression of basal cisterns is more predictive of death. SAH and/or IVH blood are consistently found in all groups. The existence of EDH is a positive, and DAI-brainstem is a negative factor towards favorable outcome.
Variables selected with Akaike information criterion (AIC) step-down variable selection on training data. Midline-shift is an important feature of dichotomous GOS prediction, whereas compression of basal cisterns is more predictive of death. Subarachnoid or intraventricular blood is consistently found in all groups. The existence of an epidural hematoma is a positive, and a brainstem lesion is a negative factor towards favorable outcome.
Scores: Midline shift in millimeters, subarachnoid blood on convexities (0–2), intraventricular blood (0–1), epidural hematoma (0–1), diffuse axonal injury-brainstem lesion (0–1), compression of basal cisterns (0–2).
GOS, Glasgow Outcome Score; GCS, Glasgow Coma Scale; TBI, traumatic brain injury.
The Rotterdam and Marshall scores were weighted to predict death in more severe TBI populations than those we used in our study. Using the scores from the Stockholm and Rotterdam scores, and the categories of the Marshall CT score as sole explanatory variables in a logistic regression predicting survival in the subgroup of severe-to-moderate TBI patients (GCS score ≤ 12), allows for comparison of the score variables and their internal weightings. The results indicate that the Stockholm score (R2 = 0.23, AUC = 0.784, HL-gof p = 0.80) appears comparable to the Rotterdam score (R2 = 0.23, AUC = 0.776, HL-gof p = 0.29) in predicting death, an outcome for which it was not weighted. Both the Rotterdam and Stockholm scores are significantly better than the Marshall score (R2 = 0.095, AUC = 0.696, HL-gof p < 0.0001).
The Stockholm, Rotterdam, Rotterdam-reweighted (Rotterdam variables reweighted for Dich-GOS), and Marshall CT score performances are shown in Figure 7. As validation shows little evidence of overtraining, the models are assumed valid for the whole data set. A boot-strapped estimate confidence interval is given for the line between GOS 3 and 4, that which the models were weighted to. The conditional density plots can be used to visually estimate probabilities of outcomes from a given score. The Rotterdam variables are seen to provide a smaller range of predicted probabilities, and the score greatly overestimates mortality (the outcome for which it was weighted) in our population.
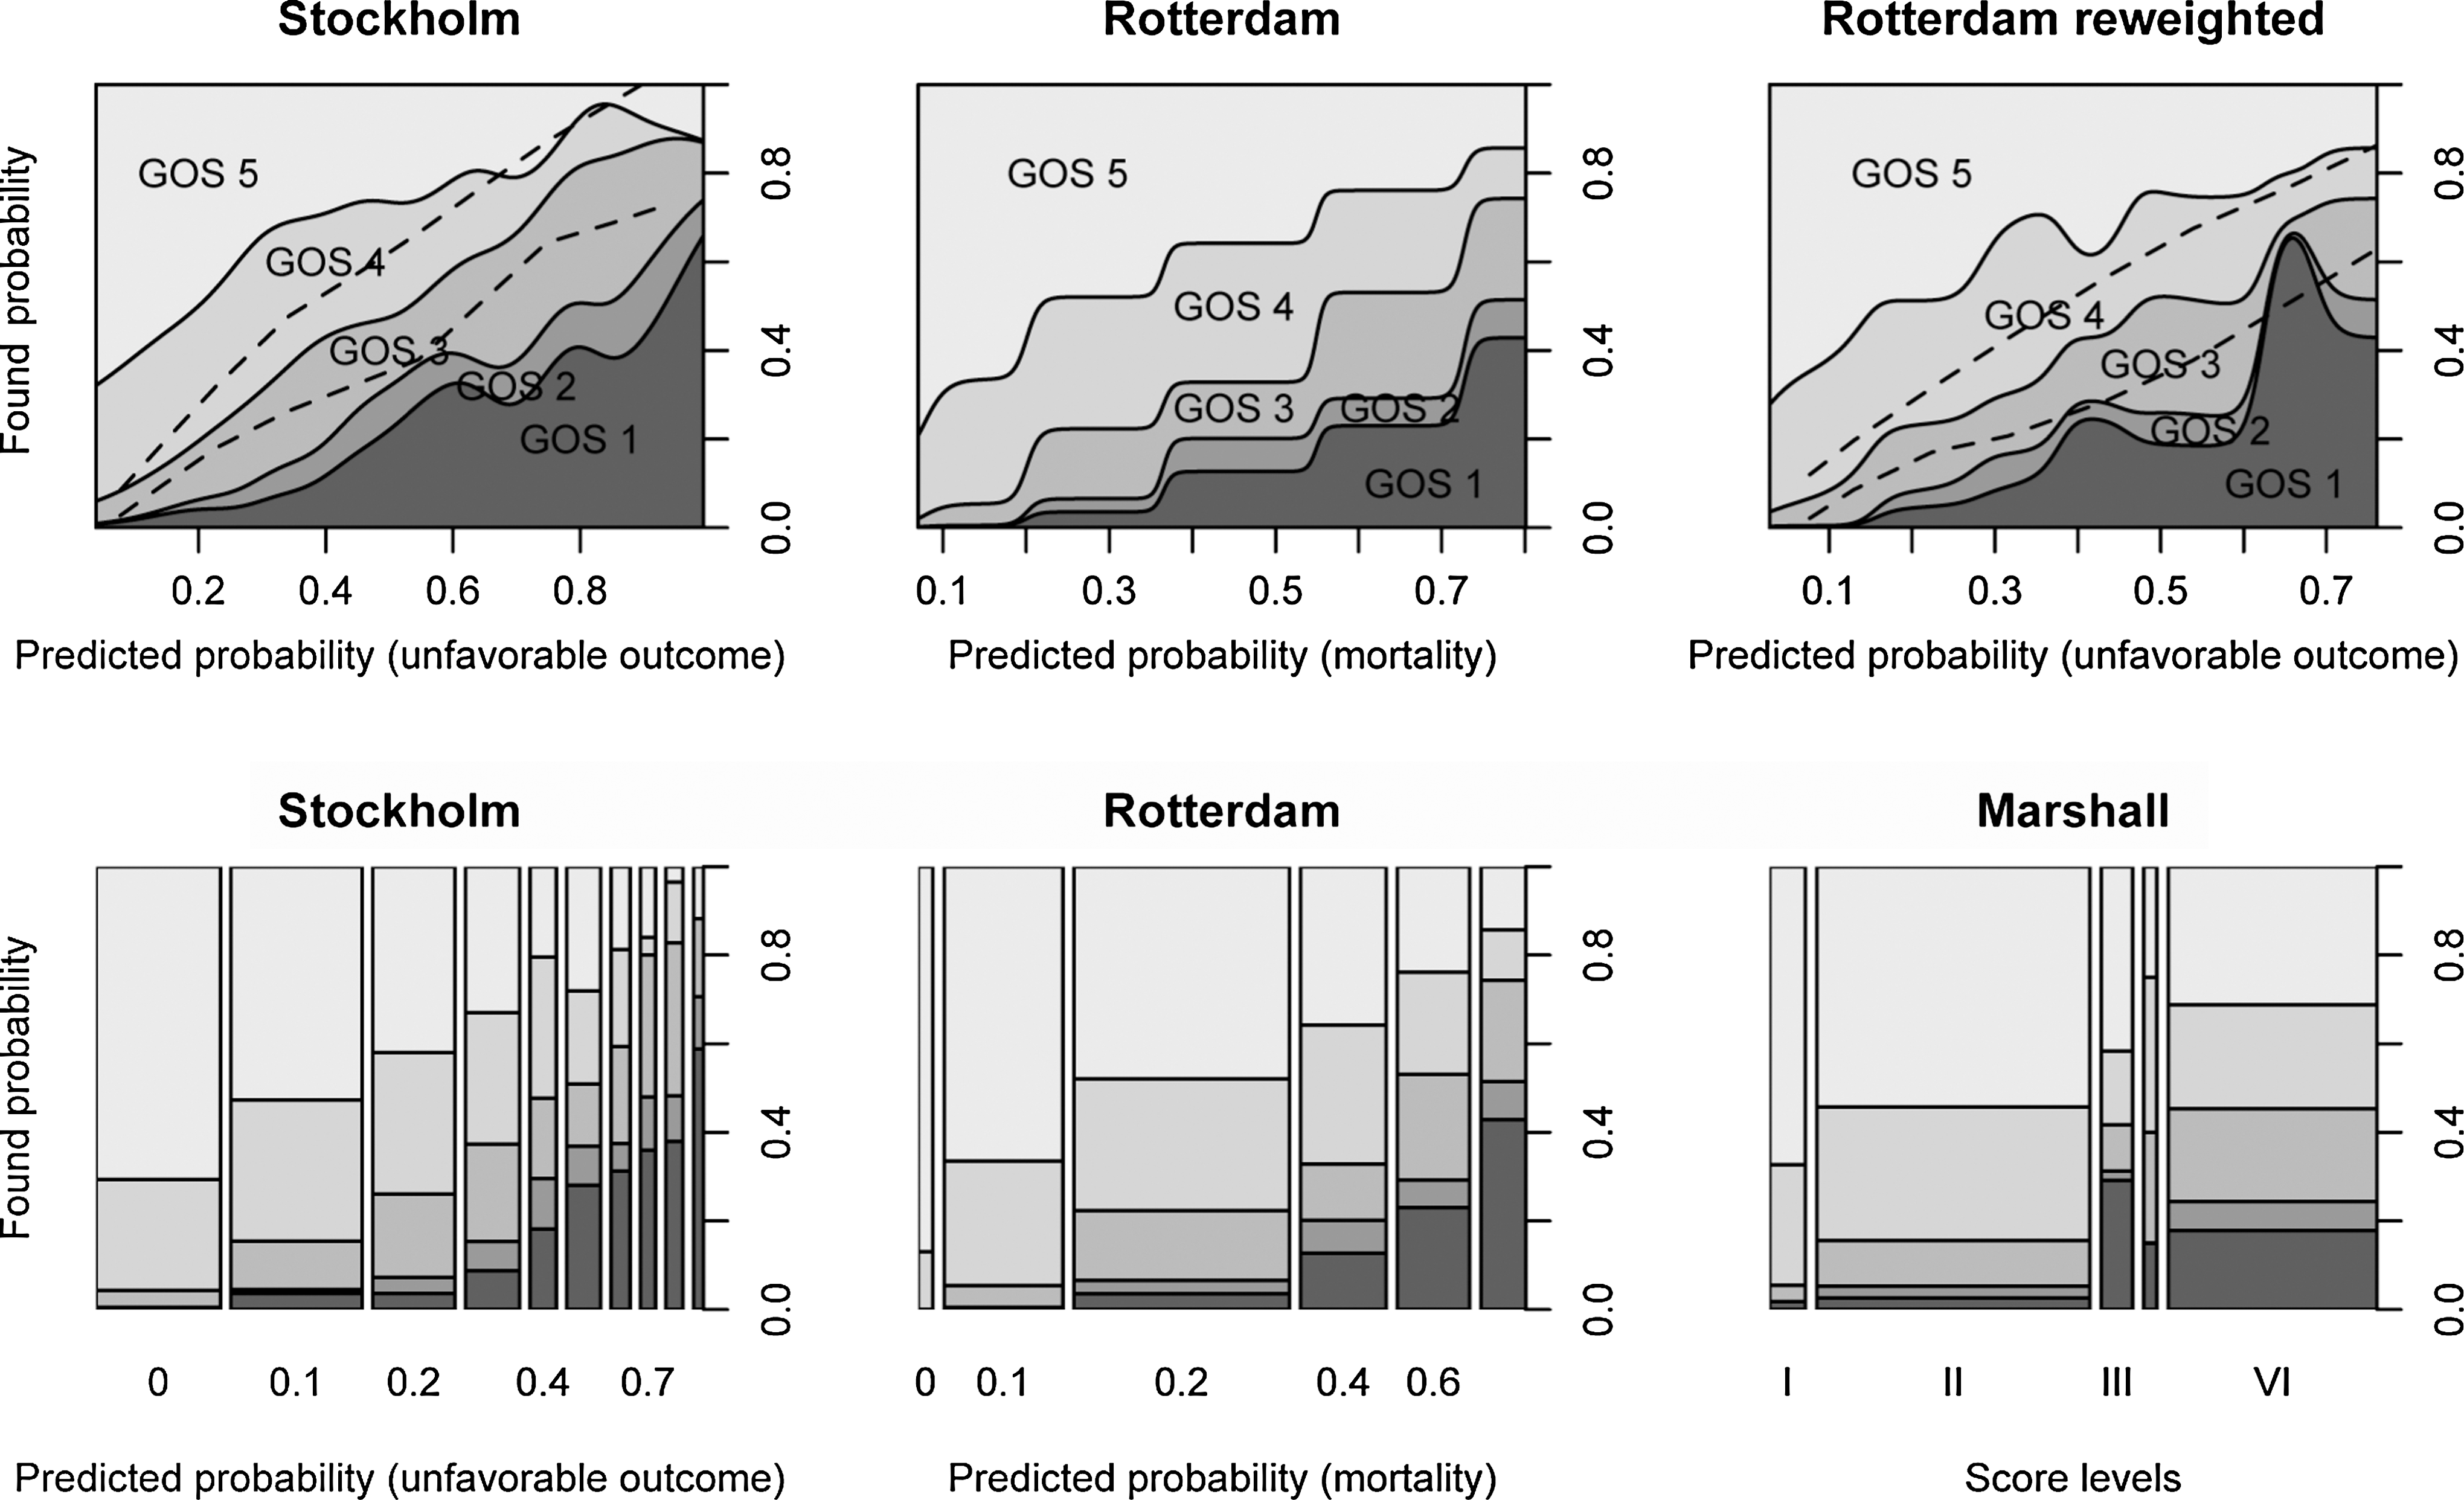
The Stockholm CT variables are compared with those of the Rotterdam, Rotterdam reweighted, and Marshall scores. Predicted probabilities from the Stockholm and Rotterdam variables are plotted against the true encountered probabilities in these CD plots. The Rotterdam score, designed to predict mortality, is seen to overestimate mortality in our data set (a 60% predicted mortality shows a true mortality rate of 23%). The Rotterdam variables in a new regression reweighted to predict unfavorable outcome in our population also have a limited range of predictions. A boot-strapped estimated 95% confidence interval (dashed line) is given for the Stockholm and reweighted Rotterdam variables (for unfavorable outcome prediction, the line between Glasgow Outcome Scale [GOS] scores 3 and 4). The mosaic plots show areas proportionally to incidences. The Marshall score can be seen to near dichotomize our data into categories II and VI. As all CTs were viewed prior to surgical intervention, there are no Marshall category V patients.
As a consequence of the strong dependencies of CT variables on clinical variables (see above), few CT parameters are found significant alongside clinical variables in the regression models, as shown in Figure 8. For Dich-GOS prediction these are ML-shift, SAH/IVH, EDH, and DAI, in descending order of importance, according to the Wald Z-score. A practical clinical rule of thumb for outcome is presented in Figure 9, with estimated confidence intervals of the Dich-GOS line for which it was weighted to discriminate. The formula (age − 3 * GCS + ML-shift [mm] +10 rule), where the 10 rule is: +10 (if nonresponsive pupil[s]), +10 (if SAH/IVH), + 10 (if DAI), and –10 (if EDH), gives a score that for adults directly estimates the probability of an unfavorable outcome (AUC = 0.86, R2 = 0.45 and HL-gof p = 0.61). This is a conversion and simplification of the internal weights to a linear representation (thus not towards the logit function). It is done for the sake of simplicity, but the score can therefore produce out-of-range (<0 and >100%) probabilities. Probabilities below zero are interpreted as near 0. Despite the fact that the model is fitted to GOS 3–4, surprisingly smooth observed probabilities are seen for all GOS levels, supporting GOS as an outcome measure.
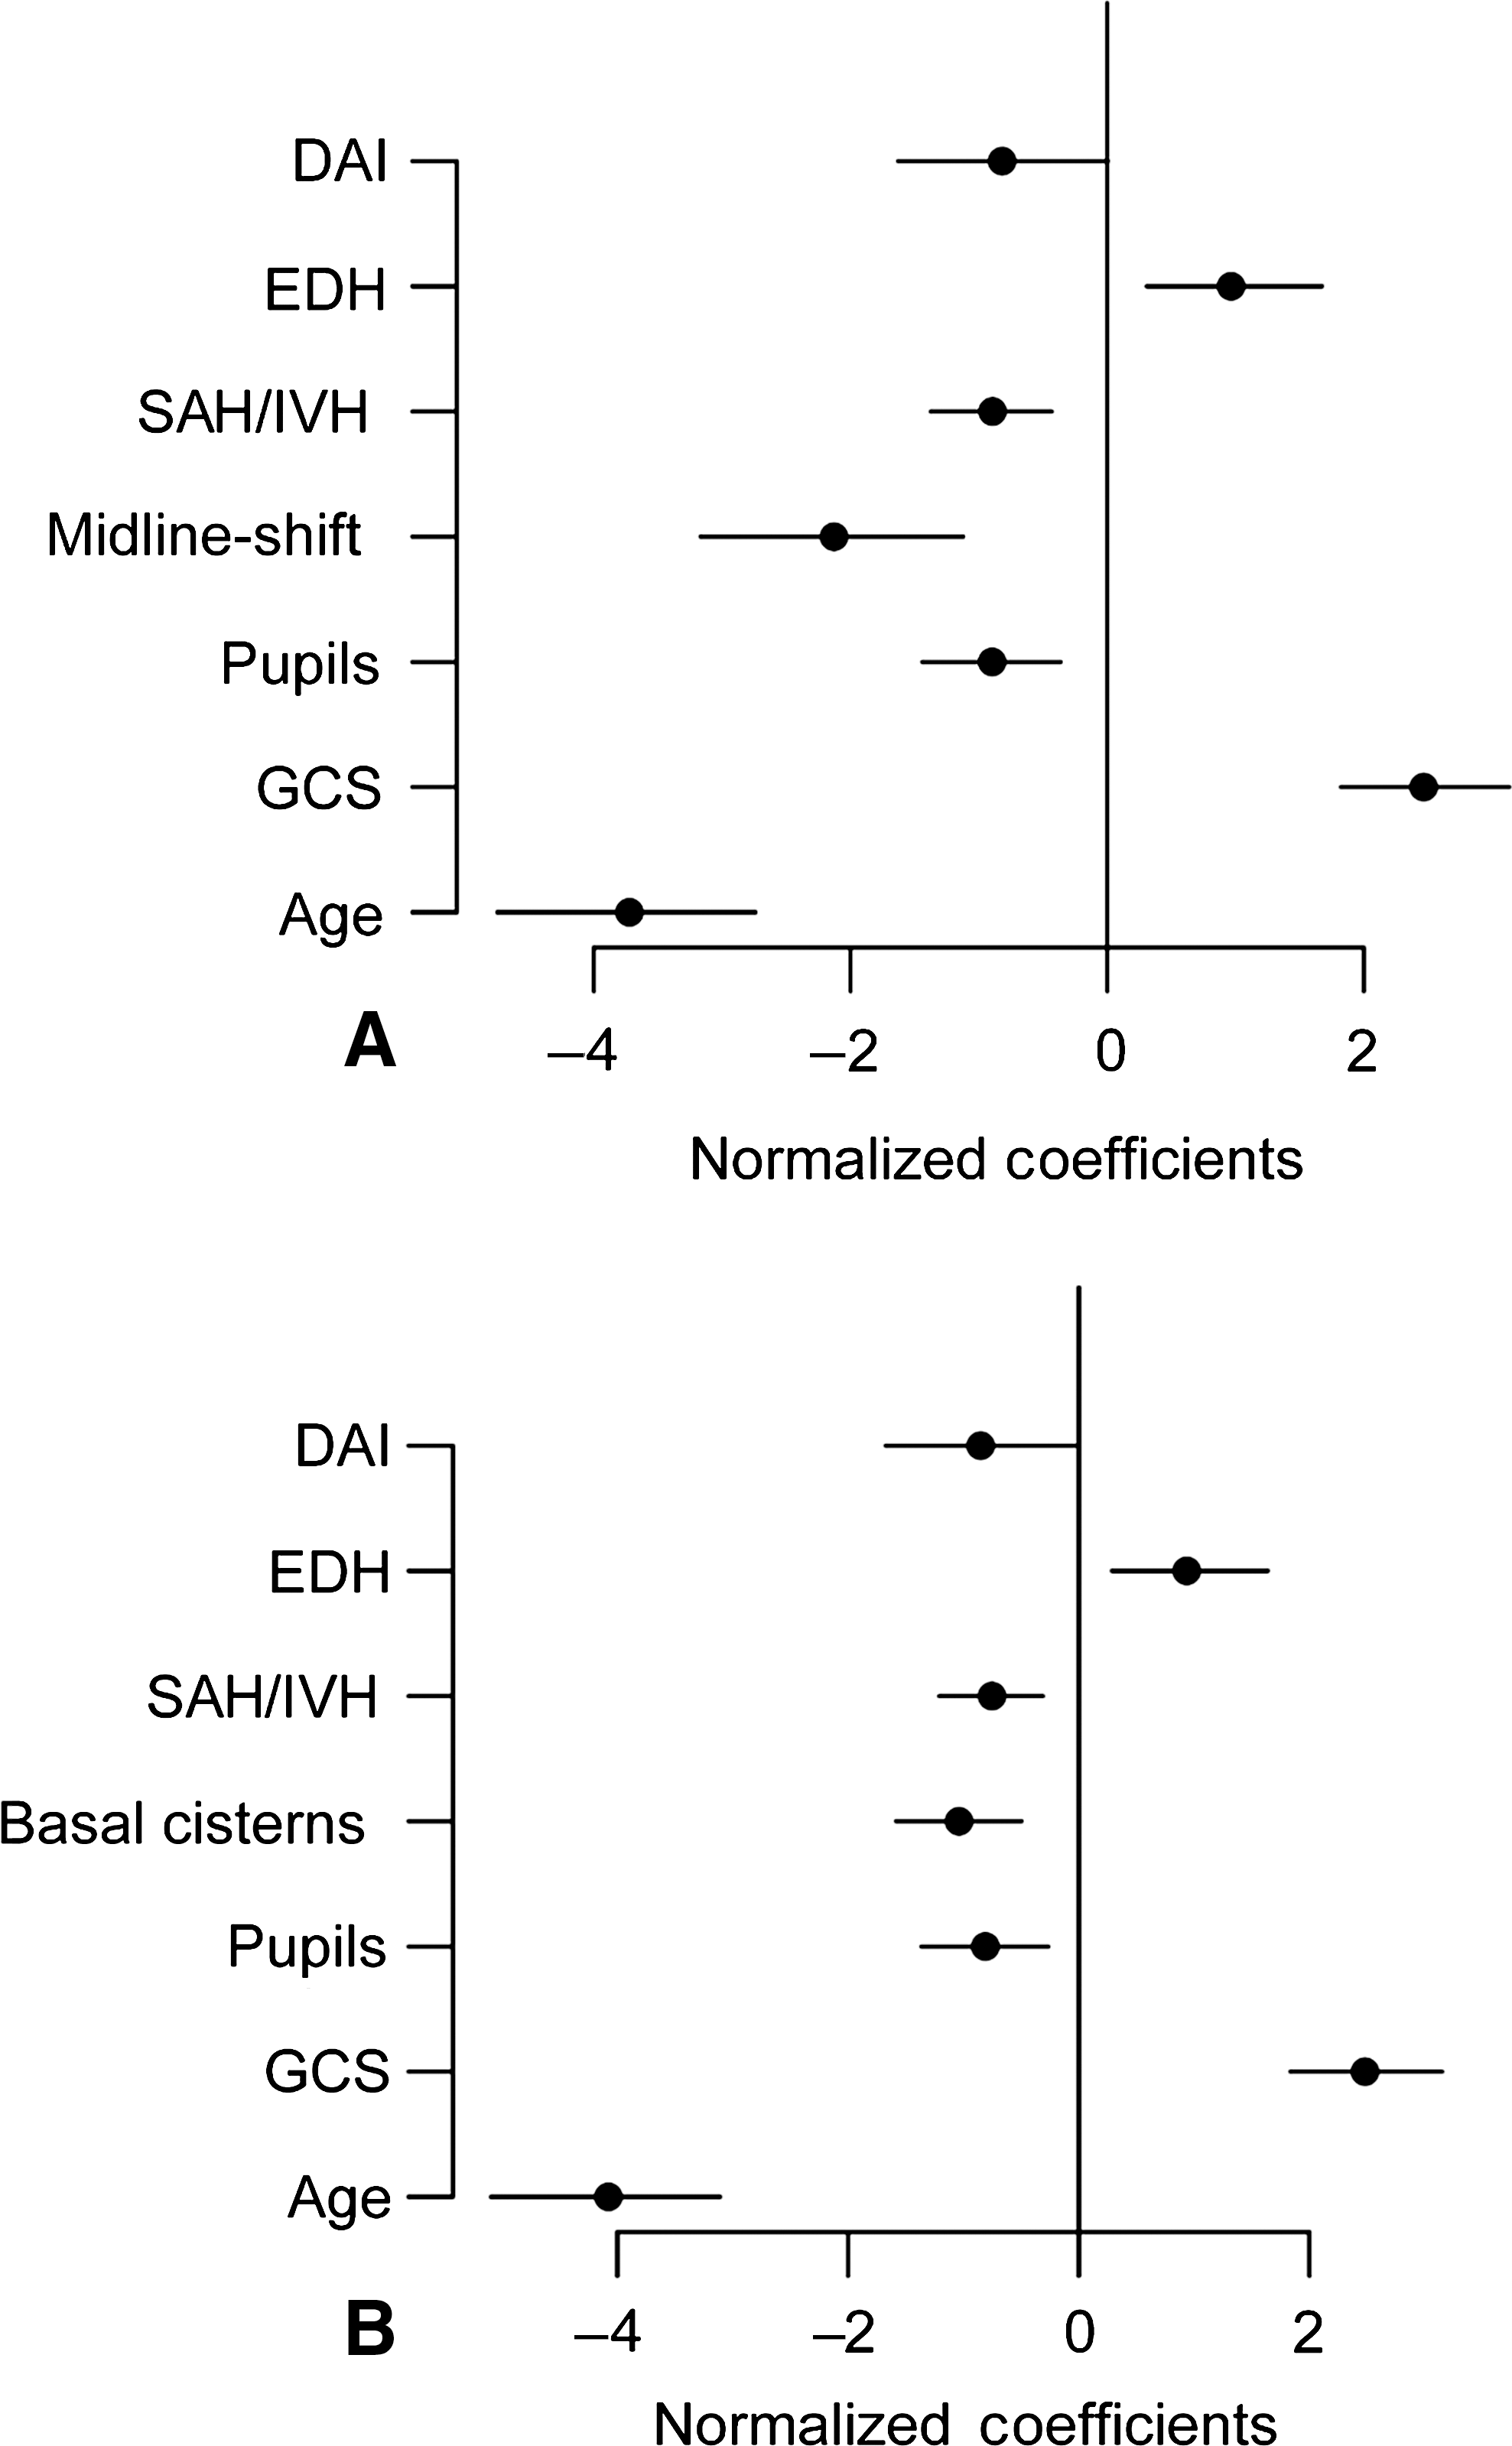
CT parameters adjusted for age and GCS and pupil responses. Few CT parameters remain significant in the presence of these clinical variables when predicting unfavorable outcome. The significant regression coefficients are shown (min/max normalized so that their magnitudes can be compared) with 95% confidence intervals. Regressions are shown with (
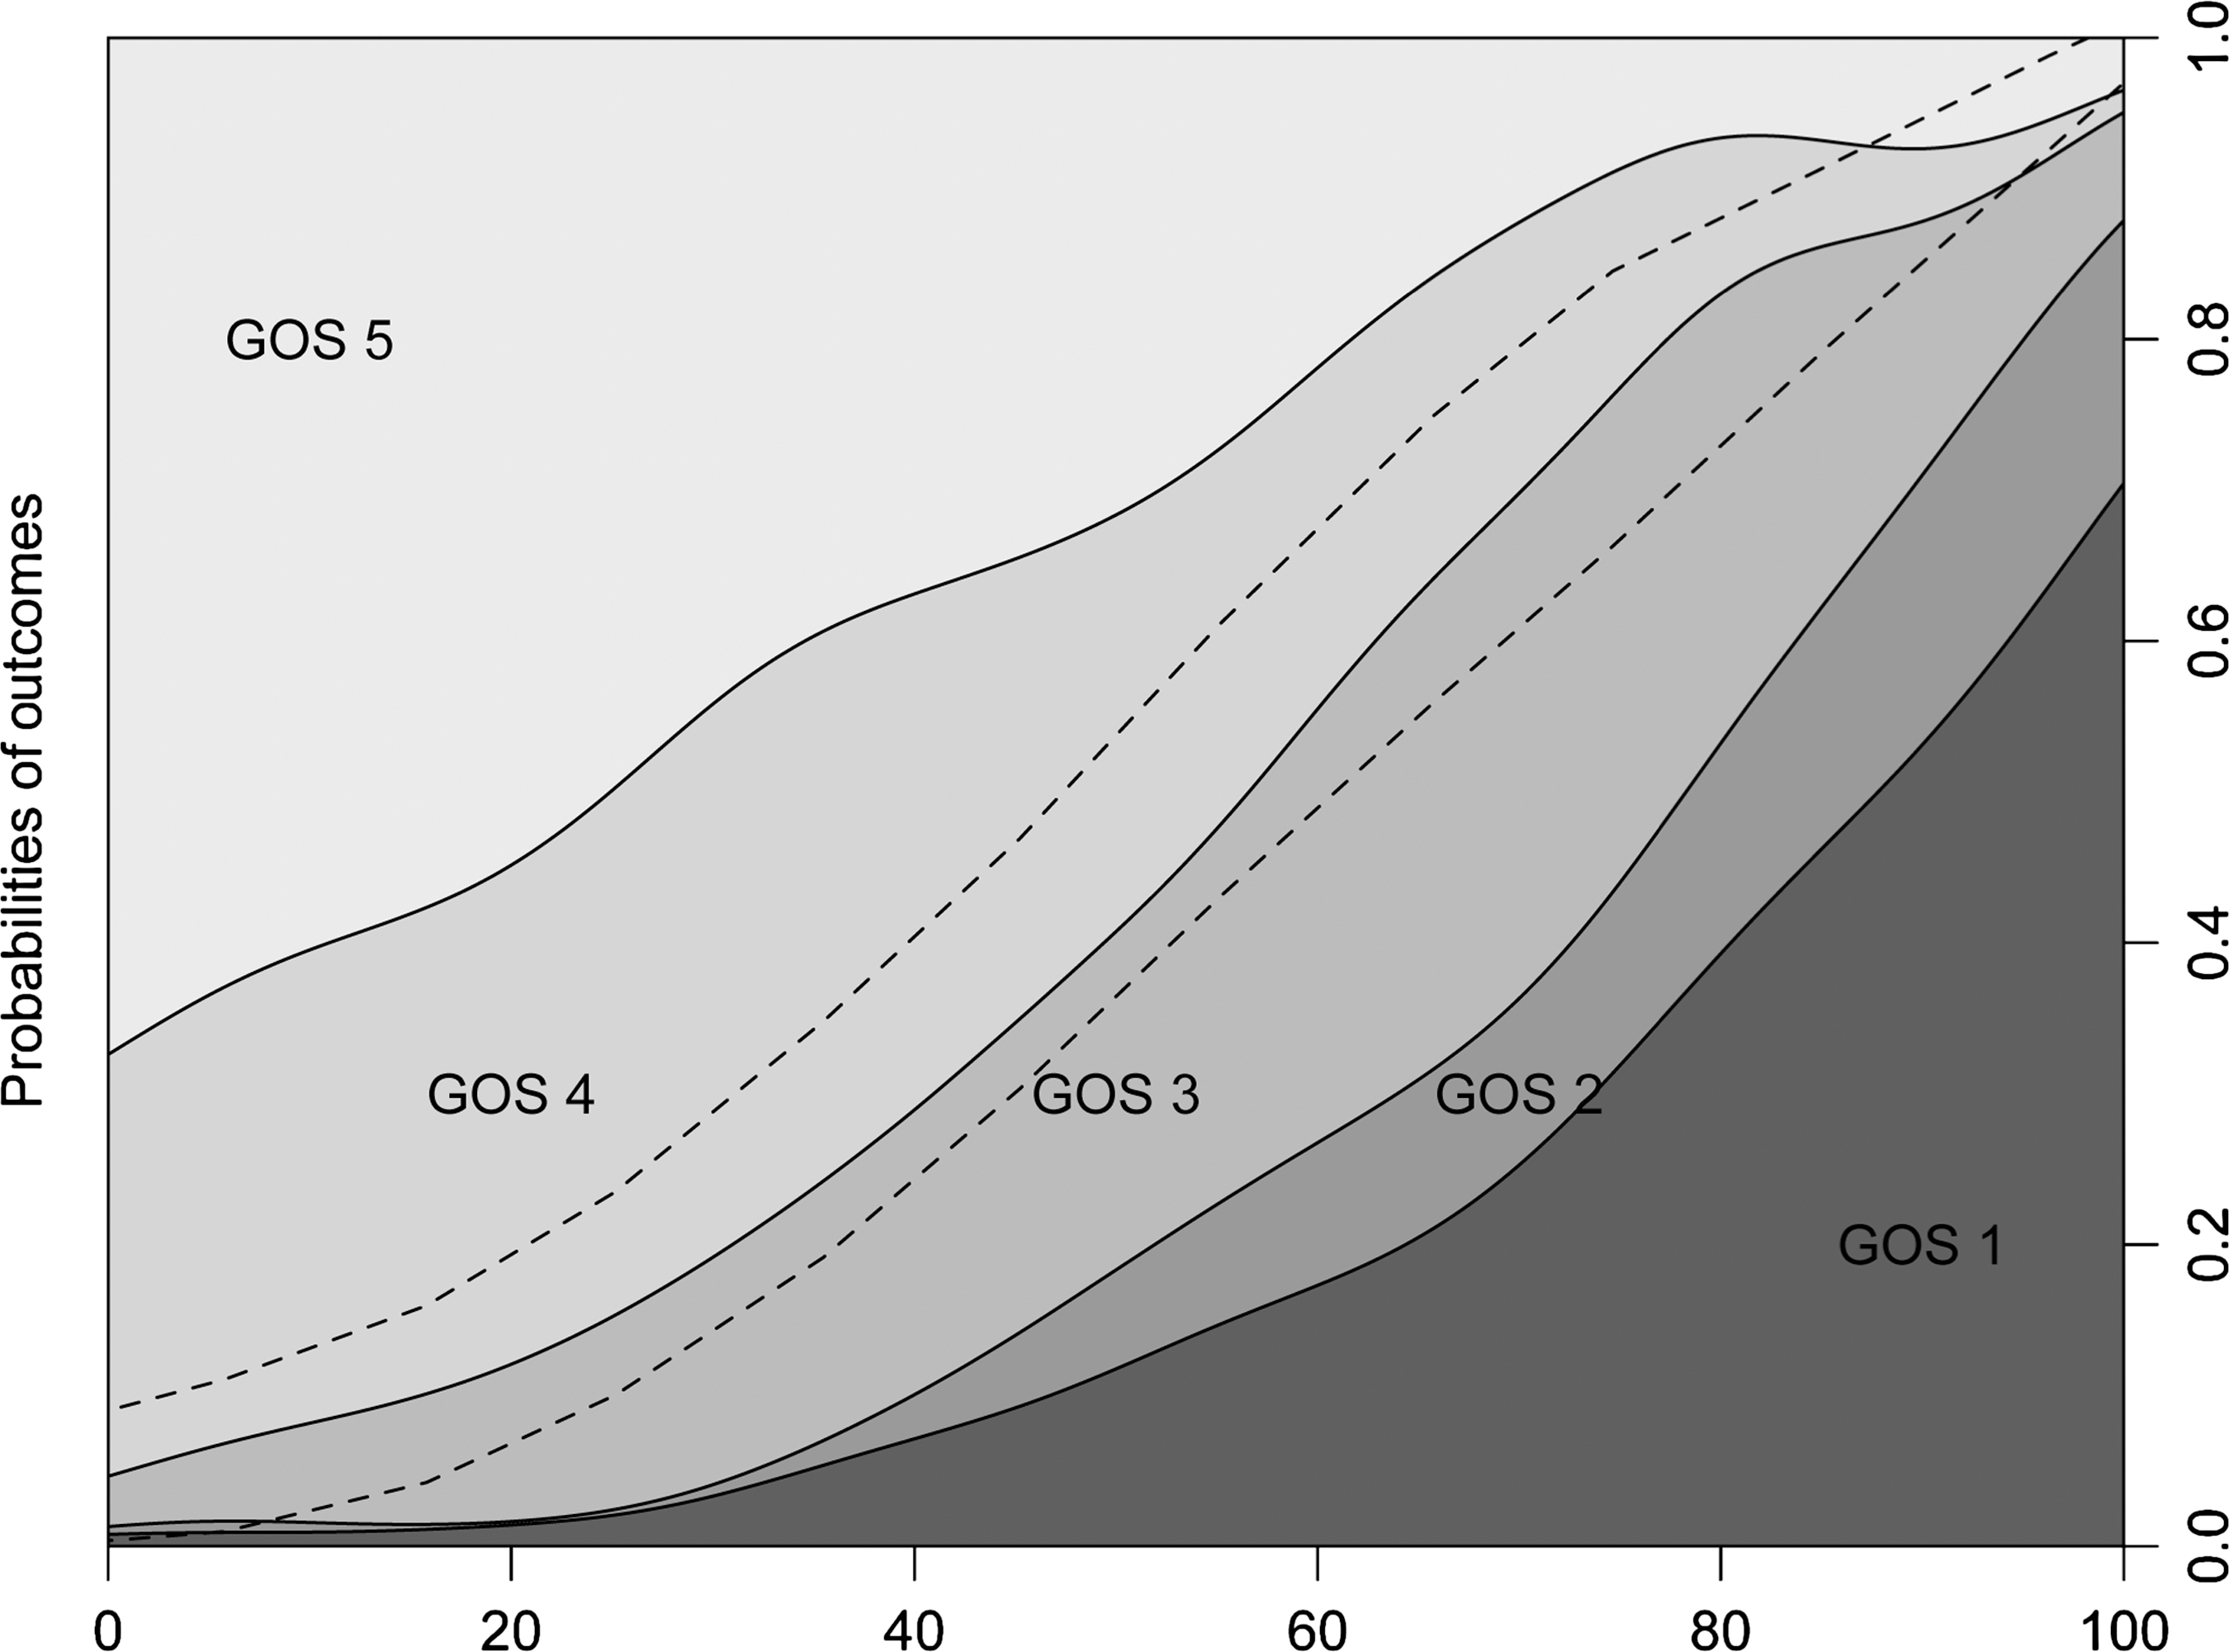
A practical clinical rule of thumb is derived from regression and translated into a linear representation for the sake of simplicity. The score is calculated with the equation: (age −3 * GCS + ML-shift [mm] + 10 rule), where the 10 rule is: +10 (if nonresponsive pupil[s]), +10 (if SAH/IVH), +10 (if DAI), −10 (if EDH), and yields an estimated probability of unfavorable outcome on the validation set (AUC = 0.86, R2 = 0.45, HL-gof p = 0.61). As this is a linear representation and no longer fitted to the logit scale of logistic regression, probabilities of <0 and >100 can be produced. Scores of <0 are interpreted as near zero prediction of an unfavorable outcome. A boot strapped estimated 95% confidence interval for this prediction is shown by the dashed lines.
Discussion
The main finding of this study is that a CT score is feasible using few parameters, where ML-shift, as a continuous variable, is the most important parameter for prediction of favorable or unfavorable outcome. A summed SAH/IVH-score is found to retain more information than SAH/IVH yes/no or a SAH thickness grading, per the Fisher (Fisher et al., 1980) or Greene (Greene et al., 1995) scores. The Stockholm score appears better suited for predicting favorable or unfavorable outcome than current scoring systems, and is comparable to the Rotterdam score in predicting survival. The Marshall score is found to be inferior. Much of the information content of parameters viewed on CTs are interrelated in a complex manner, and few are independent predictors of outcome. An important observation is that hematoma/contusion volume calculations, as used in the Marshall classification, appear redundant, as this information is highly correlated with that of ML-shift as a continuous variable (when not dual-sided). The dichotomization of ML-shift, as used by the Marshall and Rotterdam scores, appears to lose valuable information. ML-shift, as a continuous variable is in fact alone, a more accurate and better-calibrated univariate parameter, predicting both Dich-GOS and death versus survival, than the Marshall score (even in the GCS ≤ 12 subgroup). Adjusting for GCS, age, and pupil responses indicates, as in earlier studies (Murray et al., 2007), that much of the information in the CT scan is highly related to these variables. In our study, the contribution of CT information to clinical TBI outcome predictions is at best on the order of 6–10% additional estimated explained variance. This is in contrast to the estimated explained variance of 30–34% in the standalone CT models (Table 2). Finally, a practical clinical rule of thumb is derived, combining clinical and CT variables to predict probabilities of unfavorable outcomes.
The parameters reviewed on CT scans of TBI patients can, if generalized, be broken down into variable groups, pertaining to (1) volumes and locations of extracerebral and superficial hemorrhagic lesion types; (2) compression parameters and ML-shift; (3) SAH locations and grading; (4) white matter or deep traumatic lesions; and finally (5) fractures. Current scoring systems have identified the first three as significant, and modeling consistently recognizes components of these groups as important. The single most important variable predicting death in our study is compression of the basal cisterns, and this is in agreement with results of previous studies (Eisenberg et al., 1990; Maas et al., 2007). In contrast, the single most important parameter in predicting favorable versus unfavorable outcome in our study is ML-shift, as a continuous variable. This variable contains much information highly related to mass lesion volumes and compression variables. The importance of ML-shift as a continuous variable has previously been recognized (Eisenberg et al., 1990), but its utility in prediction models has, to our knowledge, not been explored. In contrast, locations and numbers of contusions cannot be shown to provide pertinent information about outcomes in this study, though this is counterintuitive and would appear to provide much of the information describing an “overall appearance.” This may in part be due to such sparse data in regions where incidence is low, which must therefore be condensed to larger areas and/or sides for analyses to converge. EDH is found, as in earlier studies (Maas et al., 2007), to be a positive predictor of outcome, even when adjusted for age, pupil responses, and GCS. The presence of SAH and/or IVH blood is, in accordance with the findings of others (Armin et al., 2006; Mattioli et al., 2003), consistently present as an independent predictor regardless of subpopulation or adjustment for age, pupil responses, or GCS. In addition, a summed score from the three locations has significantly more information content than scoring based on blood thickness gradings. Deep CT visible indicators of DAI are rare in our data, but provide distinct information that appears (with the exception of subcortical lesions) significantly related to outcome, though first in the multivariate setting. DAI has been shown to be related to outcome (Firsching et al., 2001; Mannion et al., 2007), but is reported to be CT-visible to only 20–50% (Gallagher et al., 2007), although these patients typically have more severe and disseminated DAI. Due to the low incidence of DAI in our data, including it in prediction models gives little extra explanatory power, but it appears to enhance model calibration. The existence of a fracture will signify a significant impact, but may be double-edged, as it could also reflect that energy has been absorbed by bone, and subsequently less by brain. The parameter any-fracture-or-intracranial-air was significant (data not shown) in a multivariate model predicting death, but added little to explained variance. As most are identified on non-bone windows, and few bone windows were provided, this may be underestimated. In summary, components of all five of these categories are found significant in outcome prediction, but may not be pertinent to models. Our most important finding is thus the principal value of ML-shift as a continuous variable in predicting favorable versus unfavorable outcome.
The relationship between large and reduced models is intricate. CT parameters were found to be highly interrelated, with much mutual information. Compression parameters are, for example, notably correlated to ML-shift, and become non-significant in logistic regression when ML-shift is present (including COMP-bas-cist). This would imply that they are not necessary to include in models. Despite this, compression parameters could, for example, provide information only when shift is less prominent, such as with dual-sided SDHs, or when compression is due to general swelling. It will be hard to capture and adapt to such interactions in a simple model, but the nearly identical performance of logistic regression and SVMs suggests that such effects are not of great importance. In addition, the incorporation of apparently redundant information pertaining to accuracy may enhance calibration, as it gives several modalities to identify and include pertinent information when interpreting CT findings. This could explain why a belief-like approach to parameter selection, trying to “cover” variable groups, may produce a model that appears more robust than the formal statistical reductions that are guided by accuracy performance. As this approach is inevitably data driven, it is important that such models are validated on external data sets. In aggregate, our study indicates that much of the information in CT scans pertaining to outcome can, to a large extent, be captured with relatively few variables. The final proposed Stockholm score is a complicated equation that needs to be subjected to external validation of and perhaps calibration of coefficients for other populations (Hukkelhoven et al., 2006; Mushkudiani et al., 2008; Perel et al., 2006).
Optimizing outcome prediction per se, including clinical parameters that are known to be strong indicators, such as age, pupil responses, and GCS, was not a primary goal of this study. Adjusting for these variables was done to evaluate the significance of CT parameters in their presence. Studies of TBI outcome have had varying results concerning the additional value of Marshall or CT classification (Hukkelhoven et al., 2005; Maas et al., 2007; Steyerberg et al., 2008; Wardlaw et al., 2002) in the presence of clinical parameters. Clinical parameters, most significantly age and GCS, exhibit unsurprisingly strong correlations with CT variables. The value of pupil responses is diminished in the presence of GCS. Age has a complicated relationship to CT data and different pathologies have clear age profiles, with frequencies of SDH increasing and frequencies of EDH and DAI decreasing with age. The added information provided by the CT scan, in addition to that of the clinical parameters, is small but significant in our study, with CT adding 6–10% estimated explained variance.
The choice of population will affect the accuracy of models, and to an extent the parameters chosen in model selection. TBI CT outcome studies have had different selected populations based on GCS cutoff points, mostly of GCS ≤ 8 (severe TBI) or GCS ≤ 12 (severe-to-moderate TBI). The Marshall classification was created with a severe TBI population, and outcome was death/survival. The inclusion criteria in the IMPACT database studies vary among the included studies. Our study population comprises a population of mild-to-severe TBI, with a mortality rate of 9.9%, and where 6% of scans show no pathology. The results of accuracy can thus not readily be compared with other scores. We have therefore reweighted the Marshall and Rotterdam score variables to our population to compare the choice of variables in their models to ours, indicating a better parameter selection of the Stockholm variables for Dich-GOS. In addition, the GCS 13–15 group in our study has an 8% bad outcome from TBI, suggesting that model development may benefit from analyzing a less-selected population when modeling favorable versus unfavorable outcome.
For early CT scoring, prior to intervention the Marshall score appears problematic. It has little predictive power and almost dichotomizes patients (Fig. 7) to categories II (diffuse swelling, basal cisterns present, and no mass lesion > 25 mL) and VI (non-evacuated mass lesion). As ML-shift is so highly correlated with lesion volumes, category IV (diffuse swelling, ML-shift > 0.5 cm, and no mass lesion > 25 mL) is seldom found, which is supported by other review studies (The Brain Trauma Foundation, 2000). In contrast to others, our diffuse injury category III (compressed or absent basal cisterns and no mass lesion > 25 mL) is also scant, as compression of basal cisterns is highly correlated with ML-shift in our data. This probably reflects that advanced diffuse swelling is a less common component of early CT scans in adult TBI, but it appears during progression. In addition, the differentiation of evacuated and non-evacuated mass lesions is ambiguous in an early CT scan. The Marshall score appears thus not to make efficient use of data for early prognostication, and the use of alternative scores seems necessary.
The adequacy of goodness-of-fit statistics for logistic regression and assessing model calibration is a matter of debate (Hosmer and Hjort, 2002). The Hosmer-Lemeshow-C statistic is the most widely used and accepted in the medical literature, though its value is questioned (Bertolini et al., 2000; Kramer and Zimmerman, 2007). It has been shown to be sensitive to sample size, cutoff points, and populations, and may be erroneous in the presence of interactions (Hosmer et al., 1997). Thus the results from this statistic must be judged accordingly. The conditional density plot (CD-plot) provides an intuitive representation of models that is easily clinically applied and can visually assess calibration (preferably on an external validation set). It must be noted that CD-plots inevitably (as the outcome variable is binary) have a certain smoothing effect.
A practical clinical score predicts the probability of an unfavorable outcome. It is easily remembered as: (age −3 * GCS + ML-shift [mm] + 10 rule), where the 10 rule is: +10 (if nonresponsive pupil[s]), +10 (if SAH/IVH), +10 (if DAI), −10 (if EDH), and yields a rule-of-thumb probability for adults. It must be recognized that the presented AUC is in relation to our severe-to-mild TBI population, and though it provides evidence of an adequate model, the levels of AUC cannot immediately be compared with prediction models from other TBI severity populations with different proportions of favorable and unfavorable outcomes. In addition, the score is a linear conversion and simplification of the contributing parameter weights (not utilizing the logistic transformation), and probabilities of <0 or >100 can therefore be produced. Negative probabilities should be interpreted as near zero for unfavorable outcome. Though the models are fit to model Dich-GOS (the line between GOS level 3 and 4 will be straight in a perfectly calibrated model), the relationships to other levels of GOS are apparent, showing relatively smooth functions. This suggests a good general relationship between GOS levels, identifying GOS as a surprisingly robust outcome parameter despite its simplicity.
Our protocol appears to capture much of the information on CTs pertaining to outcome, though it is still too complicated to be used conveniently clinically. This raises the possibility of protocols connected to web-based scoring systems, such as the on-line prognostic calculator of the IMPACT project (
We admit weaknesses in the study. The use of one person rating the CT scans offers consistency of interpretation, but could also introduce a systematic bias. A test of 50 scans reviewed by a second radiologist showed negligible differences, but it must be realized that this was done in-house, and interpretations are therefore more likely to be congruent. Another potential weakness is that we did not monitor progression of CT variables if the clinical condition did not lead to an additional CT within the first 24 hours. As up to 50% of lesions are observed to progress (Narayan et al., 2008) after TBI, this may be a component that could contribute in future scoring systems. An additional point of discussion is our best-GOS strategy. Though GOS is by consensus most often decided at 6 months, up to 41% change GOS scores after 3 months, and up to 22% after 8 months post-injury (Miller et al., 2005), predominantly to higher GOS levels. In addition, declines in GOS can often, in our opinion, be related to medical/ethical decisions concerning withholding treatment, and thus are less related to structural damage identifiable on CTs. We postulate that the best-GOS approach will be most strongly related to the structural findings on CTs of TBI patients, and will also minimize missing data, both advantageous elements in creating a consistent data set for analysis. We realize that this may affect the reproducibility of results in studies with GOS evaluated at one time point. Finally, our study is large for a one-institution project, but can no way attempt to compete with scoring systems weighted, calibrated, and verified on large multiple data sets, and it must be subjected to external validation. Our main contribution is in investigating the information and interdependencies in CT data. To this end a consistent, single institution database may be advantageous.
Conclusions
We have explored the information pertaining to outcome in 861 CT scans of patients with TBI, with both linear and non-linear methods. We have identified complex interactions and mutual information in many of the parameters. The reduction to a few parameters is possible, with little loss of accuracy. Variables predicting death differ from those predicting favorable versus unfavorable outcome. The most important parameter predicting favorable versus unfavorable outcome is the magnitude (in millimeters) of ML-shift, as a continuous variable. In fact, this parameter is by itself a better predictor and is better calibrated than the Marshall score, even in predicting survival. In addition, hematoma volumes are nearly co-linear with a continuous ML-shift and can be substituted for it. A SAH/IVH-score component is presented that adds significantly to model calibration, and appears advantageous over SAH thickness grading. A CT scoring system is suggested for Dich-GOS. CT parameters are found to add 6–10% additional estimated explained variance to prediction models over the strong clinical variables, age, GCS, and pupil responses. Finally, we present a simple clinical rule of thumb to predict the probability of unfavorable outcomes using clinical and CT variables.
Footnotes
Acknowledgments
Funding for this study was provided in part by the regional agreement on medical training and clinical research (ALF) between Stockholm County Council and the Karolinska Institutet, funds from the Karolinska Institutet, The Swedish Research Council, The Swedish Cancer and Traffic Injury Fund (CTRF)
Author Disclosure Statement
No author of this article has any financial conflict of interest regarding this publication.