
Abstract
The burden of acute traumatic spinal cord injury (TSCI) among U. S. children and adolescents was last described over a decade ago using inpatient data. We describe cumulative incidence, mortality, discharge disposition, and inflation-adjusted charges of childhood and adolescent TSCI in the U.S. using emergency department (ED) data from the Nationwide Emergency Department Sample (2007–2010). Patients ages 17 years and younger with a diagnosis of acute TSCI were identified using the International Classification of Diseases, Ninth Revision (ICD-9) diagnosis codes 806.* and 952.* (N=6132). The cumulative incidence of childhood and adolescent TSCI averaged 17.5 per million population per year. The median age at presentation was 15 years (interquartile range [IQR]=12-16) and the majority of patients were male (72.5%). The overall median new injury severity score (NISS) was 16 (IQR=9-27), remaining unchanged during the study duration (p=0.703). Children 5 years and younger were more likely to be injured from a road traffic accident (RTA; 50.9%), sustain C1-C4 injuries (47.4%), have more severe injury (median NISS=22; IQR=13-29), and concurrent brain injury (24%) compared to older children and adolescents, p<0.001. Firearms were implicated in 8.3% of injuries, of which 94.7% were among adolescents ages 13–17 years. Of the 35 TSCI-related ED deaths, 40% occurred among children ages 5 years and younger. 62.4% of patients required inpatient admission. Despite stable cumulative incidence and overall injury severity, ED treatment charge per visit increased on average $1394 from $3495 in 2007 to $4889 in 2010 (p=0.008). RTA-related TSCI disproportionately affects young children, while firearm-related TSCI is most common among adolescents. These findings inform TSCI prevention strategies. Prevention may be key in mitigating rising healthcare cost.
Introduction
I
The most recent national estimate of childhood and adolescent TSCI (19.9 per million population) utilizes inpatient discharge data from 1997 to 2000 and may include patients with late effects of TSCI as part of incidence calculations. 10 This approach potentially misclassifies cases and may provide an inaccurate estimate of the true burden of acute TSCI among children and adolescents in the U.S.
While the examination of inpatient discharge data assumes that all acute TSCI receive inpatient care, the use of ED records to assess acute TSCI regardless of trauma center level designation provides more informative estimates of the actual burden of acute TSCI. ED records include all patients with TSCI regardless of injury severity, a factor that may influence provider practice and patient preferences, including whether a patient is admitted into inpatient care. We utilized nationally representative ED visit data from the U.S. Government Healthcare Cost and Utilization Project (HCUP) to update the epidemiology and burden of childhood and adolescent TSCI at the level of the U.S. national population. As such, this is the first nationwide estimate of the burden of acute TSCI among U.S. children and adolescents at the point of initial care—the ED—following a traumatic incident.
Methods
Study design and setting
We utilized the Nationwide Emergency Department Sample (NEDS). 11 The NEDS, an administrative database, is the largest all-payer ED database from approximately 960 hospital-based EDs comprising 20% of all hospital-based EDs in the U.S. each year. A total of 28,584,301 ED visits, corresponding to a weighted total of 128,970,364 ED visits in the U.S. were captured in 2010, of which 25,511,069 (19.8%) were ages 17 years or younger. According to the NEDS study design, the 20% sample of U.S. hospital-based EDs are selected from strata defined by the four U.S. census regions, trauma center designation, urban/rural location, hospital teaching status, and ownership. States contributing data to the NEDS and population distribution by U.S geographic region are presented in Appendix A. 12 The NEDS design utilizes the complete list of American Hospital Association (AHA) community, non-rehabilitation hospital-based EDs as the target universe to calculate post-stratification hospital- and discharge-level weights that are assigned to each ED visit. The application of post-stratification discharge level weights in the current study provides estimates of ED visits that are representative of all U.S. ED visits, even from facilities that were not sampled from the target universe within each stratum. For each ED visit, up to 15 diagnoses can be reported using International Classification of Diseases, Ninth Revision, Clinical Modification (ICD-9-CM) diagnosis codes. The principal diagnosis is defined as the main reason that brings a patient to the ED. 11,12 The Institutional Review Board of the Johns Hopkins Hospital approved the study.
Study population
ED visits among patients ages 17 years and younger with non–birth-related TSCI from 2007 through 2010 were identified using ICD-9-CM diagnosis codes recorded in any of the 15 diagnosis fields (Appendix B). We included all children and adolescents with a principal diagnosis (main reason for ED visit) of TSCI. When TSCI was identified in diagnosis fields 2 to 15, only children and adolescents with an accompanying principal diagnosis of traumatic injury (ICD-9-CM codes 800.0-959.9) were retained in these analyses. Because patients with polytrauma carrying a principal diagnosis of other traumatic injury may have a secondary diagnosis of TSCI, our approach in selecting TSCI cases reduces the possibility of incomplete ascertainment. Likewise, patients with a principal diagnosis of viral pneumonia who carry a secondary diagnosis of TSCI are far less likely to have presented to the ED for acute TSCI but rather for viral pneumonia. Children and adolescents with diagnosis codes for birth trauma to the spine and spinal cord were excluded (ICD-9-CM 767.4).
Characterization of TSCI
We described level and severity of TSCI, spinal cord injury without radiologic abnormality (SCIWORA), paralysis, concurrent traumatic brain injury (TBI), overall injury severity using New Injury Severity Scores (NISS), and mechanism of injury. Level of TSCI was categorized as high cervical (C1-C4), low cervical (C5-C7), thoracic, lumbosacral, and multi-site/other/unspecified. We identified SCIWORA (952.0-952.9), incomplete versus complete TSCI (Appendix C), paraplegia versus quadriplegia (344.1 and 344.00-344.09), and concurrent TBI (800.0-804.9 and 850.0-854.1) using ICD-9-CM codes. We used the International Classification of Diseases Programs for Injury Categorization to generate the NISS, a composite score ranging from 1 to 75, and derived from the three most severe injuries in any region of the body. NISS has been extensively used for prediction of mortality following trauma. A higher score represents more severe injuries, hence higher risk of mortality. 13 –15 NISS has been shown to be a better predictor of mortality following trauma than the original Injury Severity Score (ISS). 16
Definitions for intent and mechanisms of injury provided by the Centers for Disease Control and Prevention Web-based Injury Statistics Query and Reporting System were utilized to evaluate ICD-9-CM external causes of injury codes. 13,17 Mechanisms of injury were grouped into falls, road traffic accidents (RTAs), firearm injuries, struck by other persons/objects, sports, and other mechanisms. Other mechanisms include injuries related to machinery, fire/burns, poisoning, overexertion, and adverse effects from medical/surgical care. Because of the small number of individuals for some mechanisms within specified age groups, we collated them to create a single category: “Sports/others” for patients age 0–5 years and “Firearm/others” for patients age 6–12 years, to adhere to HCUP reporting guidelines. Injury intent was classified as unintentional, deliberate self-harm (e.g., suicide, attempted suicide and other self-inflicted injuries), other intentional injuries (e.g., assault and injuries sustained during law enforcement arrests), and injuries of undetermined intent.
Patient demographics, hospital characteristics and outcome measures
Demographic variables included age, sex, median household income by patients' residential zip code, insurance status at the time of discharge, and the specific payer for treatment received. Age was categorized into four groups (≤5, 6–12, 13–15, and 16–17 years), as described in prior literature. 10,18 In this report, patients ages 13–17 years are referred to as adolescents. NEDS does not report information on race. Hospital characteristics include geographic region and urban-rural designation where the ED was located, trauma center level designation, and teaching hospital status. Three outcome measures were assessed: mortality in the ED, ED disposition, and total ED charges.
Statistical analysis
Discharge-level sampling weights were applied to begin the analysis. 12 Patient and hospital characteristics were described across all age groups. Counts and proportions are presented for categorical data and median and interquartile ranges (IQR) for continuous data. Statistical significance was evaluated at p<0.05 using chi-square and Fischer's Exact Test for categorical data, and analysis of variance for continuous data. We performed subgroup analyses describing selected demographic and injury characteristics for TSCI-related ED visits that resulted in death. The financial burden incurred to treat childhood and adolescent TSCI in the ED was described using mean charge per ED visit for fatal and non-fatal TSCI, from which we computed cumulative ED charges over the study duration in 2010 U.S. dollars adjusted for inflation. 19 We calculated annual cumulative incidence of childhood and adolescent TSCI as the total number of TSCI ED visits in each year, (excluding patients who were discharged to another acute care hospital to avoid the potential of double-counting patients who may have been transferred to another ED within the NEDS sampling frame, n=902), as a proportion of the total population of U.S. children and adolescents ages 17 years or younger for the same years. 20 Additionally, we estimated sex-stratified annual cumulative incidence and four-year cumulative incidence of childhood and adolescent TSCI. Sensitivity analyses were conducted comparing demographic factors, injury characteristics, and outcomes of children and adolescents with a principal versus secondary TSCI diagnosis. We examined the sub-population of patients who were discharged directly to home from the ED for their demographic and injury characteristics, as well as concurrent secondary diagnosis that accompanied their visit to the ED, where available. All analyses were conducted using STATA 12.0 (College Station, TX).
Results
Demographic and hospital characteristics
Of 6132 TSCI ED visits identified in these analyses, 72.5% were males and the median age was 15 years (interquartile range, IQR=12-16; Table 1). The male:female ratio was lower (1.2:1) in children ages 5 years and younger, compared to 3.7:1 among adolescents ages 16–17 years (Fig. 1). The majority of TSCI ED visits were at teaching hospitals (65.2%), at hospitals located in urban areas (87.0%), and in the southern (32.5%) and midwest (30.1%) U.S. regions. A total of 26.3% of childhood and adolescent TSCI were treated at non-trauma centers (Table 1).
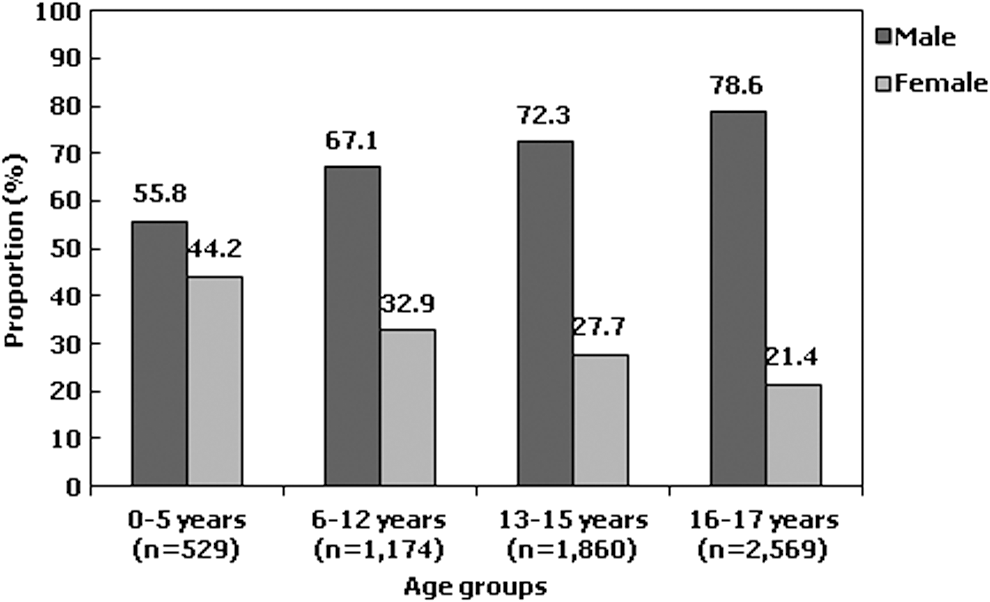
Age-specific gender distribution of childhood and adolescent traumatic spinal cord injuries, Nationwide Emergency Department Sample (2007–2010).
Counts may not add up to the total because of missing data.
Median and interquartile range.
Includes Worker's compensation, Civilian Health and Medical Program of the Uniformed Services, Civilian Health and Medical Program of Veteran Affairs, Title V, and other government programs.
Cumulative incidence of childhood and adolescent TSCI in the U.S
Between 2007 and 2010, an average 17.5 per million population per year ages 17 years and younger sought emergency treatment for acute TSCI in the U.S., representing 1308 new injuries per year. The annual cumulative incidence of TSCI was 20.0 per million population in 2007, compared with 15.2 per million population in 2010 (p=0.119; Fig. 2). The cumulative incidence of TSCI in males was approximately 2.4 times greater than females in 2007, and 2.8 times greater in 2010.
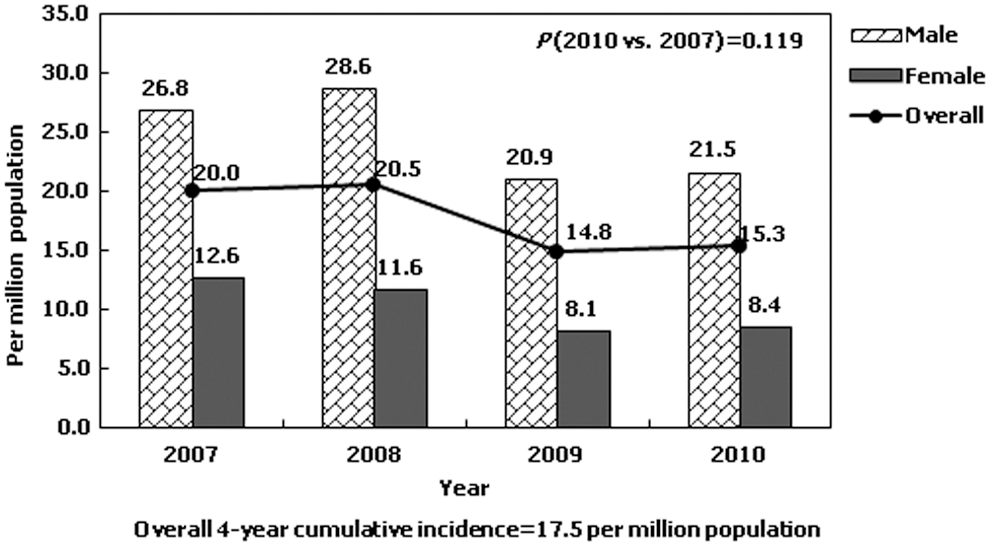
Annual incidence rates of childhood and adolescent traumatic spinal cord injuries stratified by gender, Nationwide Emergency Department Sample (2007–2010).
Age-specific visit and injury characteristics
Overall, cervical injuries were most common (19.8% high cervical and 20.7% lower cervical; Table 2). A total of 22.0% ED visits had no clearly defined level of injury recorded. SCIWORA and complete TSCI were identified in 54.8% and 9.7% of the study population, respectively. The overall median NISS was 16 (IQR=9-27) and 14.3% of TSCI-related ED visits had concurrent TBI. Median NISS remained unchanged between 2007 (16, IQR=10-27) and 2010 (17, IQR=9-27; p=0.703). The most common mechanism of injury was RTA (37.0%) followed by falls (20.4%). TSCI attributed to sports and firearm use occurred in 6.9% and 8.7% of ED visits respectively, while mechanism of injury was not specified in 7.0% of the study population (Fig. 3).
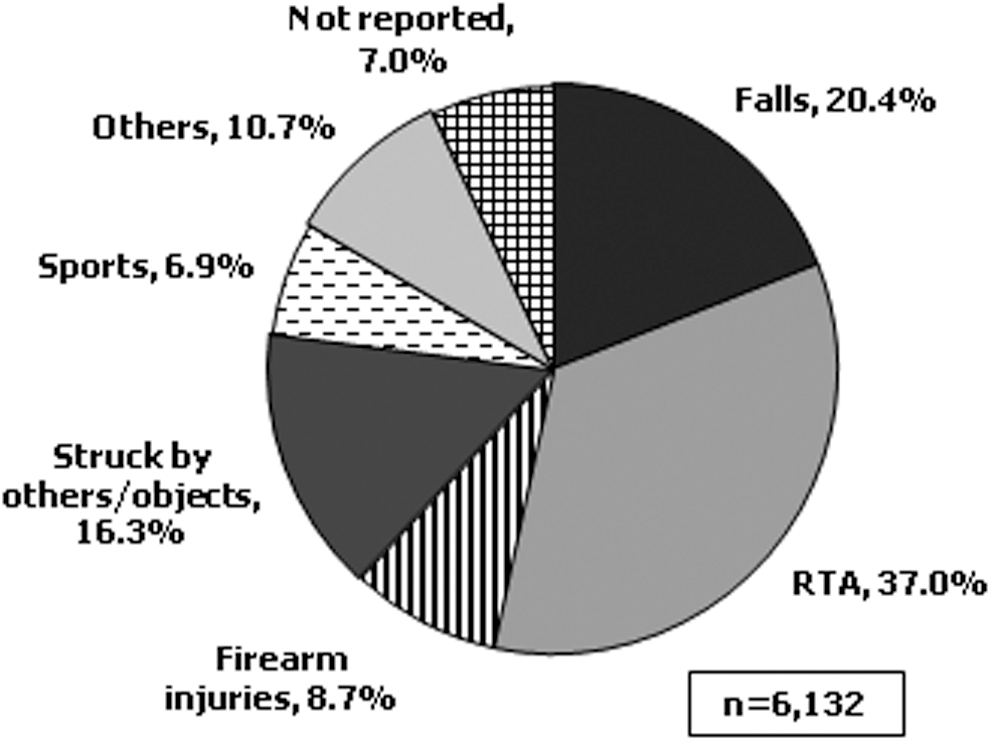
Mechanism of childhood and adolescent traumatic spinal cord injuries, Nationwide Emergency Department Sample (2007–2010).
Counts may not add up to the total because of missing data.
Includes assault and injuries sustained during law enforcement arrests.
A cell count of ≤10 is presented to adhere to reporting guidelines set by the Healthcare Cost and Utilization Project (HCUP) as privacy precaution.
ED, emergency department; SCIWORA, spinal cord injury without radiologic abnormality; TBI, traumatic brain injury; NISS, new injury severity score; RTA, road traffic accidents.
Children ages 5 years and younger had more severe injuries and were more likely to be injured from a RTA, sustain high cervical injuries, and experience concurrent TBI, compared to older children and adolescents ages 6–12, 13–15, and 16–17 years (all, p<0.001; Table 2). Complete injury was identified in 10.3% of children ages 5 years and younger.
RTA (30.2%) and falls (29.5%) were the two most common mechanism of TSCI in children age 6–12 years, with majority sustaining high cervical (21.1%) and thoracic level (21.5%) injuries. Complete injury was present in 5.4% of children age 6–12 years.
The prevalence of intentional injuries, both self-inflicted and inflicted by others, was lowest in children 12 years and younger. As age increased, the proportion of intentional injuries increased concomitantly, with self-inflicted injuries occurring mostly among adolescents age 16–17 years (Table 2). Of the total of 8.3% of firearm-induced TSCI, 70.2% were intentional injuries and 94.7% occurred among adolescents between ages 13 and 17 years.
Fatal injuries
Thirty-five children and adolescents (0.6%) with TSCI died in the ED; most were male (62.5%), were injured from RTA (88.6%), and succumbed to cervical injury (74.3%). Forty percent of ED deaths were among children ages 5 years and younger. The median NISS for fatal injuries was 27 (IQR=9-42), 11 points higher than the median NISS in non-fatal injuries (16, IQR=9-27) though not statistically significant (p=0.239).
Discharge disposition and total ED charges
In total, 62.4% of children and adolescents presenting to U.S. EDs with acute TSCI were admitted directly for inpatient care, 20.1% were discharged home, and 1.8% were discharged directly to a chronic care or rehabilitation facility (Fig. 4).
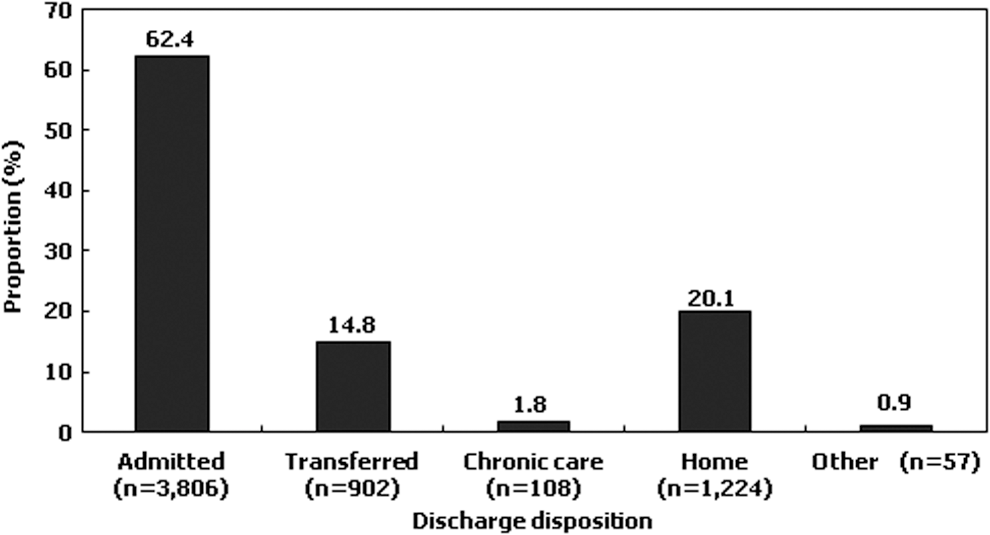
Emergency department discharge disposition among traumatic spinal cord injured children and adolescents, Nationwide Emergency Department Sample (2007–2010).
Compared with patients who were not discharged home, patients who were discharged home directly from the ED were more likely to present to the ED on a weekday, to an ED located in a rural area, a non-teaching hospital-based ED, and a non-trauma center (all, p<0.001; Table 3). Patients discharged home were less likely than patients who were not discharged home to have been injured from an intentional cause, sustained an RTA or firearm injury, and have lower injury severity (all, p<0.001). Frequent accompanying secondary diagnoses among patients who were discharged home were sprains and strains, disturbance of skin sensation, concussion, SCIWORA, and injury to face, head, and neck.
Counts may not add up to the total because of missing data.
Includes assault and injuries sustained during law enforcement arrests.
A cell count of ≤10 is presented to adhere to reporting guidelines set by the Healthcare Cost and Utilization Project as a privacy precaution.
TSCI, traumatic spinal cord injury; ED, emergency department; RTA, road traffic accidents; SCIWORA, spinal cord injury without radiologic abnormality; TBI, traumatic brain injury; NISS, new injury severity score.
The average ED-related charge incurred per visit between 2007 and 2010 was $4133 (95% CI: $3765-$4504) for non-fatal injuries and $12,903 (95% CI: $6059-$19,746) for fatal injuries (p<0.001; Table 4). The average charge for non-fatal injuries increased from $3495 (95% CI: $2952-$4039) in 2007 to $4889 (95% CI: $4023-$5756) in 2010 (p=0.008). Overall cumulative ED charge incurred to manage acute TSCI (fatal and non-fatal) in U.S. EDs amounted to $25.7 million over the study duration. In 2010, the average inflation-adjusted total ED-related charge incurred per visit was significantly greater than that in 2007 by $1394.
Annual cumulative charge=(a * N)/4
p<0.001 comparing average charge per visit among patients who died in the ED versus those who were discharged alive.
p=0.008 comparing average charge per visit for the treatment of children with acute traumatic spinal cord injuries who were alive at discharge in 2010 versus 2007.
Average charge per visit for individual years among patients that died in the ED were not calculated because of small sample sizes in individual years.
Sensitivity analyses
Child and adolescent ED visits with a secondary diagnosis of TSCI totaled 1499 (24.4%) cases. There was no difference in the distribution of age, gender, income quartile, insurance status, ED visit timing, and hospital characteristics comparing patients with principal versus secondary diagnosis of TSCI (Table 5). However, patients with a secondary diagnosis of TSCI had higher median NISS (22, IQR=13-29 vs. 13, IQR=9-24), were more likely to present with high cervical TSCI (22.1% vs. 19.0%) have intentional injuries (16.2% vs. 6.4%), and to be injured in a RTA (41.1% vs. 32.3%) or from firearm use (17.2% vs. 5.6%), compared with patients with a principal diagnosis of TSCI (all, p<0.01). Fewer patients with a secondary diagnosis of TSCI had complete spinal cord injuries. While there was no difference in mortality, compared with patients carrying a principal diagnosis of TSCI, patients with a secondary diagnosis of TSCI were more likely to be treated at a trauma center (77.7% vs. 72.4%; p=0.044) and to be admitted for inpatient care (71.4% vs. 59.5%; p<0.001), further suggesting that a secondary diagnosis of TSCI sufficiently captured acute traumatic injuries.
Counts may not add up to the total because of missing data.
Median and interquartile range.
Includes Worker's compensation, Civilian Health and Medical Program of the Uniformed Services, Civilian Health and Medical Program of Veteran Affairs, Title V, and other government programs.
Includes assault and injuries sustained during law enforcement arrests.
A cell count of ≤10 is presented to adhere to reporting guidelines set by the Healthcare Cost and Utilization Project as a privacy precaution.
Includes skilled nursing facilities, intermediate care facilities, and home health care programs.
Includes “AMA, Against medical advice,” “transferred to court/ law enforcement,” as well as “discharged alive, but destination unknown.”
TSCI, traumatic spinal cord injury; ED, emergency department; RTA, road traffic accident; SCIWORA, spinal cord injury without radiologic abnormality; NISS, new injury severity score.
Discussion
Between years 2007 and 2010, for every one million children and adolescents in the U.S., an average 17.5 children and adolescents presented to the ED with acute TSCI. This represents 1308 child and adolescent ED visits per year for acute TSCI, with annual ED charges totaling $6.4 million. Throughout the study period, a total of 3806 child and adolescent patients (62.4%) with acute TSCI were admitted to inpatient care from the ED, with 35 (0.6%) ED deaths.
Our findings of TSCI cumulative incidence of 17.5 per million population per year is lower than the 19.9 per million population per year previously reported by Vitale and colleagues from an analysis of the 1997–2000 Kids' Inpatient Database. 10 Our estimates are however higher than the incidence of childhood and adolescent TSCI, 4.6 per million population reported in Sweden between 1985 and 1996, and 11.0 to 14.0 per million population reported in Coimbra, Portugal between 1989 and 1992. 21,22
In our study, on average, 952 children and adolescents (62.4%) per year were admitted for inpatient care from the ED. 10 Our epidemiological approach presents a better estimate of the burden of acute childhood and adolescent TSCI. First, TSCI cumulative incidence calculations were derived from ED utilization and have the advantage of including patients who are not admitted to inpatient care. Although persons discharged from the ED were less likely to have sustained a complete spinal cord injury, concurrent TBI, or SCI with radiologic abnormality, proportionately more patients presented to a non-trauma center, and without insurance which could have influenced the decision for discharge. Patients also may have been discharged against medical advice, a category that could not be analyzed as a line item in adhering to HCUP reporting guidelines of very rare events. It is also possible that during the acute phase of injury, some persons with TSCI may be discharged because they experience improvement in neurological deficits, such as with a neurapraxia. In the future, it will be worth examining the outcomes of persons who were discharged from the ER following admission for TSCI.
Second, our inclusion criteria limited TSCI to only acute injuries based on ICD-9-CM codes 806.* and 952.*. This is in contrast to findings from Vitale and colleagues, which included ICD-9-CM code 907.2, representing late effects of spinal cord injury (SCI). 10 By excluding a diagnosis of late effects of TSCI, we limit the possibility of including patients with remote TSCI in incidence calculations. Additionally, we performed a sensitivity analysis to ensure that we did not include remote TSCI in incidence calculations. Third, we avoided double-counting patients who had been transferred from the ED to another acute care hospital because of the potential that they were subsequently admitted to another ED in the NEDS sampling frame. These, and the absence of data in the NEDS pertaining to pre-hospital deaths, may suggest that our current findings are a conservative estimate of the true burden of childhood and adolescent TSCI in the U.S.
The annual cumulative incidence of childhood and adolescent TSCI in the U.S. remained fairly stable over the study duration. This is in contrast to non-age-specific reports suggesting a rise in overall TSCI incidence in the U.S. 4,23 –26 We recently reported increasing annual cumulative incidence of adult TSCI among person's ages 65 years and older. 3
Despite fairly stable annual cumulative incidence, the average treatment charge per ED visit increased steadily between 2007 and 2010, even after accounting for the cost of inflation. Assuming a constant child and adolescent TSCI incidence rate through to 2017, we estimate that approximately $12 million in ED charges would be incurred to treat acute TSCI in 2017.
Concurring with previous studies, the male-to-female distribution of TSCI is fairly balanced in younger children; however, with increasing age, male predominance becomes more apparent. 10,18,26,27 At age 16 to 17 years, for every female, there were four males injured with TSCI (Fig. 2). Similar to prior reports 5,6,10,18,27,28 RTAs remain the most common cause of TSCI and are more commonly implicated in children 5 years and younger (50.9%) but less so in children 6–17 years (25.9%–39.2%). Older children (13–17 years) are more likely to have intentional injuries from assaults and firearms. Assault and firearm-induced TSCI, especially among adolescents, has been on the increase since the mid-1990s. 5,29 –31 In this study, 25% of all TSCI was a result of firearm use or being struck by others/objects.
Significantly more children age 5 years and younger sustained high cervical injuries, complete TSCI, concurrent TBI and greater median NISS scores, compared with older children. Prior studies report similar injury patterns and trends. 5,8,10,18,31 –33 Several hypothesis have been reported for this observation. Back seat failure and improper head/body restraint in car seats are common causes of whiplash injuries, particularly in rear end collisions. 34,35 The cervical spine above C4 in children younger than 8 years has been shown to be anatomically and biomechanically different than the mature adult spine. Hyperlaxity of ligamentous attachments and musculoskeletal constituents, incomplete ossification, a larger head-to-torso ratio are among factors that predispose young children to high cervical injuries even after low impact rear-end collisions. 5,7,31,32,36
Among adolescents ages 16–17 years, the median NISS was 18, representing severe injuries, with 40.0% involved in a RTA. Although TBI rates were not as high as that seen in children 5 years and younger, reports suggest that the use of lap-shoulder belts in older children predisposes them to thoracic level injuries and consequent intra-thoracic and intra-abdominal injuries, which may be driving the composite NISS score and represents multiple severe injuries. 33 –35 More research is necessary to understand how to maximize the safety potential of car seats, seatbelts, airbags and road safety laws so that these injuries can be avoided among road users of all ages.
Children ages 6–12 years were least affected by intentional injuries. In addition to RTA, falls, being struck by others/objects, and sports were common causes of TSCI in this age group. Targeted research in this age group is necessary to understand how, why, and when these injuries occur. Educating parents, teachers and peers on prevention strategies and how to handle potential TSCI-injured children may minimize avoidable neurological sequelae.
Besides optimizing injury prevention strategies, it is vital to ensure that, once injured, patients are getting to the appropriate level of care immediately. Characterized as major trauma, TSCI treatment protocols recommend that all patients with potential TSCI be treated at a Level I trauma center. 37 We determined that up to 25.0% of injuries were managed at a non-trauma center and 14.7% required transfers to another acute care hospital. An acutely injured spinal cord runs the risk of further neurologic deterioration resulting from secondary injuries to the spinal cord. 38 A common cause of secondary injury is inadvertent movement of the spinal cord, which could arise during transport from one center to another. Besides potentially exposing the patient to additional movement, hospital transfers cause a delay in administering definitive care and may predispose patients to worse outcomes. 37 –39 Further research is necessary to understand the reasons why as many as 25.0% of acute TSCIs in children and adolescents are managed in non-trauma centers and how this affects patient outcomes.
Limitations associated with these analyses are associated primarily with use of administrative databases in research. Detailed clinical and social histories necessary to provide a more comprehensive assessment of TSCI characteristics, such as drug history or exact mechanisms by which a fall or RTA took place, are not available in administrative databases. Further, comprehensiveness and quality of information present in the database relies on accuracy of physician reporting and data entry. 40 Complete versus incomplete TSCI was determined by ICD-9-CM codes. Although American Spinal Injury Association Impairment Scale (AIS) scores 41 are necessary to describe the degree of functional impairment following SCI, NEDS does not collect this information nor is the procedure of assessment of complete versus incomplete TSCI made by each ED physician reported. Because of the progressive nature of neurologic injury at onset, the challenges associated with AIS evaluations in young children, 42 and the availability of physicians trained to evaluate SCI in the ED, ICD-9-CM code determination of injury severity in the ED may be misclassified. To enhance the true ascertainment of SCI severity, we encourage NEDS to implement the ascertainment and collection of AIS classification for persons presenting to EDs with SCI. This information will provide a more accurate burden of injury severity and help make appropriate worldwide comparisons.
The main strength of this analysis is the utilization of a representative sample of all U.S. ED visits regardless of trauma center level designation to estimate the incidence of childhood and adolescent TSCI. Findings from this study provide updated objective national estimates of the burden of acute childhood and adolescent TSCI and may serve as a benchmark for future studies.
In conclusion, an average of 1308 children and adolescents in the U.S sustained TSCI each year over the study duration. Although cumulative incidence rates and overall injury severity held fairly steady during the study period, average ED charge per visit increased. RTAs remain the leading cause of non-fatal and fatal TSCI, disproportionately affecting children 5 years and younger, while intentional assaults including firearm-related TSCI are most common among adolescents. TSCI prevention is of paramount importance. Findings from this study may help policymakers and stakeholders understand the current burden and characteristics of acute TSCI among children and adolescents, which is necessary to ensure optimal resource planning for health care prevention, treatment and rehabilitation.
Footnotes
Author Disclosure Statement
No competing financial interests exist.
Appendix
| ICD-9 Code | ICD-9 code description a |
|---|---|
| 806.01 | C1-C4 closed fracture with complete lesion of cord |
| 806.06 | C5-C7 closed fracture with complete lesion of cord |
| 806.11 | C1-C4 open fracture with complete lesion of cord |
| 806.16 | C5-C7 open fracture with complete lesion of cord |
| 806.21 | T1-T6 closed fracture with complete lesion of cord |
| 806.26 | T7-T12 closed fracture with complete lesion of cord |
| 806.31 | T1-T6 open fracture with complete lesion of cord |
| 806.36 | T7-T12 open fracture with complete lesion of cord |
| 806.61 | Closed fracture of sacrum and coccyx with complete cauda equina lesion |
| 806.71 | Open fracture of sacrum and coccyx with complete cauda equina lesion |
| 952.01 | C1-C4 level complete spinal cord injury without evidence of spinal bone injury |
| 952.06 | C5-C7 level complete spinal cord injury without evidence of spinal bone injury |
| 952.11 | T1-T6 level complete spinal cord injury without evidence of spinal bone injury |
| 952.16 | T7-T12 level complete spinal cord injury without evidence of spinal bone injury |
| 952.4 | Cauda equina syndrome without evidence of spinal bone injury |
ICD-9 code descriptions are standard descriptions based on the World Health Organization's International Classification of Diseases, Ninth Revision.1
1. Classifications of Diseases, Functioning, and Disability [Internet]. Hyattsville (MD): National Center for Health Statistics; [updated 2010 Jan 04; reviewed 2009 Sep 1]. International Classification of Diseases, Ninth Revision, Clinical Modification (ICD-9-CM). Available at: