
Abstract
The Quality of Life after Brain Injury (QOLIBRI) instruments are traumatic brain injury (TBI)-specific assessments of health-related quality of life (HRQoL), with established validity and reliability. The purpose of the study is to help improve the interpretability of the two QOLIBRI summary scores (the QOLIBRI Total score and the QOLBRI Overall Scale [OS] score). An analysis was conducted of 761 patients with TBI who took part in the QOLIBRI validation studies. A cross-walk between QOLIBRI scores and the SF-36 Mental Component Summary norm-based scoring system was performed using geometric mean regression analysis. The exercise supports a previous suggestion that QOLIBRI Total scores <60 indicate low or impaired HRQoL and indicate that the corresponding score on the QOLIBRI-OS is <52. The percentage of cases in the sample that fell into the “impaired HRQoL” category was 36% for the Mental Component Summary, 38% for the QOLIBRI Total, and 39% for the QOLIBRI-OS. Relationships between the QOLIBRI scales and the Glasgow Outcome Scale–Extended (GOSE), as a measure of global function, are presented in the form of means and standard deviations that allow comparison with other studies, and data on age and sex are presented for the QOLIBRI-OS. While bearing in mind the potential imprecision of the comparison, the findings provide a framework for evaluating QOLIBRI summary scores in relation to generic HRQoL that improves their interpretability.
Introduction
T
A brain injury reference group is described by Truelle and associates 2 for the 37-item QOLIBRI, but guidance on what constitutes a high or low HRQoL score is limited. Truelle and associates 2 conducted receiver operating characteristic (ROC) analysis and found that the optimum cut-point on the QOLIBRI Total score for identifying probable emotional distress on the Hospital Anxiety and Depression Scale (HADS) was <60. This provides a potential criterion for defining low HRQoL, but it lacks corroboration from other sources. Further, as yet, there is no guidance on a corresponding value for the QOLIBRI-OS and no patient reference data for the latter scale comparable to that provided for the full 37-item QOLIBRI by Truelle and associates. 2
One way to improve the interpretability of the QOLIBRI scores would be through collection of a normative sample from the general population. 7 Acquiring good normative data from a representative sample of the population, however, requires substantial effort and resource. In common with many popular TBI assessments, a large-scale cross-national norming exercise has not been undertaken for the QOLIBRI instruments. The aim of the present study is to explore an alternative approach—that is, whether cross-walking the QOLIBRI summary scores and the Short Form 36 (SF-36) norm-based scoring system can assist interpretation of the TBI-specific measures.
Mapping exercises, also known as “cross-walking,” attempt to estimate the relationship between different scales that share a common underlying construct. For example, mapping generic measures of HRQoL, such as the EQ-5D or SF-36, to disease-specific HRQoL instruments has been widely applied to estimate health utilities for the latter. 8 Another potential use of linking is to allow comparison with the extensive normative data available for generic HRQoL scales such as the SF-36.
The SF-36 is a patient reported assessment of HRQoL, consisting of eight subscales, originally developed for the Medical Outcomes Study. 9 Two global scores can be calculated for the SF-36—the Mental Component Summary (MCS) and the Physical Component Summary (PCS)—that are converted to T-scores using normative data. A second version, the SF-36v2, was developed with alterations to some of the wording and response options, but which shares the overall structure and norm-based scores of the original. 10
Previous work indicated that the SF-36 MCS was more strongly related to QOLIBRI Total than the PCS (r = 0.61 and r = 0.49, respectively), 1 Further, evidence was presented that the information contained in the MCS is captured fully by the QOLIBRI. 1 Studies in persons with TBI using the SF-36 have generally, though not always, found lower MCS scores than PCS scores, 6 suggesting that the MCS is more sensitive to health changes subsequent to TBI. Thus, the MCS represents a generic measure of HRQoL that is particularly relevant to TBI. Normative datasets have been collected for the SF-36 family of scales, including a large norming exercise in 1998 that included both the original SF-36 and the revised SF-36v2. 10
The aim of the current project was to study the relationship between the QOLIBRI summary scores and norm-based scores from the MCS of the SF-36 and consider whether this can aid interpretation of scores from the QOLIBRI. We also wished to develop an algorithm for translating between the two QOLIBRI summary scores and present patient data that would be useful for interpreting scores on the QOLIBRI-OS.
Methods
Patient population
We analyzed data that was originally collected for the development of the QOLIBRI scale and has been the subject of previous reports. 3,11 Participants were primarily recruited as a convenience sample, and the majority were either currently receiving brain injury rehabilitation (32%) or had done so in the past (49%). The dataset consisted of 795 participants followed up between 3 months and 15 years post-injury, collected from nine countries including six languages (Dutch, English, Finnish, French, German, and Italian). Methods of data collection have been described in detail previously. 11
Current analyses were conducted on a subset of 761 participants with complete data on the SF-36 and QOLIBRI scales. Demographics and clinical descriptors for this group are given in Table 1 and indicate a very close match with the larger sample. The three European educational categories given in the table correspond to school, vocational education, and college in the United States. The mean age of the sample was 38.3 years (standard deviation [SD] = 13.4). Participants were assessed by self-report (by mail or at a meeting) or by interview (telephone or face-to-face).
GCS, Glasgow Coma Scale.
Inclusion criteria for the study: 17 years old or more at the time of assessment (and a minimum of 15 years old at injury), diagnosis of TBI on International Statistical Classification of Diseases and Related Health Problems (ICD-10), and able to give informed consent and cooperate and answer questions. Exclusion criteria: Glasgow Outcome Scale–Extended (GOSE) <3, spinal cord injury, the presence of a significant current or pre-injury psychiatric condition (such as psychosis or severe depression) or ongoing severe addiction, terminal illness. Investigators obtained in-country ethics approval, and consent was given by all participants in keeping with local procedures.
Measures
The QOLIBRI is a 37-item HRQoL scale consisting of four subscales assessing satisfaction with aspects of life (cognition, self, daily life and autonomy, and social relationships) and two subscales that concern how bothered the person is by difficulties (emotions, and physical problems). 1 Responses are made on a 5-point scale from “Not at all” to “Very” and assigned values from 1 to 5.
The QOLIBRI Total score (maximum = 100) was calculated by first reversing the coding for the “bothered” items. The mean was then computed for the items provided that no more than 12 of the 37 possible responses were missing. Percent scores were created by subtracting one from the mean and then multiplying by 25; for example, a mean item score of 3.4 would be converted arithmetically as (3.4-1.0)*25 = 60. QOLIBRI-Total scores range from 0 (worst HRQoL) to 100 (best HRQoL), and test-retest reliability is r = 0.91.
The QOLIBRI-OS is designed as a short-scale to provide a single overall summary score for HRQoL. The instrument consists of six items assessing overall satisfaction with life (physical condition, cognition, emotions, function in daily life, personal and social life, and current situation and future prospects). 3 The scale uses the same response options as the full 37-item QOLIBRI. The QOLIBRI-OS score (maximum = 100) was calculated by computing the mean for the six items, provided that no more than two responses were missing, and converting this to a percent score by subtracting one and then multiplying by 25. QOLIBRI-0S scores range from 0 to 100, and test-retest reliability is r = 0.81.
Generic HRQoL was assessed using the SF-36 Health Survey
12
and summarized as MCS and PCS scores. The majority of data was collected using the original version of the SF-36 and in one country using the SF-36v2 (N = 62). SF-36 raw scores were converted to MCS and PCS T-scores using a linear transformation based on the 1998 norms (
Ware and coworkers 10 provide the following interpretation of norm-based scores on the SF-36: scores of 45–55 are considered within the average range, scores between 40 and 44 are considered borderline, while scores below 40 are considered impaired. In addition, Ware and coworkers 10 propose that for group comparisons, a mean score more than 0.3 SD below the population mean—i.e., <47—should be considered outside the average range.
Demographic and clinical information were collected at interview and from case notes (including date of injury, cause of injury, site of major lesion on neuroimaging, and the worst GCS score in the first 24 h). Functional outcome was rated by interview on the GOSE. 13 Other measures administered at the same time are described elsewhere. 1
Statistical approaches
Univariate descriptors and histograms of continuous variables were examined, and values of skewness and kurtosis were calculated as a check that parametric statistics were appropriate. The data from the QOLIBRI scales are presented here primarily as means (together with SDs) or as scatterplots with individual values. Relationships between variables and other information described in previous QOLIBRI studies are presented here in a form that is intended to be of practical value for interpretation.
The most common method used for mapping continuous scales in the health utility field has been ordinary least squares regression (OLS). 8 A conceptual drawback, however, is that OLS does not produce the same mapping from one scale to another when the X and Y variables are exchanged. 14 Geometric mean (GM) regression avoids this problem 14 and is appropriate when the aim is to link two scales, both of which are assumed to contain error. 15 GM regression is a method for describing symmetric relationships (i.e., correspondence between scales) and is not intended for prediction (i.e., estimating the likely score of an individual on one scale given a score on another). The 95% confidence intervals for regression parameters were estimated by bootstrapping.
Results
Descriptive statistics for the SF-36 MCS and QOLIBRI scales are given in Table 2. Visual inspection of score distributions indicated that they were modestly skewed toward higher scores. The variables, however, each have acceptable values for skewness and kurtosis, and the scores were analyzed untransformed. The mean for the MCS was 43.5 (SD = 12.1), showing that the group as a whole had below average HRQoL on the generic HRQoL measure.
SF, short form; MCS, mental component summary; QOLIBRI, Quality of Life after Brain Injury-Overall Scale.
On the other hand the SF-36 PCS was 48.7 (SD = 9.8) and lies in the average range. The sample mean for the QOLIBRI Total was 65.0 (SD = 18.0) and for the QOLIBRI-OS was 58.4 (SD = 21.3). As noted previously, the MCS had substantial bivariate relationships with the QOLIBRI Total (r = 0.61, p < 0.001), and the QOLIBRI-OS (r = 0.55, p < 0.001), and the two QOLIBRI summary scores showed a strong correlation with one another (r = 0.87, p < 0.001).
Scatterplots are shown in Figures 1 and 2 for MCS and the QOLIBRI scales with lines of best fit from geometric mean regression. We examined distributions of residuals from the regression and conducted analyses both with and without outliers (>3 z) to determine whether these were having an undue influence on results. There was little or no difference in parameter estimates, and the complete dataset was therefore used for analyses. Quantile-quantile plots were examined to identify whether there was heteroscedasticity (i.e., unequal variance across the range of values) or nonlinear relationships, and no evidence was found of departure from assumptions.
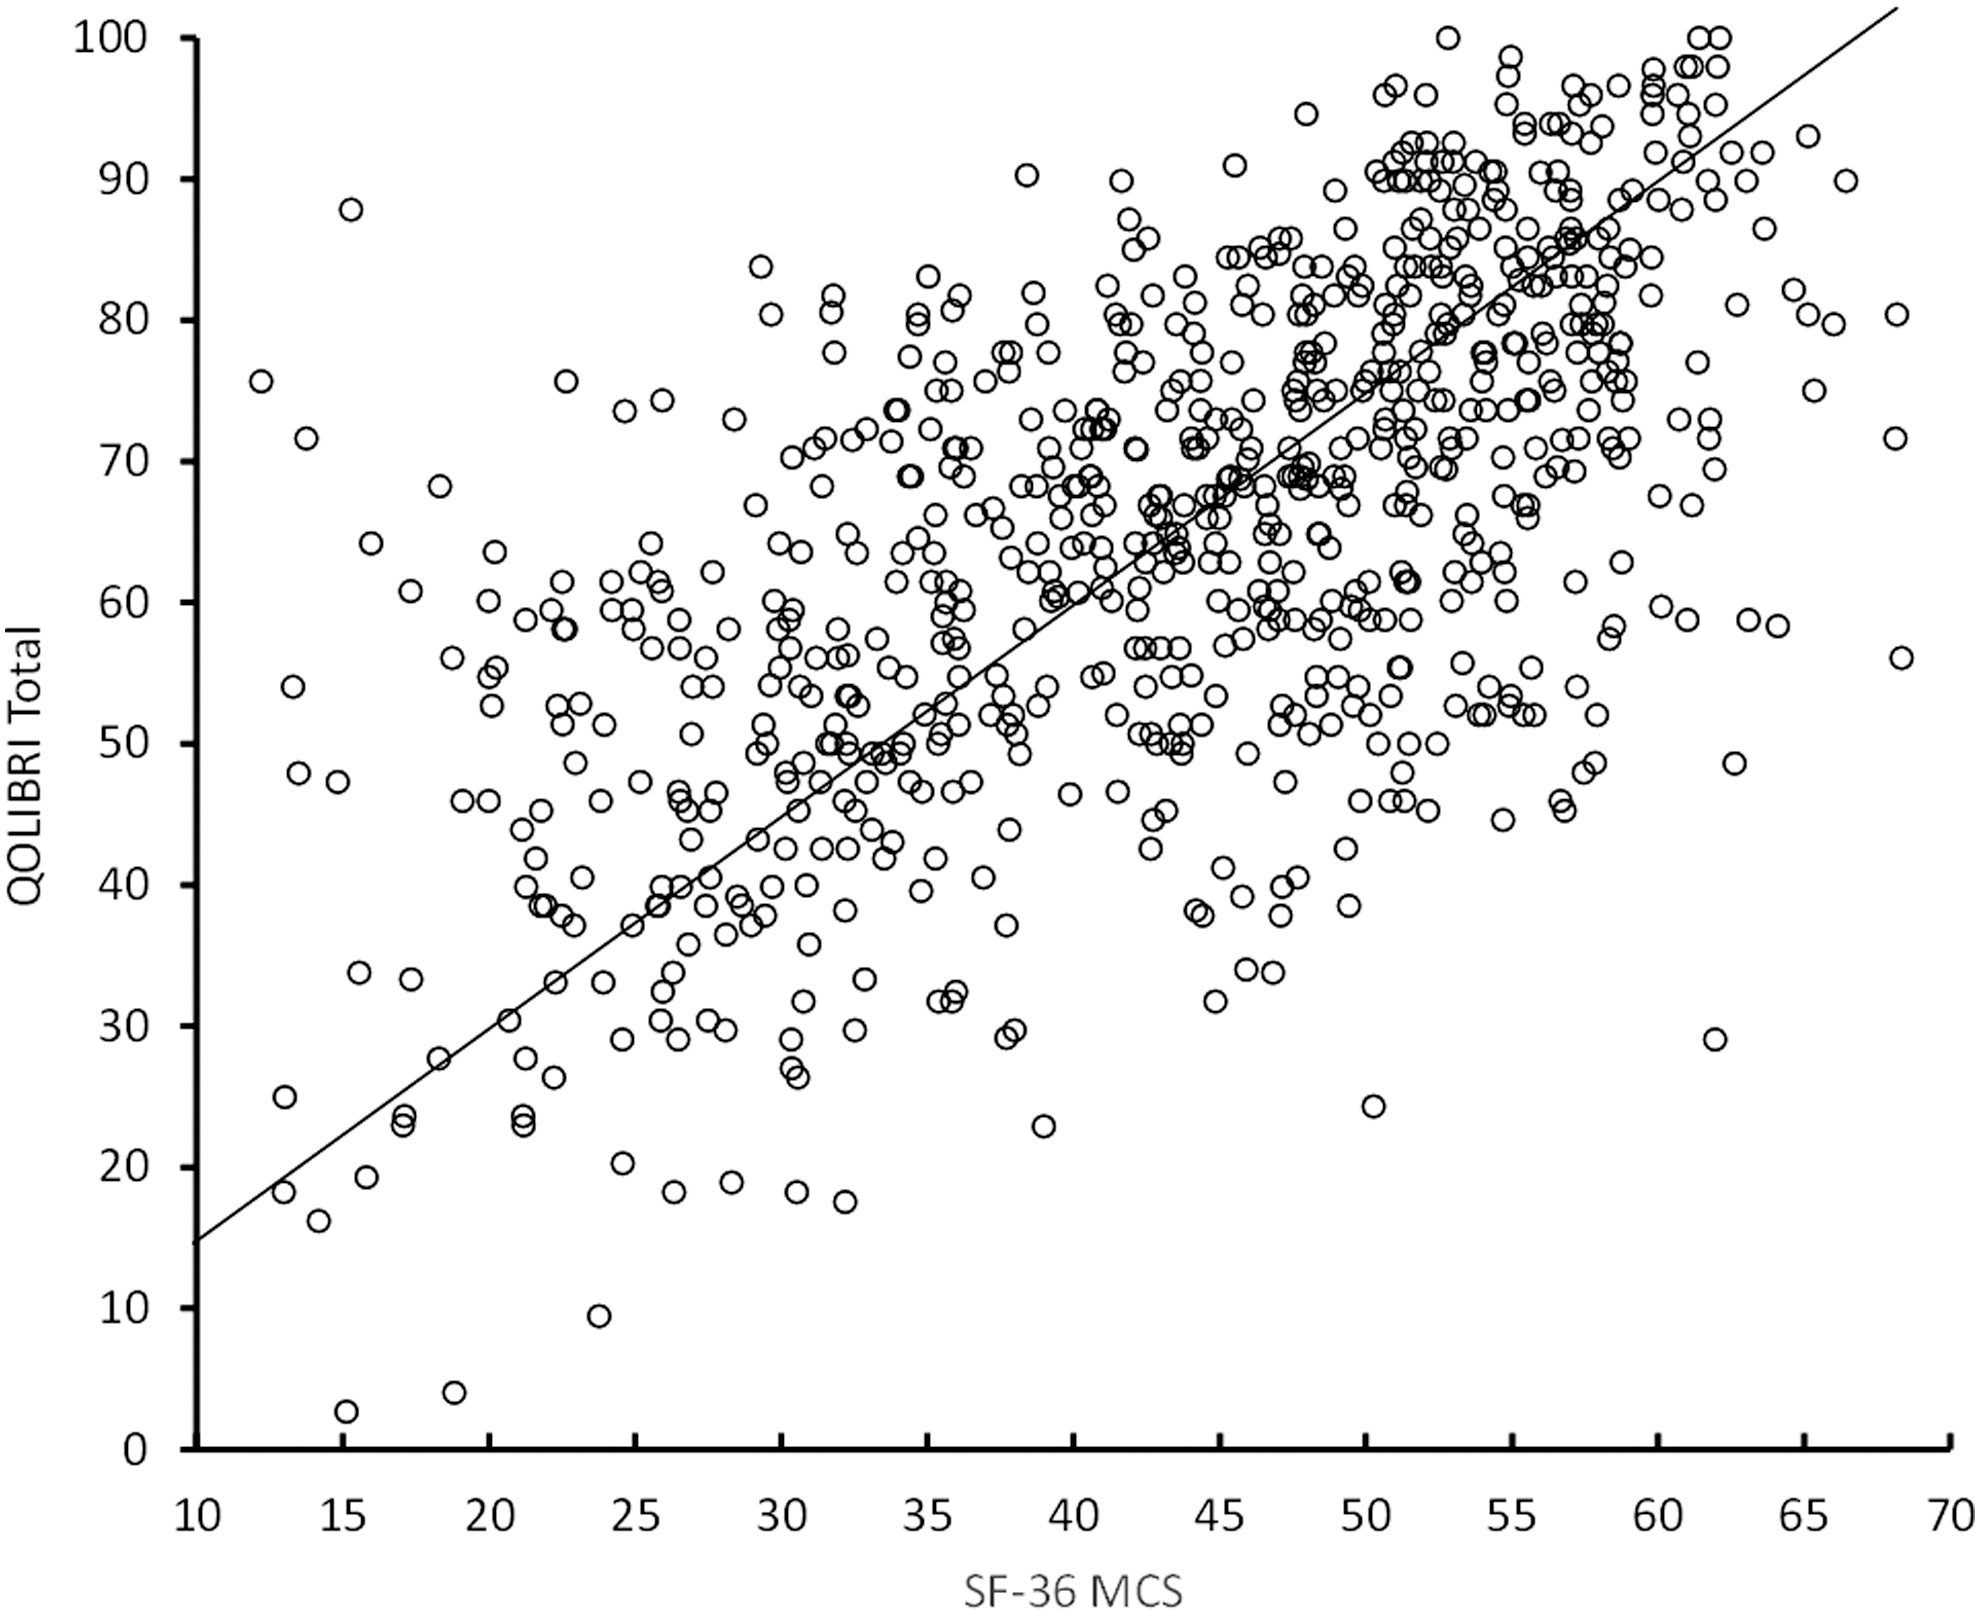
Scatterplot of the Quality of Life after Brain Injury (QOLIBRI) Total score against the SF-36 Mental Component Summary (MCS). The line of fit comes from geometric mean regression.
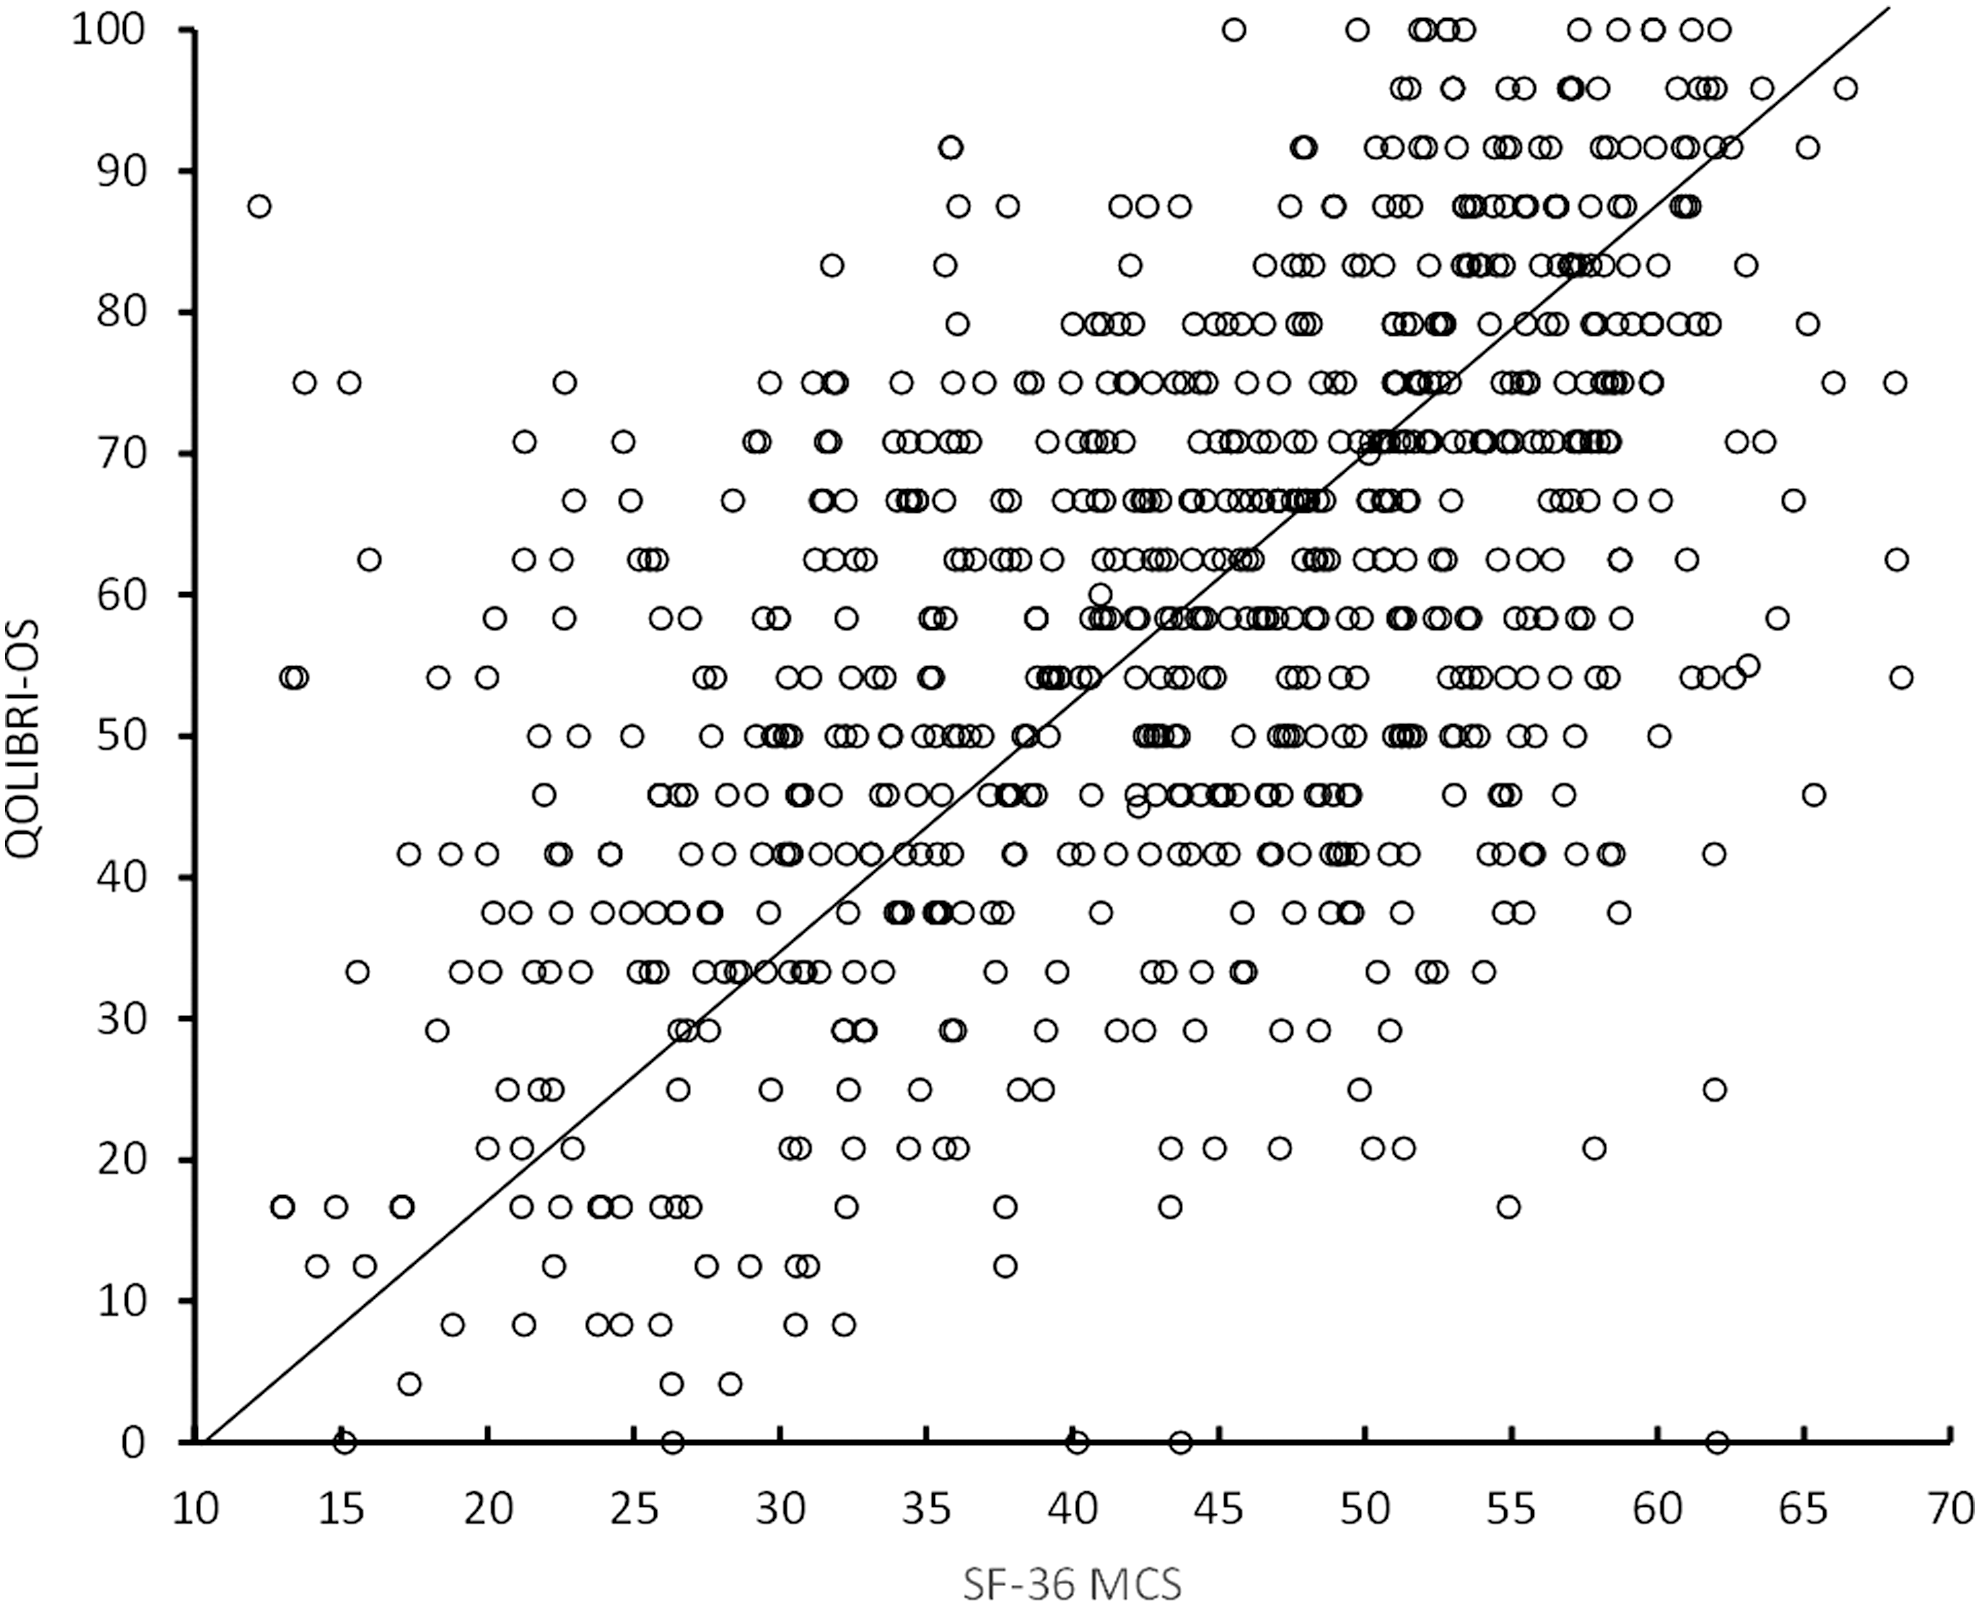
Scatterplot of the Quality of Life after Brain Injury Overall Scale (QOLIBRI-OS) score against the SF-36 Mental Component Summary (MCS). The line of fit comes from geometric mean regression.
The results of the regression analyses are shown in Table 3. The parameter estimates from Table 3 were used to construct the following equations: (1) QOLIBRI Total = MCS × 1.49 + 0.176; (2) QOLIBRI-OS = MCS × 1.764 - 18.301; and (3) QOLIBRI Total = 15.463 + 0.846 × QOLIBRI-OS. These were then used to estimate QOLIBRI ranges that corresponded to the bands for the MCS described by Ware and colleagues 10 (Table 4). The lower boundary, 40 on the MCS, corresponds to 59.78 on the QOLIBRI Total and 52.26 on the QOLIBRI-OS, while 52.26 on the QOLIBRI-OS is equal to 59.67 on the QOLIBRI Total, indicating consistency and transitivity between algorithms.
CI, confidence interval; SF, short form; MCS, mental component summary; QOLIBRI, Quality of Life after Brain Injury-Overall Scale.
The coefficients are for the regression equation of the form: Y = a + bX, where a is the intercept, and b is the slope.
SF, short form; MCS, mental component summary; QOLIBRI-OS, Quality of Life after Brain Injury-Overall Scale.
On the criteria from Table 4, the percentage of cases in the sample that fell into the “impaired” category were 34% for the MCS, 38% for the QOLIBRI Total, and 39% for the QOLIBRI-OS; 31% of the sample were impaired on both QOLIBRI scales, and 20% were impaired on all three HRQoL measures. A score of 60 for the QOLIBRI Total corresponds to a mean item score of 3.4, and that of 52 for the QOLIBRI-OS is equivalent to a mean of 3.08.
As implied by the value for the intercept for mapping between the QOLIBRI Total and QOLIBRI-OS (Table 3), the QOLIBRI-OS has a floor at the lowest values of the QOLIBRI Total: below 16 on the QOLIBRI Total corresponding scores on the QOLIBRI-OS reach zero. In the database, there were five cases (0.6%) below this floor.
Relationships of the QOLIBRI scales with the GOSE were examined to ascertain whether they were consistent with the results from the mapping exercise and to provide mean scores in a form that could be used as reference information. Mean HRQoL values are given for the three major categories of the GOSE (Table 5). For both the QOLIBRI Total and the QOLIBRI-OS, the mean value for patients with GOSE Good Recovery corresponds to the “normal” range as would be expected, while patients with disability are either “borderline” (Moderate Disability) or “impaired” (Severe Disability). As evident from the SDs, there is nonetheless substantial overlap between categories in HRQoL.
GOSE, Glasgow Outcome Scale–Extended; SF, short form; MCS, mental component summary; QOLIBRI-OS, Quality of Life after Brain Injury-Overall Scale.
Number of cases (percentages in brackets) and mean scores (standard deviationss in brackets) on the SF36-MCS and the QOLIBRI Scales.
Statistic: analysis of variance.
To provide additional brain injury reference group information on QOLIBRI-OS scores, the findings by age and gender are presented (Table 6). This Table complements the corresponding information given for the QOLIBRI Total score and subscales by Truelle et al. 2 There is a non-significant trend for an effect of age on QOLIBRI-OS scores (p = 0.07), and no effect of gender (p = 0.96).
SD, standard deviation; QOLIBRI-OS, Quality of Life after Brain Injury-Overall Scale.
Fmodel = 1.77, p = 0.18, Fage = 2.21, p = 0.07, Fgender = 0.002, p = 0.96.
Note: Fmodel is the overall F for the analysis of variance.
Number of cases (percentages in brackets) and mean scores (SDs in brackets) for QOLIBRI OS scores.
Discussion
The cross-walk between scales suggests bands of scores on the QOLIBRI that represent average or below average HRQoL, and the lower boundary for the QOLIBRI Total coincides with a value identified previously as a potential indicator for emotional distress. 2 The convergence on boundary values from different sources provides support for the bands described.
A best estimate based on current analysis is that QOLIBRI Total scores below 60 or QOLIBRI-OS scores below 52 represent low or impaired HRQoL. The estimates will clearly have a margin of error, but the values are nonetheless useful as a reference. By these criteria, more than one third of participants are identified by each of the HRQoL measures as having low scores. Not all poor HRQoL will be specifically related to TBI, because the domains assessed may be affected by a range of diseases and chronic conditions. The proportions of participants identified as having impaired HRQoL on the SF-36 MCS, however, are far greater than the 16% expected in the general population.
A reservation concerning the findings concerns the strength of the correlations between the SF-36 MCS and the two QOLIBRI scales. Correlations between the MCS and the two QOLIBRI measures fall below the conventional threshold (r > 0.7) at which scales may be considered to measure equivalent constructs. 15 In this respect, the study is similar to many of the published studies mapping generic and disease-specific assessments in the health utility field. 8 The prudent advice is that, in these circumstances, scores for the generic and disease-specific measures should not be substituted. 15
On the other hand, the relationship between the QOLIBRI Total and QOLIBRI-OS is stronger, and scores can be translated from one scale to the other. Mapping algorithms are potentially useful when collating data from different studies for the purposes of meta-analyses or when merging data to create large-scale databases. The methods described here, within a margin of error, may allow scores obtained using the two versions of the QOLIBRI to be equated for this purpose.
The suggested lower boundary for the QOLIBRI-OS is consistent with findings reported by Wong and colleagues. 16 These investigators used both the QOLIBRI-OS and SF-36 in 64 patients with subarachnoid hemorrhage (SAH) assessed 1 year post-injury. They report that patients with SAH scoring 50 or above on the QOLIBRI-OS had a mean MCS of 53 (± 12, N = 37) compared with an MCS of 41 (± 18, N = 27) for those scoring below 50. This is in line with current results and provides evidence that patients scoring below 50 on the QOLIBRI-OS form a group that show clear impairment on HRQoL measures.
Soberg and colleagues 7 compared QOLIBRI Total scores across GOSE categories in 126 patients with TBI followed up 12 months after injury. Interestingly, the Good Recovery group in their study (mean QOLIBRI Total = 81.1) would be at the high end of the “normal” range against criteria, while patients with disability would be in the “borderline” category (61.1 for those with Moderate Disability, and 62.0 for those with Severe Disability). The HRQoL outcomes achieved seem comparatively good for a group of patients with severe injuries assessed 12 months post-injury. The authors ascribe this to recent developments of models of care in the Nordic health system. 7 The ongoing CENTER-TBI study will help to confirm whether cross-national differences in outcome exist, and whether they can be ascribed to differences in management. 17
Lin and associates 18 assessed 301 patients with mild to severe TBI recruited from neurosurgery clinics. In their study, patients with mild injuries (GCS 13–15) are the low end of the normal range (mean QOLIBRI Total = 66.8), while patients with moderate or severe injuries were in the impaired range (means of 57.6 and 57.5, respectively). The mean QOLIBRI Total for the sample was 63.5, which is close to the mean for the current study. Lin and associates 18 also report on the responsiveness of the QOLIBRI to changes in GOSE outcomes over the first year.
The current study has several limitations. Mapping exercises between instruments are both content and data dependent. Mapping concerns the shared content of the scales, which in the case of the mapping with MCS, reflects generic HRQoL related to mental health. The disease-specific aspects are thus not included, and it is possible that this biases the estimates.
Relationships observed are also dependent on the data, and it is not known whether the current sample is typical with respect to the association between the MCS and the QOLIBRI. Polinder and colleagues 6 conducted a meta-analysis of the SF-36 in 17 studies in TBI and found substantial heterogeneity in summary scores. The overall mean MCS from the meta-analysis was close to the mean value of MCS obtained here and suggests that the current sample is representative at least in this respect. The sample may be atypical in other respects, however; for, example, the data were collected over a wide range of follow-up time points.
The usefulness of the cross-walk with the MCS is also dependent on how far the SF-36 1998 normative sample from the United States is appropriate as a comparison group. The norming exercise was repeated in 2007 for the SF-36v2, and there were some changes on this scale, albeit small ones. Cross-national differences in expectations for HRQoL are also likely to be relevant, and changes over time in the United States will not necessarily be reflected elsewhere. It is known from work on the SF-36 that there are differences between countries: in one study, for example, the mean MCS in general population samples varied from 54.0 in Denmark to 47.6 in Italy. 19
Finally, TBI samples rarely approximate the general population in demographics, although age and sex differences do not appear to have a substantial influence on QOLIBRI findings. Limitations of normative data are well understood in neuropsychology, and the investigator who wishes to have a precise comparison on the QOLIBRI will wish to assess a matched control group—for example, an orthopedic injury sample. 20
The primary purpose here is to aid in the conduct and interpretation of group studies in TBI HRQoL. It is often convenient to divide study participants according to bands of scores, but this should not be treated as diagnostic at the individual level. This caveat applies equally to other instruments and banding systems, such as that used for the HADS. 21 Interpretation in individual cases will depend on expectations for the person, which takes into account background factors and the person's HRQoL before TBI, as well as potential sources of error or bias in individual responses. Further, the algorithms are not intended to be used for prediction of individual scores: predicted scores, for example from OLS regression, will generally lie closer to the mean than the values given by the GM equations.
Conclusion
Cross-walking with the SF36-MCS suggests bands of average and poor HRQoL on the QOLIBRI Total and the QOLIBRI-OS. The suggested bands can be used when interpreting group data and should be considered guidelines rather than cutoffs. The bands suggested, treated appropriately, help to improve interpretation of QOLIBRI summary scores. An algorithm is provided for mapping between the two QOLIBRI summary scores, and patient data are included in a form that can aid interpretation of the QOLIBRI-OS. The results indicate that, even in a sample in which most participants were followed up many years after injury, poor HRQoL is a feature of more than one third of patients with TBI.
Footnotes
Acknowledgment
The work was performed in the context of CENTER-TBI, supported by the European Commission 7th Framework programme (Grant Number 602150-2).
Author Disclosure Statement
No competing financial interests exist.