
Abstract
Poor response inhibition is a hallmark of pediatric traumatic brain injury (TBI). We assessed motor response inhibition by measuring commission error rates on Simple (minimized cognitive demands) and Motivation (monetary reward) Go/No-Go tasks, comparing 17 children with chronic TBI (>1 year post-injury) and 14 matched, uninjured peers. Using resting state functional magnetic resonance imaging (fMRI), we examined between-group differences in whole-brain intrinsic connectivity of the motor network as derived from the averaged time course of bilateral primary motor cortex seeds, to identify regions of interest (ROIs) for brain–behavior correlations. Independent sample t tests compared Go/No-Go performance and connectivity at the ROI level. Pearson correlations examined relationships between intrinsic connectivity at the ROI level and Go/No-Go performance. Adolescents with TBI showed poorer performance on Simple and Motivation Go/No-Go tasks compared with controls. In whole-brain contrasts, adolescents with TBI showed significantly reduced functional connectivity between the motor network and voxels within the left caudate. Furthermore, in ROI analyses, the group with TBI had significantly lower connectivity between the motor network and left caudate and numerically lower connectivity between the motor network and right caudate. In adolescents with TBI, lower motor network to left caudate connectivity correlated with poorer Simple task performance; lower motor network to right caudate connectivity correlated with poorer Simple and Motivation task performance. No significant brain–behavior relationships existed among controls. These results are consistent with previous pediatric TBI literature and suggest that disrupted intrinsic connectivity of a corticostriatal motor network may contribute to response inhibition deficits.
Introduction
R
In laboratory settings, response inhibition is typically measured with Go/No-Go paradigms or Stop Signal Tasks (SST). During Go/No-Go paradigms, children with TBI have more commission errors – failure to withhold a response on a “No-Go” trial – than uninjured children. 2 Likewise on SST, children with TBI frequently fail to suppress prepotent motor responses after a stop signal is presented. 3 –5 To determine if response inhibition can be augmented with reward, one study used a motivational SST in a population of children with moderate to severe TBI. 6 They found that motivation improved performance in children with chronic TBI (> 6 months post-injury), but that children with attention-deficit/hyperactivity disorder (ADHD) and neurotypical controls had greater gains. This indicates that poor response inhibition in TBI cannot be completely attributed to low intrinsic motivation; however, rewarding performance may marginally improve ability.
Simple Go/No-Go tasks, which measure simple motor response inhibition, and complex Go/No-Go tasks, which measure response inhibition under conditions of increased cognitive demand, have been used to study the neural underpinnings of response inhibition in healthy adults. A meta-analysis of functional magnetic resonance imaging (fMRI) studies summarized the neural correlates of both simple and complex Go/No-Go performance in healthy adults by looking at task-dependent neural activation during “No-Go” trials. 7 Although there was some variation in recruitment based on task demands (e.g., increased frontal recruitment with more complex Go/No-Go designs), task-dependent activations occurred during appropriate response inhibition in the pre-supplemental motor area (pre-SMA) across Go/No-Go tasks. Comparably, when healthy adults complete SST, neural recruitment is observed in the pre-SMA, along with the supplemental motor cortex, primary motor cortex, right inferior frontal cortex, and subcortical regions such as the basal ganglia. 8 –10 Collectively, these prior studies demonstrate that motor network recruitment is observed when response inhibition is assessed with either SST or Go/No-Go tasks.
The role of the motor network in response inhibition is further supported by findings from children with ADHD. Impaired response inhibition is a primary deficit in ADHD, 11 and basic motor examination findings correlate with response inhibition performance in children with ADHD. 12,13 Further, task-related and resting state fMRI studies in children with ADHD demonstrate anomalous activation patterns of regions of the motor network. 14 –16 As after pediatric TBI there are known impairments in basic motor control, 17 –22 disruptions in motor network connectivity may also underlie the response inhibition deficits observed in children with TBI. 2 –6
There has been little direct investigation of the neural underpinnings of response inhibition after pediatric TBI to date, but the data that do exist support involvement of the motor network. Researchers using fMRI found that, compared with uninjured controls, adolescents with mild TBI had greater inhibition-induced activation of the anterior cingulate cortex and motor/premotor regions during an emotionally mediated response inhibition task. 23 In another study, children with mild TBI were found to have more cerebellum activation than uninjured peers during a moderately difficult response inhibition task. 24
Task-independent activity can be observed in functionally connected neural networks using resting state fMRI (rs-fMRI). In adults with TBI, altered functional connectivity of the sensorimotor network has been linked to deficits in attention, a cognitive ability necessary for response inhibition. 25 In children with TBI, abnormal functional connectivity between motor regions and the default mode network (DMN) and dorsal attention network (DAN) has been linked to deficits in conscious and subconscious inhibitory control. 26 However, connectivity of the motor network has not yet been examined with respect to classic laboratory tasks of motor disinhibition in children with TBI.
Here, we used Go/No-Go paradigms to assess response inhibition in chronic (>1 year post-injury) pediatric TBI. We used a Simple Go/No-Go task that had minimal cognitive demands, and a Motivation Go/No-Go task that rewarded correct responses and punished incorrect responses. Rs-fMRI was used to examine whole-brain connectivity of the motor network which, here, was composed of regions functionally connected to the bilateral primary motor cortices, which are downstream targets of earlier neural activity from varying pre-motor regions for motor inhibition 8 and are considered the cortical hubs of the motor control network. 27 We hypothesized that adolescents with chronic TBI would demonstrate poorer response inhibition than uninjured peers on both the Simple and Motivation Go/No-Go, although we expected marginally better performance on the Motivation Go/No-Go task. We also anticipated that, in comparison with uninjured peers, adolescents with TBI would exhibit altered intrinsic connectivity of the motor network. Finally, we predicted that altered patterns of intrinsic functional connectivity of the motor network would be associated with motor response inhibition deficits.
Methods
Participants
Seventeen adolescents 12–18 years of age with chronic TBI (1–5 years post-injury) were recruited from outpatient pediatric brain injury rehabilitation clinics and enrolled in this study. Study inclusion criteria were as follows. Participants must have sustained an isolated event of trauma resulting in TBI characterized by at least one of the following: post-traumatic amnesia (PTA) lasting at least 1 h, loss of consciousness lasting <15 min, or presence of injury-related intracranial findings on clinical imaging. As Glasgow Coma Scale (GCS) scores from the day of injury were infrequently available, the severity of TBI was defined using the American Congress of Rehabilitation Medicine (ACRM) 1993 criteria based on presence of injury-related intracranial findings on clinical CT findings (no findings = mild TBI, findings = moderate or severe TBI) and duration of PTA (< 24 h = mild, 24 h–7 days = moderate, >7 days = severe) unless a GCS score (13–15 = mild, 9–12 = moderate, ≤8 = severe) was available and indicated a more severe injury. When determining severity, we made a classification with a bias toward a higher severity level. For example, if one category indicated mild TBI, but another category indicated moderate TBI, the injury was classified as moderate. Fourteen uninjured adolescents, ages 13–18, matched on age, sex, and socioeconomic status (SES) were recruited for a comparison control group using flyers, word of mouth, and radio advertisements. SES status was determined for both groups using maternal education. None of the participants within the TBI or control group had overt motor impairment or met criteria for pre-injury behavioral or educational diagnoses based on a structured parent interview. The Johns Hopkins Medicine institutional review board (IRB) approved this study, written informed consent was obtained from a parent or legal guardian, and assent was acquired from adolescent participants.
Behavioral measures
A Go/No-Go paradigm was used to measure response inhibition. 11 Two versions of the task were used: Simple and Motivation. In the Simple task, participants were instructed to make a button press response when a green “Go” target was present, and to inhibit that response when a red “No-Go” target item was present. “Go” targets were presented nearly four times as often as “No-Go” targets to create the prepotent motor response that must be inhibited. The use of green and red – well-established cues for “go” and “stop,” respectively – served to reduce the cognitive demands of the task. In the Motivation task, 28 the task instructions were the same, but performance was incentivized with a monetary reward for correct “Go” and a monetary loss for incorrect “No-Go” responses. On the “Go” trials, an individualized response deadline for Go responses was created based on the child's reaction time in the Simple task to prevent participants from responding slowing to improve their accuracy. Commission rate, measuring the rate (i.e., percentage of total trials) of inhibition failures, was used as the primary outcome measure for both the Simple and Motivation-based tasks.
MRI acquisition
Rs-fMRI) data were acquired with a 3T Philips scanner. A high resolution T1-weighted anatomical scan, MPRAGE, was obtained for image co-registration, segmentation, and normalization processing (32-channel head coil, repetition time [TR] = 7.99 ms, echo time [TE] = 3.76 ms, flip angle = 8 degrees). The rs-fMRI scan was 6 min 30 sec in duration (D-SENSE EPI, 32-channel head coil, TR = 2500 ms, TE = 30 ms, flip angle = 70 degrees). During the rs-fMRI scan, participants were instructed to focus on a centrally located fixation cross. T2-weighted and fluid attenuation inversion recovery (FLAIR) images were also acquired for interpretation by a pediatric neuroradiologist.
Rs-fMRI data processing
Standard image preparation, processing, and analysis were completed using Statistical Parametric Mapping (SPM12b) and custom Matlab scripts. Functional images were adjusted for slice timing and head motion, co-registered to the T1 scan, normalized to Montreal Neurological Institute (MNI) space using unified segmentation-normalization, and linearly detrended on a voxelwise basis. Using the aCompCor method, 29 nuisance variables were estimated from the ventricles and white matter, and then regressed from each voxel along with linearly detrended versions of the six motion parameters and their first derivatives estimated through backward differences. A 6 mm full width at half maximum (FWHM) filter was used to spatially smooth functional images, which were then temporally filtered (bandpass 0.01–0.1 Hz).
Motor network maps
For each subject, we used a two step process to generate a whole-brain connectivity map for the bilateral primary motor cortices. First, whole-brain connectivity maps for the right and left precentral gyri, as defined by the Automated Anatomical Labeling (AAL) Atlas, were generated separately. For each region of interest (ROI), the time series of all voxels within that ROI were averaged, and the average time series was correlated with the time series of all other voxels in the brain. These correlations were converted to z-scores using Fisher's transformation. Whole-brain connectivity maps from the left and right ROIs were then averaged to create a motor network map for each subject. We visually inspected these maps to confirm that they accurately represented the motor network. For group motor network maps, see Figure 1.
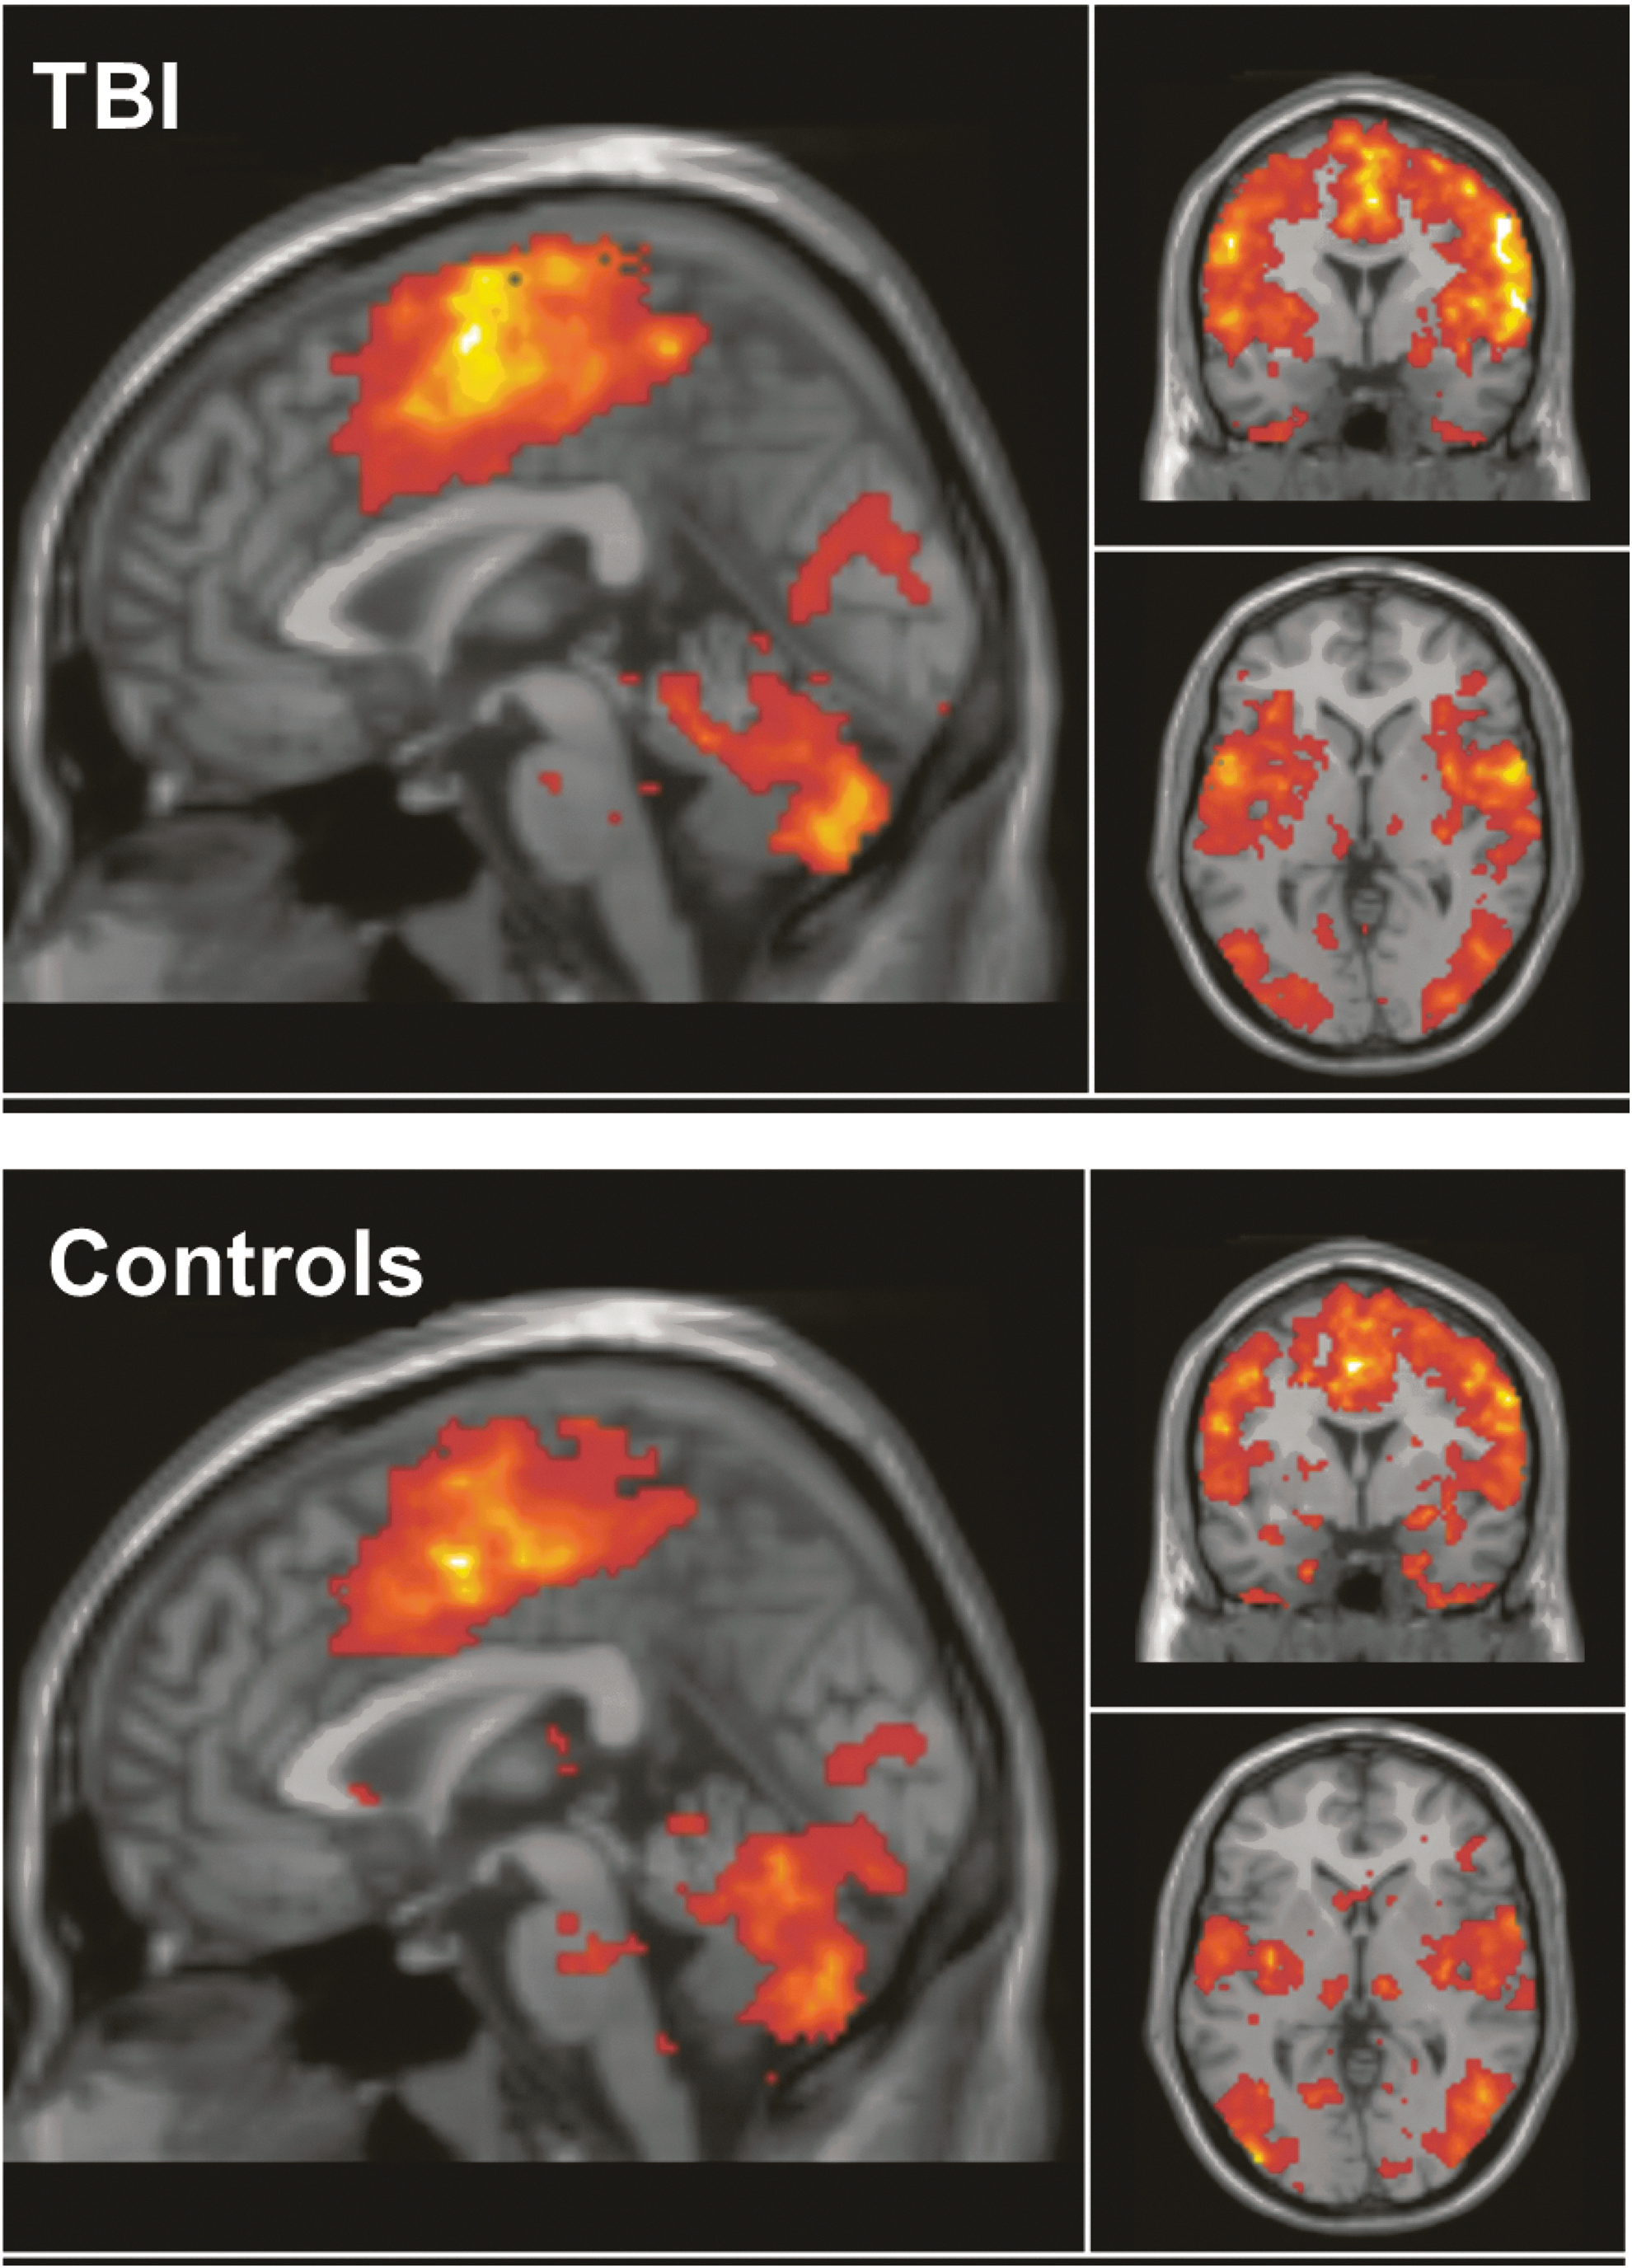
Averaged motor connectivity maps for the traumatic brain injury (TBI) group (top) and control group (bottom).
Voxel-based analysis
SPM12 second-level analyses were used to examine between-group differences in the generated motor network connectivity maps. Each subject's motor network map was entered into two-sample t tests to evaluate for differences between the TBI and control groups in motor network to whole brain connectivity. The voxel-level threshold was established at p < 0.001, and familywise error (FWE) correction was used for multiple comparisons at a cluster-level threshold of p < 0.05 in accordance with random-field theory. 30 Connectivity values for activated voxels were extracted using the MarsBar toolbox in SPM12.
Brain–behavior ROI-based analyses
Between-group differences in brain connectivity were further examined at the ROI level to avoid circularity in brain–behavioral analyses. 31,32 MNI coordinates of the peak activated voxel, where cluster-level between-group differences were observed, were entered into the Wake Forest University (WFU) Pickatlas toolbox. 33,34 WFU Pickatlas was used to determine the region of origin of the peak activated voxel using the AAL atlas. Left and right ROI masks were then used in MarsBar toolbox to extract raw connectivity values from each voxel within the left and right ROI; these raw connectivity values were averaged across the left ROI and the right ROI to establish the connectivity between the motor network and ROIs for each subject.
Statistical analysis
Outliers were identified and excluded if performance was poorer than >2 SDs from the mean. Independent sample t tests were completed in SPSS to compare groups on Simple and Motivation-based Go/No-Go commission error rates. SPM12 was used for initial voxel-based comparisons, and SPSS was used for all subsequent rs-fMRI data analyses. Between-group comparisons of ROI connectivity values were completed using independent sample t tests. Within each group, relationships between motor network and ROI connectivity values and behavioral performance were evaluated using Pearson correlations; p values <0.05 were considered significant; values between 0.05 and 0.10 were labeled as trend findings. Additional analyses were completed as follows to examine for other contributions to the findings. Within the TBI cohort, independent sample Kruskal–Wallis tests were used to evaluate if TBI severity influenced behavioral performance or connectivity values. Age of participants was examined for correlation with ROI connectivity or behavioral findings; based on findings presented subsequently, partial correlations controlling for age were used to examine all brain–behavior relationships in the TBI group.
Results
Participant characteristics
The TBI group included 17 participants (6 females; 16 right-handed, 1 left-handed) whose mean age was 16.0 years (SD = 2.1). The mean number of years since injury was 1.7 (SD = 1.2). Average maternal education for the TBI group was 16.3 years (range: 14–18 years). The control group included 14 subjects (3 females, all controls were right-handed) whose mean age was 16.2 years (SD = 1.5). Average maternal education for the control group was 16.0 years (range: 12–18 years). There were no significant differences in age (p = 0.74), sex (p = 0.52), or maternal education level (p = 0.82) between groups. In the TBI group, six participants had sustained a mild TBI, seven had sustained a moderate TBI, and four had sustained a severe TBI; see Table 1 for detail.
Age at testing.
TBI, traumatic brain injury; MVA, motor vehicle accident; GCS, Glasgow Coma Scale; PTA, post-traumatic amnesia.
Behavioral differences
All data from both groups were included in the Simple Go/No-Go task analyses; one participant from the control group was excluded from the Motivation Go/No-Go task after being identified as an outlier. On the Simple task, the TBI group (mean = 15%, SD = 11%) showed significantly more commission errors than controls (mean = 7%, SD = 7%), t (1, 29) = 2.55, p = 0.02; see Figure 2. Similarly, on the Motivation Go/No-Go task, the TBI Group (mean = 17%, SD = 11%) also showed significantly more commission errors than controls (mean = 9%, SD = 7%), t (1, 28) = 2.33, p = 0.03; see Figure 2. Performance did not differ on the Simple compared with the Motivation Go/No-Go task within the TBI group p = 0.41 nor did it differ within the control group, p = 0.32. In the control group, age did not correlate with Go/No-Go task performance, p values >.25. In the TBI group, age was negatively correlated with Simple commission errors, r = −0.52, p = 0.03 and Motivation-based commission errors, r = −0.65, p = 0.01. TBI severity did not influence Simple (p = 0.59) or Motivation (p = 0.89) commission error rates. Time since injury also did not influence Simple (p = 0.15) or Motivation (p = 0.55) commission error rates.
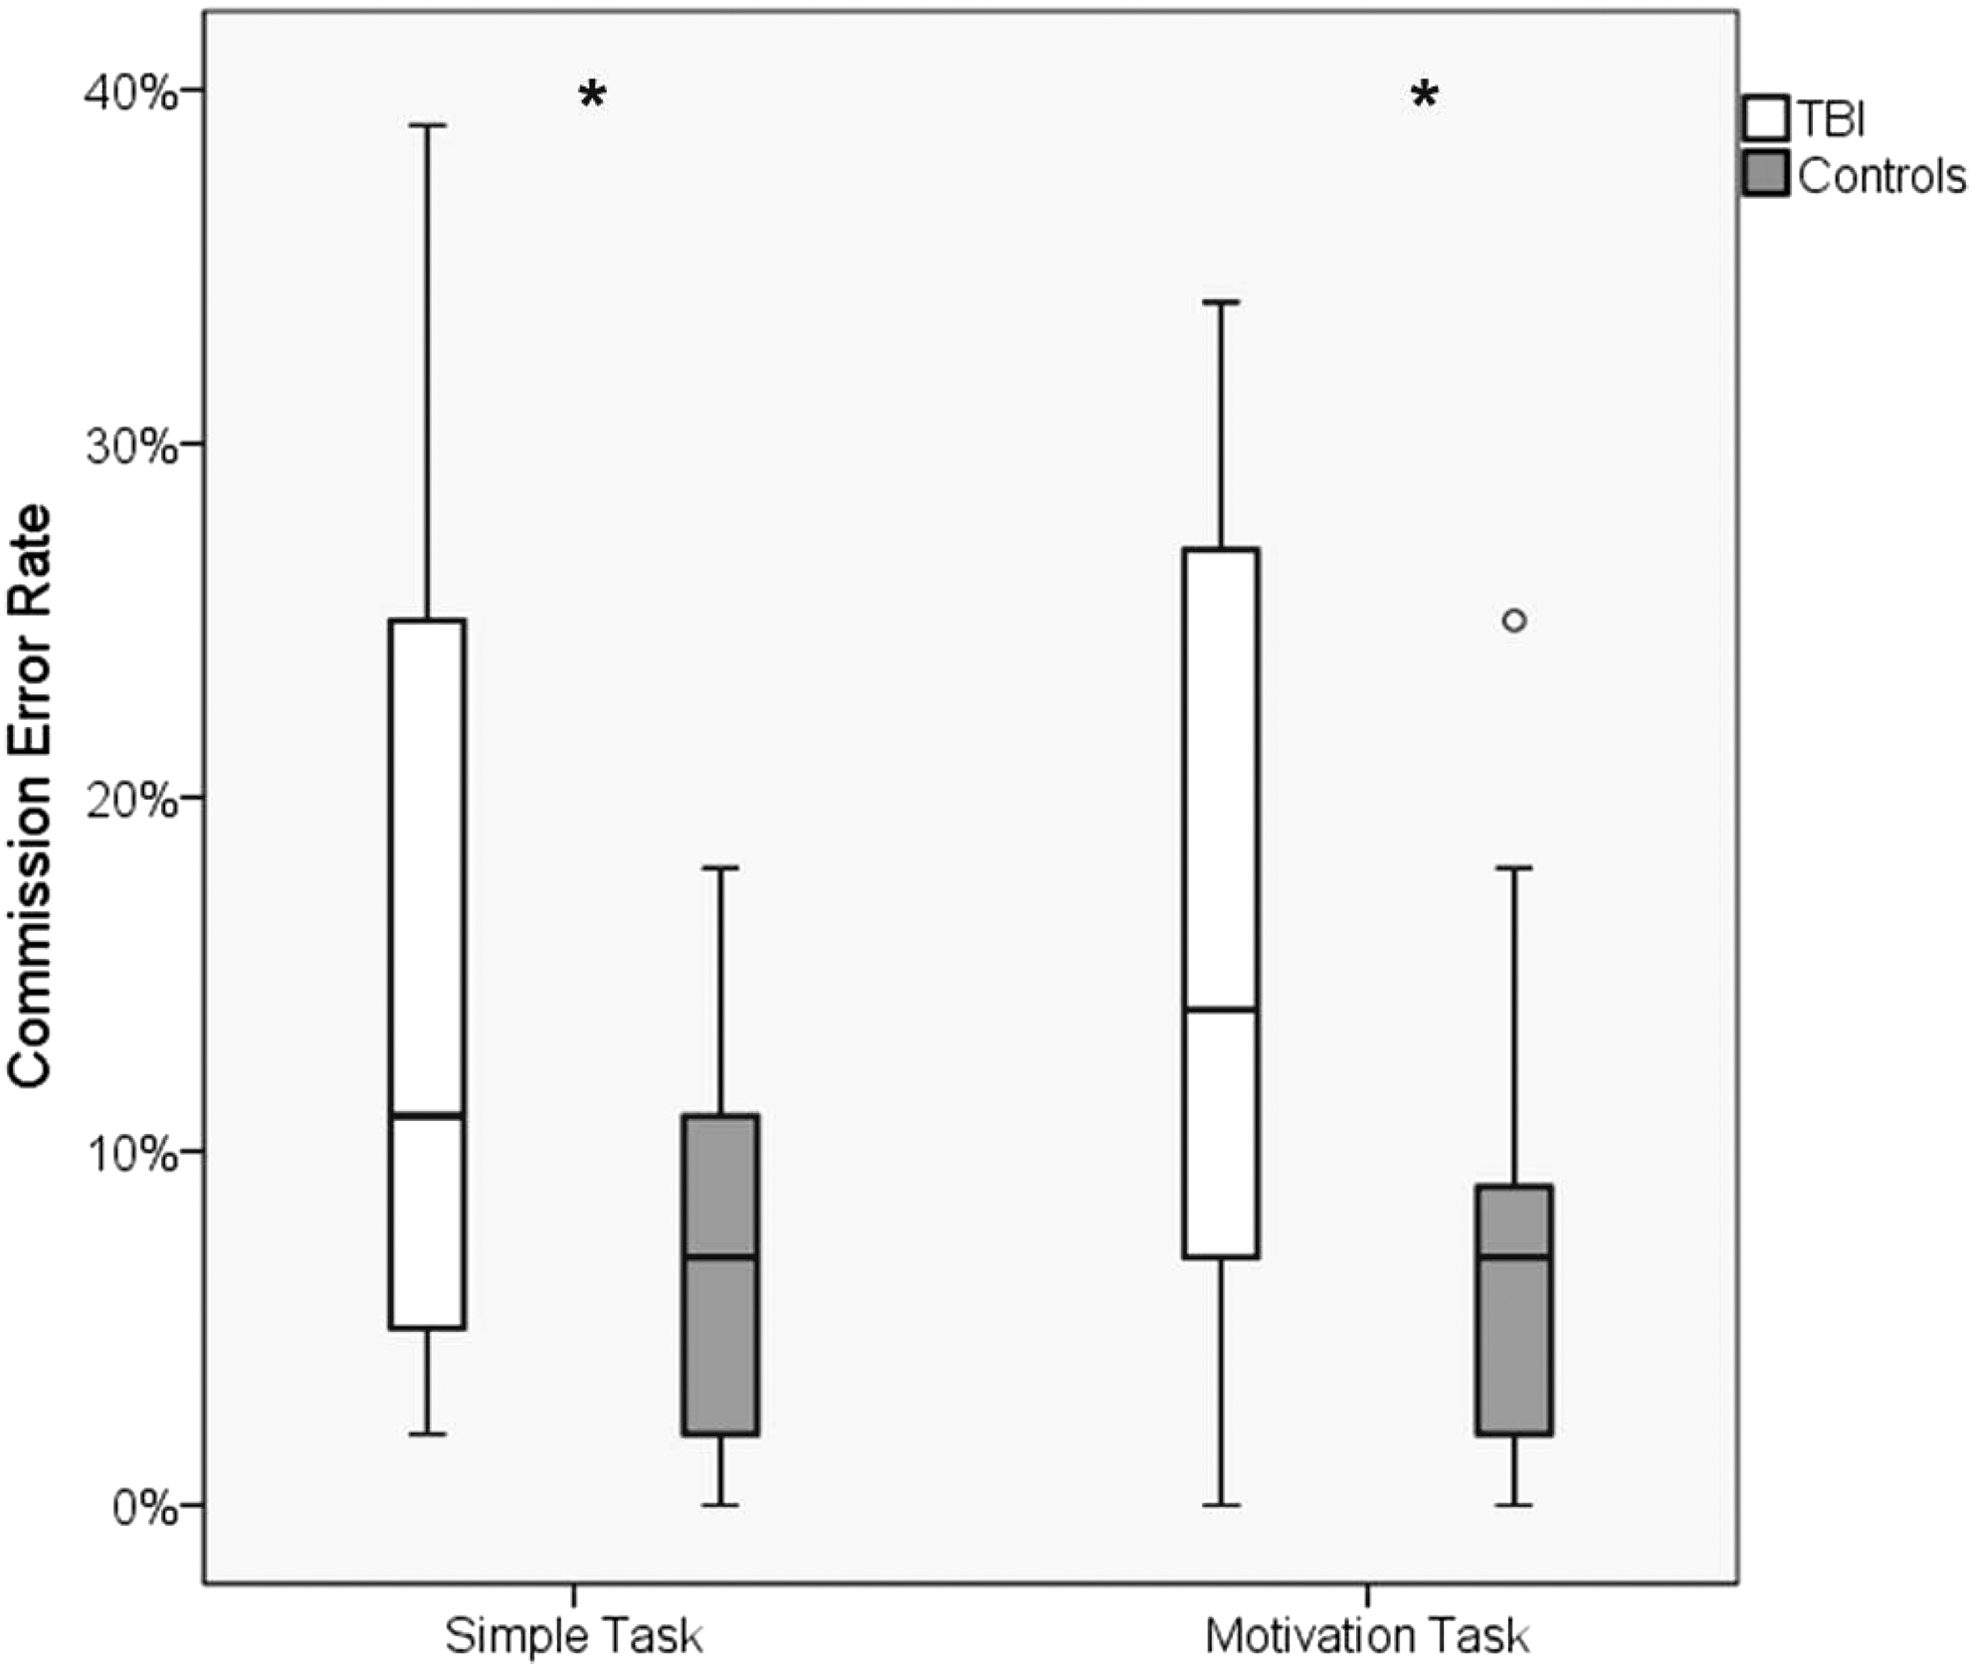
Behavioral performance. In comparison with controls, the traumatic brain injury (TBI) group had a significantly higher commission error rate on both the Simple and Motivation Go/No-Go Task. Lines within box plots represent median, and whiskers represent 95% confidence intervals. *p < 0.05; °performance = 2 SDs from mean (outlier performance was defined as >2 SDs).
Voxel-based differences
In whole-brain contrasts, a significant between-group difference in connectivity with bilateral primary motor cortex was identified in one cluster (contiguous voxels [k] = 116) with the peak activated voxel (MNI coordinates −4, 16, −2) residing in left caudate, p = 0.02. Post-hoc evaluation revealed that in the TBI group, the motor network showed reduced connectivity with this cluster (mean = −0.01. SD = 0.08) in comparison with the connectivity observed in control participants (mean = 0.19, SD = 0.09).
ROI-based differences
Between-group comparison of extracted connectivity values between the motor network and left caudate ROI revealed significantly lower connectivity in the TBI group (mean = 0.03, SD = 0.06) compared with controls (mean = 0.11, SD = 0.11), t (1, 29) = −2.60, p = 0.02; see Figure 3. Comparison of the connectivity values between the motor network and right caudate revealed that the TBI group (mean = .04, SD = .09) also showed numerically lower connectivity than controls (Mean = 0.10, SD = 0.11), t (1, 29) = −1.92, p = 0.07; see Figure 3. Age did not correlate with ROI connectivity value in the control group, p values >0.25. In the TBI group, neither age (p values >0.22), nor severity (p values >0.31) correlated with ROI connectivity values.
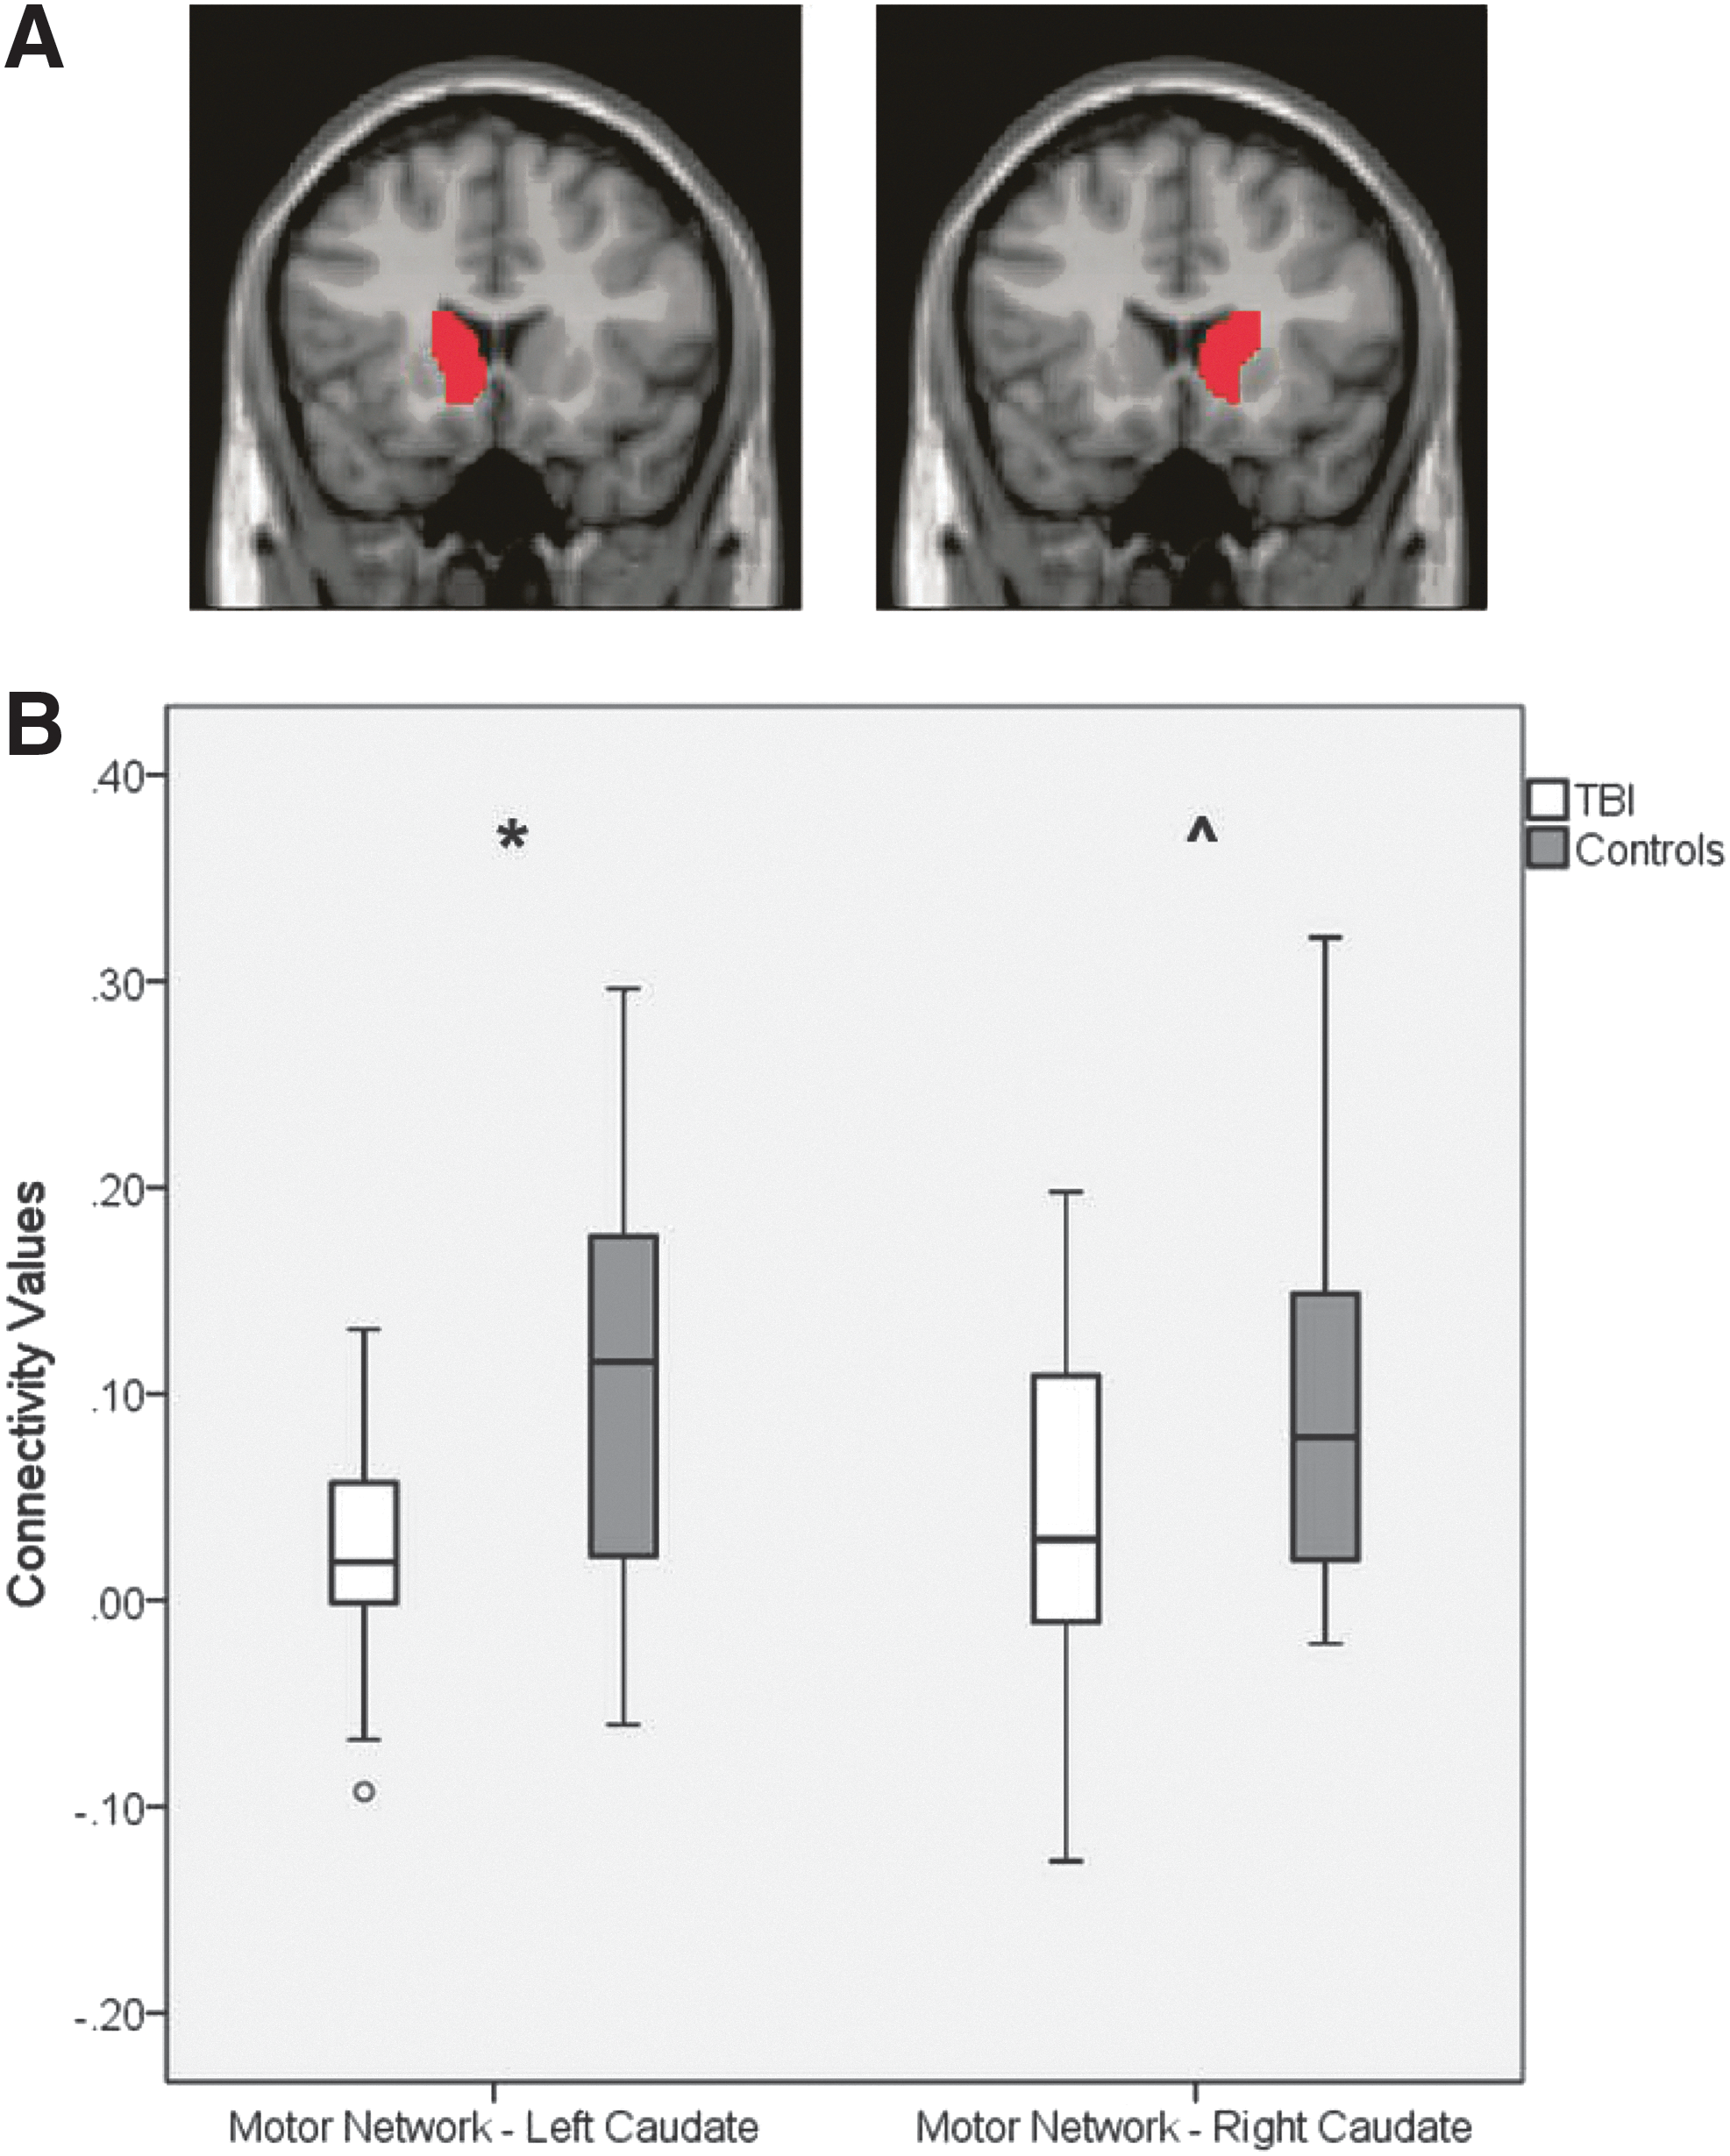
Region of interest (ROI)
Brain–behavior relationships
In the TBI group, there was a significant negative correlation between the motor network and left caudate ROI connectivity values and commission errors on the Simple Go-No/Go task, r = −0.56, p = 0.03; see Table 2 and Figure S1 (see online supplementary material at
All values account for age.
TBI, traumatic brain injury; ROI, region of interest.
Additionally, within the TBI group, there was a significant negative correlation between the motor network and right caudate ROI connectivity values and commission errors on both the Simple, r = −0.67, p = 0.01 and the motivation Go/No-Go tasks, r = −0.60, p = 0.02; see Table 2 and Figure S2 (see online supplementary material at
In the control group, there were no significant relationships between connectivity values and Go/No-Go performance (p values between 0.13 and 0.91).
Discussion
We observed that adolescents with TBI had significantly poorer motor response inhibition than healthy adolescents, as measured by Simple and Motivation Go/No-Go tasks. This finding is consistent with previously published literature on response inhibition deficits in pediatric TBI. 3 –5,35 We did not, however, observe that adolescents with TBI or controls had better performance on the Motivation task than on the Simple task. This is contrary to one study in which extrinsic motivation on an SST facilitated improved performance in children with chronic TBI. 6 However, in this previous work, researchers rewarded correctly inhibited responses but had no punishment for incorrect responses. In another study that used a Go/No-Go paradigm similar to ours, in which correct “Go” response were rewarded and incorrect “No-Go” responses were punished, researchers found that both children with ADHD and neurotypical controls had numerically poorer performance on the motivation-linked Go/No-Go task than on a task with a simple design. 11 Like our findings, these performance differences were not significantly different, but indicate that additional work is needed to understand the role of reward and punishment in response inhibition behavior in pediatric populations with and without brain injury.
In examining the connectivity of the motor network, as derived by seeding primary motor cortices (the hubs of the motor network 27 ), we found that, in comparison with controls, adolescents with TBI showed hypoconnectivity between the motor network and a subcortical cluster, whose peak activated voxel originated in the left caudate. Additionally, compared with controls, adolescents with TBI had significantly lower connectivity between the motor network and the left caudate ROI, and numerically lower connectivity between the motor network and right caudate ROI. Functional coupling of the motor network and subcortical caudate is typically expected, as these regions comprise much of the corticostriatal circuit. 36 However, we observed decreased functional connectivity, or de-coupling, of this corticostriatal circuit in chronic pediatric TBI. Disruptions in functional connectivity of neural networks, such as the DMN, have been observed in both adults 37 and children 26 after TBI and often relate to behavioral performance.
We next examined functional connectivity between the motor network and the caudate in the context of response inhibition performance. Adolescents with TBI who showed more abnormal functional connectivity between the motor network and the left caudate ROI also showed poorer response inhibition on the Simple Go/No-Go task. Additionally, in the TBI group, adolescents with more abnormal connectivity between the motor network and the right caudate ROI showed poorer performance on both the Simple and Motivation Go/No-Go tasks. In contrast, no similar relationships were found in the control group.
These results align with the current understanding of the neural underpinnings of successful response inhibition. Task-based fMRI studies have found that successful response inhibition relies on functional activation of circuits that include both cortical and subcortical structures, comprising a corticostriatal circuit. 36,38 Previous researchers have directly observed that response inhibition is mediated by caudate activation. 39 During response inhibition, researchers hypothesize that striatal activations suppress primary motor cortex activation, potentially via interactions with supplemental motor cortex and right inferior frontal cortex, in order to inhibit prepotent motor responses. 10 In previous work, we have observed that hyperconnectivity between the DMN (i.e., task-negative network) and motor regions is associated with disrupted motor inhibition in individuals with TBI. 26 Further, as noted earlier, researchers studying adolescents with TBI using task-based fMRI have found altered activations of motor and premotor regions during response inhibition tasks. 23 Collectively, these results suggest that response inhibition deficits in TBI may arise when neural regions, such as the caudate, or networks, such as the DMN, fail to repress or hinder the repression of primary motor cortex activation.
It is important to note that we only examined connectivity of the motor network and the caudate in relation to response inhibition performance. Because between-group differences were observed in connectivity of the caudate, it was a strong candidate for potentially explaining response inhibition differences. However, no relationship existed between functional connectivity and response inhibition in uninjured adolescents. This could be the result of insufficient statistical power, as we had a relatively small control group, but it more likely indicates that other, unexamined, neural components of the corticostriatal motor network also play an important role in response inhibition. Another consideration, potentially more relevant after TBI, is that motor-related regions beyond the corticostriatal network may play a role, as a study using experimental fMRI found hyperactivation of the cerebellum in response inhibition in children with TBI. 24 Because we completed whole-brain contrasts of the motor network, which included the cerebellum (see Fig. 1), we would have observed atypical cerebellar connectivity with other motor structures if it had existed in our cohort. Future studies with larger sample sizes may be better equipped to examine the role of other components of the corticostriatal network and additional ROIs, such as the cerebellum, in response inhibition performance. This is particularly important given the heterogeneity of TBI, as injuries in various locations could disrupt primary motor cortex activation differently.
The primary limitation of this study was the relatively small number of participants in both the control and TBI groups as well as the heterogeneity within the TBI group. Although we did not observe an influence of TBI severity on either behavioral or neuroimaging findings, TBI severity may impact the degree of response inhibition deficits and disruption of functional connectivity. This impact may be more readily apparent with a larger sample size. Nevertheless, it is essential to recognize that children with milder injuries, who are assumed to be fully recovered, may have persisting injury-related physiological changes that correspond with lasting cognitive and behavioral difficulties. For this reason, it is essential to have sensitive behavioral and neural measures of impairment, so that interventions can be developed to promote more complete recovery.
We also had an unexpected finding that connectivity between the motor network and the right caudate was associated with performance on both the Simple and the Motivation Go/No-Go tasks, whereas connectivity between the motor network and the left caudate was only related to performance on the Simple Go/No-Go task. Perhaps this pattern of activation and response inhibition performance is unique to TBI, or perhaps we would have observed left caudate engagement during both tasks if we had had a larger sample size. Another consideration, as noted, is the need for a better understanding of the role of motivation and punishment among adolescents with and without brain injury. It is possible that our Motivation Go/No-Go paradigm provided greater incentive for generating fast responses and insufficient incentive for inhibition. More research illuminating the neural correlates of functional deficits is essential in patient populations, as this information can be used to develop and measure effectiveness of interventions.
Conclusion
These findings demonstrate a relationship between impairments in response inhibition and altered functional intrinsic connectivity within a corticostriatal motor network after pediatric TBI. Findings such as these are essential for better understanding of chronic pediatric TBI and provide avenues for future intervention studies in this population.
Footnotes
Acknowledgments
This research was supported by the National Institutes of Health (J.S. 5T32HD007414), (S.M., R01MH078160 & R01MH085328), (S.S., K23HD06161) the National Institute of Health National Center for Research Resources Clinical and Translational Science Awards Program (S.S., UL1TR001079-04), and the Rehabilitation Research Experience for Medical Students (RREMS) Program (JG).
Author Disclosure Statement
No competing financial interests exist.
References
Supplementary Material
Please find the following supplemental material available below.
For Open Access articles published under a Creative Commons License, all supplemental material carries the same license as the article it is associated with.
For non-Open Access articles published, all supplemental material carries a non-exclusive license, and permission requests for re-use of supplemental material or any part of supplemental material shall be sent directly to the copyright owner as specified in the copyright notice associated with the article.