
Abstract
The aim of this study is to determine the strength and accuracy of diffusion tensor imaging (DTI) parameters to predict neurological injury and recovery in adult cervical spinal cord injury (SCI). DTI magnetic resonance imaging (MRI) was performed on 23 acute cervical SCI patients within 12 h after injury and on 45 controls utilizing a rapid DTI sequence (∼5 min). Neurological assessments were conducted from within 24 h of injury up to 6 months utilizing detailed International Standards for Neurological Classification of Spinal Cord Injury (ISNCSCI) examinations. Spearman correlation and receiver operating characteristic (ROC) analysis were used to identify relationships between the DTI parameters at the lesion epicenter and adjacent regions, with injury severity and recovery.
In proximity to the anatomical injury (within one level above and below epicenter), there was significant reduction in fractional anisotropy (FA), and elevation in mean diffusivity (MD) and radial diffusivity (RD). DTI values measured one level rostral to the injury epicenter showed stronger correlations with multiple clinical features at several time-points. Area under the curve (AUC) obtained from ROC analysis showed FA (AUC = 0.77) measured at lesion epicenter, and FA (0.83), MD (0.76), and RD (0.83) values measured immediately rostral (one level above) to epicenter discriminate injury severity. Further, MD (0.78) measured at lesion epicenter, and MD (0.79) and RD (0.74) values measured immediately rostral to epicenter discriminate neurological recovery. DTI indices measured immediately rostral to the anatomical level of injury consistently showed better correlation (moderate to strong) and accuracy in predicting neurological injury (FA, r = −0.51 and RD, r = 0.54) and recovery (MD, r = −0.51) than indices measured at the epicenter. There was weak to moderate correlation of all measures at lesion epicenter in predicting neurological injury (FA: r = −0.48; MD: r = 0.23; RD: r = 0.34; axial diffusivity [AD]: r = 0.02) and recovery (FA: r = 0.27; MD: r = −0.44; RD: r = −0.35; AD: r = −0.34).
Introduction
Anatomical magnetic resonance imaging (MRI) has been shown to correlate with initial neurological deficit and has a distinct albeit limited capacity to forecast recovery after spinal cord injury (SCI). 1 –5 Parameters derived from diffusion tensor imaging (DTI) are an indirect measure of the integrity of the white matter in neural tissues. 6 This technique has been in use experimentally and clinically for a diverse range of clinical applications from traumatic brain injury to psychiatric diseases. 7 As a result, there has been considerable interest in assessing the applicability of DTI in spinal cord disease. 8 –22
The earliest case report that utilized diffusion-weighted imaging (DWI) in acute human SCI noted that fractional anisotropy (FA) values decreased and the apparent diffusion coefficient (ADC) increased acutely at the site of injury, potentially due to cellular and axonal swelling. 23 DTI has been shown to identify spared white matter around the periphery of the syrinx, underscoring the potential for visualizing spared white matter following trauma. 24 In patients with cervical spondylotic myelopathy, it has been demonstrated that diffusion MRI is sensitive to clinical features of myelopathy. 25 DTI may also be able to determine the severity and directionality of glial scarring in the gray matter following injury, which may remain undetected with conventional MRI. 26,27 As some current therapies are focused on decreasing the degree of glial scarring following injury, DTI may provide an important non-invasive outcome measure for neural recovery.
There is a need for a reliable objective assessment of SCI as the accuracy of the neurological evaluation can be variable in the acute period and the initial clinical assessment may not always offer any direct measure of recovery capacity. 28 For this reason, neuroprotective and neuroregenerative SCI clinical trials designed to test novel therapies have focused on MRI as a non-invasive measure of injury extent and as a method to direct targeted therapies. Even with the supplemental information provided by anatomical MRI in conjunction with the neurological assessment, the minimum number of patients that would need to be enrolled in a therapeutic trial to demonstrate efficacy is prohibitive. 29 DTI may play a complementary role in assessing damage and forecasting recovery after SCI, especially in instances when the reliability of the neurological exam is called into question. 28 DTI may improve the precision for stratifying SCI patients who are being selected for clinical trials to test novel therapies. Therapeutic trials that utilize metrics derived from MRI and DTI at the point of care may provide a reliable surrogate for the neurological examination in the acute period when a complete neurological examination is impractical or unreliable. Parameters that include MRI and DTI values could potentially be used to stratify and select patients for early therapeutic interventions.
The goal of this study was to determine if human SCI DTI data obtained using commercially available pulse sequences can be used as a surrogate for clinical measures of neurological deficit at the time of injury and to assess the strength and accuracy of these measures in forecasting neurological recovery.
Method
Subject recruitment
This study was approved by the local Institutional Review Board (IRB) with Health Insurance Portability and Accountability Act (HIPAA) compliant data processing methods. The study represents a retrospective analysis of prospectively acquired data. Adult SCI patients were recruited prospectively by two of the co-investigators over a 3-year period (2011–14). Recruited patients agreed to undergo periodic neurological examinations according to the International Standards for Neurological Classification of Spinal Cord Injury (ISNCSCI) to define the neurological level of injury. Also, severity of injury was classified by the American Spinal Injury Association Impairment Scale (AIS). This scale classifies the injury as complete or incomplete depending upon the degree of preserved motor or sensory function. 30
The inclusion criteria for isolated non-penetrating cervical SCI patients were: complete initial ISNCSCI evaluation within 24 h following injury and a final assessment of motor recovery index no earlier than 6 months after the injury, and an MRI study of the cervical spine obtained within 12 h of the initial injury. The exclusion criteria included contraindication for MR imaging, penetrating trauma, and comorbidity that would reduce the accuracy of the clinical examination. One hundred five acute cervical SCI patients were initially evaluated for participation during the recruitment period. Control data were derived from 45 non-SCI trauma patients. Our control cohort included 19 males and 26 females, ranging in age from 25 to 58 years (mean age of 38).
Twenty-three acute traumatic cervical SCI patients met inclusion criteria out of 105 that were eligible. Our cohort included 17 males and 6 females, ranging in age from 25 to 81 years (mean age of 53). The patient cohort included 1 patient classified as AIS A (complete spinal cord injury), 5 as AIS B (sensory incomplete), 6 as AIS C (motor incomplete), and 11 as AIS D (sensory and motor incomplete). Neurological level of injury (NLI) for this patient cohort was at: C1 (n = 1), C2 (n = 3), C3 (n = 1), C4 (n = 5), C5 (n = 8), C6 (n = 3), and C8 (n = 2).
Neurological assessments were conducted: (1) within 24 h of injury, at 1 week, 2 weeks, 3 months, and 6 months post-injury. A modified aggregate composite motor and sensory score was generated based on the Yale Scale Score (YSS) for spinal cord trauma providing a measure of the proportion of preserved lower-extremity motor and sensory function without deep-pain assessment. 31 The total number of individual muscles capable of minimally useful motor function (antigravity strength or better) at least 6 months post-injury was compared with the number of muscles with minimally useful motor recovery at the time of injury. As the patient cohort was insufficient to account for each cervical neurological level of injury, analysis focused on lower-extremity motor recovery alone.
A dichotomous score for SCI severity was created by stratifying patients into two groups based upon initial lower-extremity motor score (LEMS) for the lower extremities using a threshold of 30 (50 maximum): (1) mild injury (LEMS ≥30) and (2) severe injury (LEMS <30). Similarly, a dichotomous recovery score was calculated using a combination of recovery rates for lower-extremity useful muscles and YSS with a threshold of 0.5: (1) good recovery was given by a recovery rate greater than 0.5 and (2) poor recovery was designated by a recovery rate less than or equal to 0.5. Recovery rate was determined by comparing an initial LEMS (at time of admission) to a final motor score (at 6 months) relative to the largest potential improvement in motor score (final – initial)/(maximum – initial) as given by the method described by Lucas and Ducker. 32 Final functional outcomes for the upper and lower extremities were also assessed using two additional clinical instruments: the self-care subscale of the Spinal Cord Independence Measure (SCIM) and the Walking Index for Spinal Cord Injury (WISCI-II) to evaluate lower-extremity functional recovery.
Image acquisition
MR imaging was conducted on a 1.5 Tesla (Achieva, Philips Healthcare, Netherlands) unit with a 16-channel neurovascular array coil (Philips Healthcare) including eight head, four neck, and four chest elements. The morphology, length, and location of the spinal cord lesion were assessed on mid-sagittal MR images using one tilted slab perpendicular to the spinal cord covering the entire cervical spinal cord (C1 to C7–T1 levels). The protocol consisted of an initial turbo spin echo (TSE) T2-weighted image (T2WI) scout sagittal scan of the cervical spinal cord. The sagittal images were used to prescribe axial sections of the cervical spinal cord. Next, axial TSE T2WI, axial TSE T1WI, axial gradient echo sequence (GRE) T2WI, sagittal TSE T1WI, sagittal TSE T2WI, and axial DTI scans were obtained. Relative reference points from the lesion epicenter were identified in each patient by an independent board-certified neuroradiologist. The length and location of hemorrhage, edema, and epicenter were recorded relative to the anatomical location of the nearest adjacent vertebral segment subdivided into four equal parts (Fig. 1).
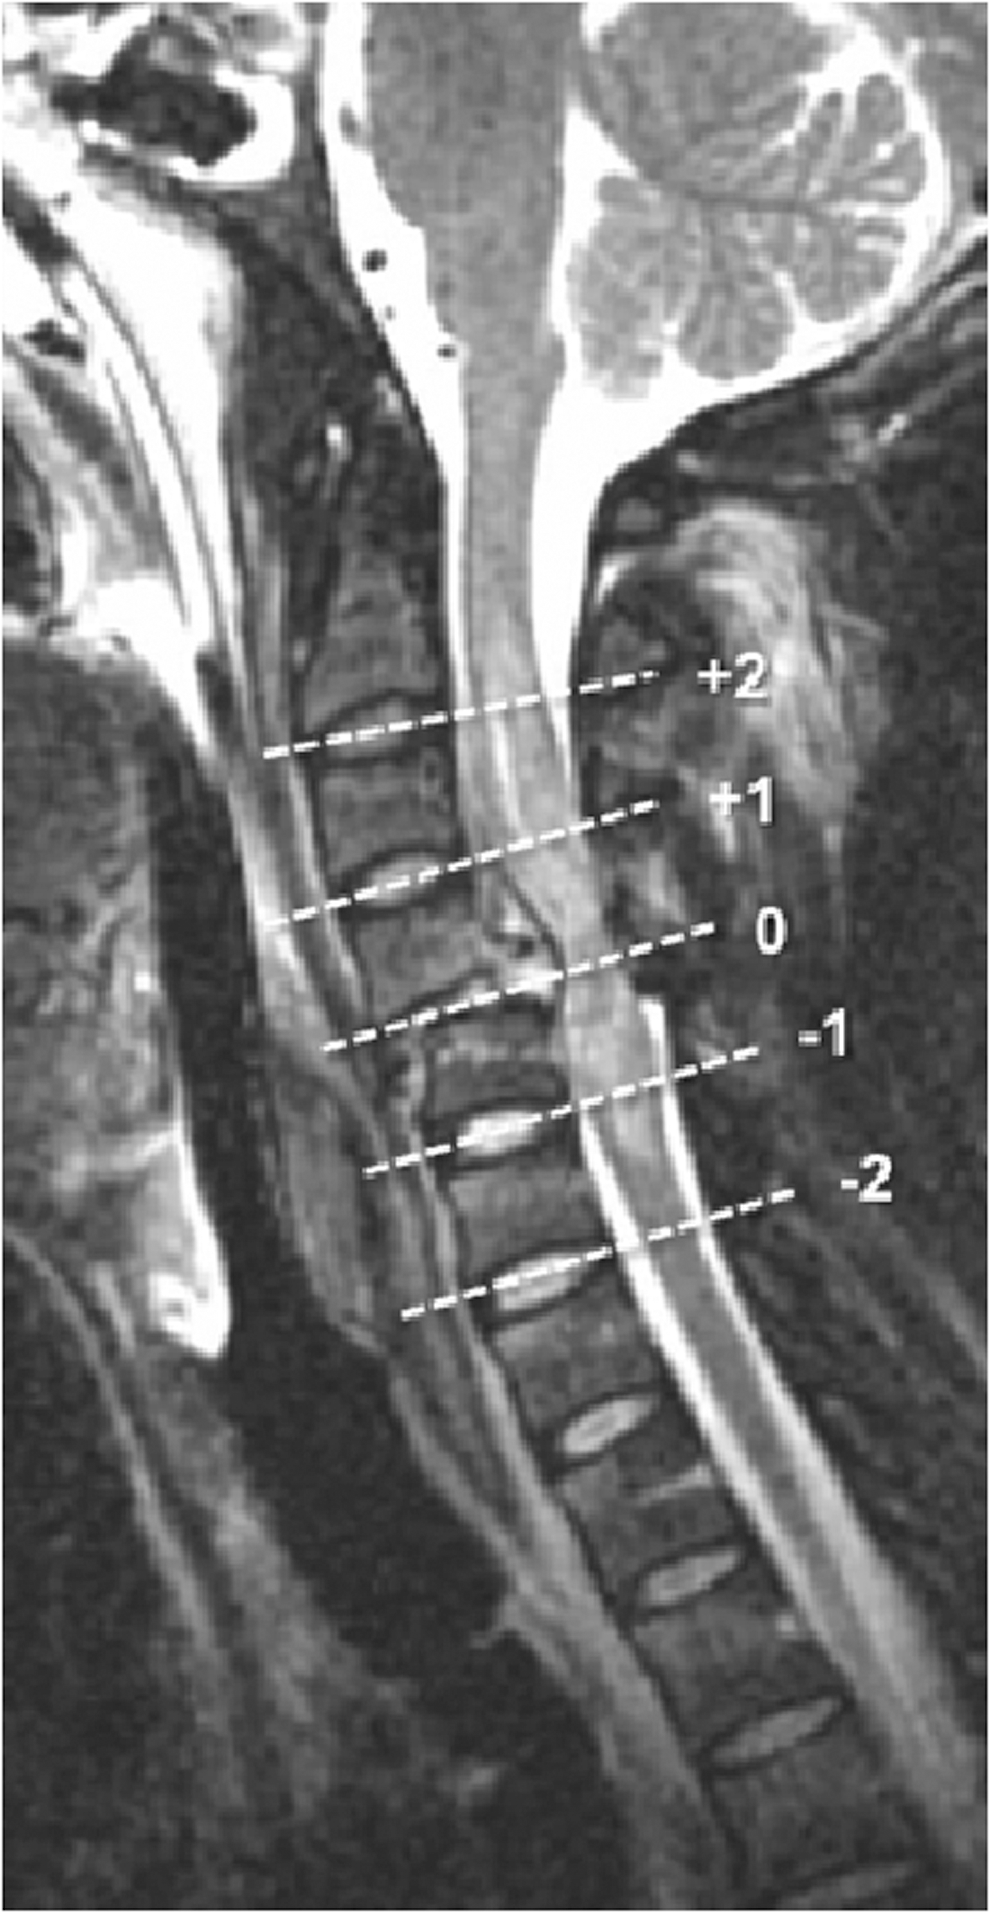
Relative axial slice locations for DTI acquisition. Mid-sagittal T2-weighted FSE image of a spinal cord injury centered at the C4–C5 interspace. Dashed lines show relative locations of the axial DTI images to the injury center (0). DTI slice locations +1 and +2 are one and two levels above lesion center respectively. DTI, diffusion tensor imaging; FSE, fast spin echo.
A rotated frame-of-reference with DTI acquisition was employed to obtain axial images that were more closely perpendicular to the long axis of the spinal cord. A mid-sagittal T2WI was obtained to orient the scan (excitation) plane to be perpendicular to the approximate longitudinal plane of the cervical spinal cord utilizing a U.S. Food and Drug Administration (FDA)-approved, full-field single-shot echo planar imaging (ssEPI) sequence or a zonally magnified oblique multi-slice EPI (ZOOM-EPI) technique. The improved ZOOM-EPI technique was employed midway through patient recruitment because of recent FDA clearance.
DTI scan parameters of the full-field ssEPI sequence were: repetition time (TR) = 6176, echo time (TE) = 82, field of view (FOV) = 22 cm, matrix size = 220 × 130, and voxel size = 1.53 × 1.53 × 4 mm3. ZOOM-EPI scan parameters were: TR = 4950, TE = 95, FOV = 11 cm, matrix size = 96 × 96, and voxel size = 1.53 × 1.53 × 4 mm3. Both sequences used six directions at b = 800 sec/mm2. Acquisition time of each technique was kept under 5 min. The imaging acquisition time was deliberately minimized to make it as clinically practical as possible, therefore neither gating nor anesthesia were used during scanning. A total of 22 non-injured and 12 SCI patients were scanned using a full-field ssEPI sequence, and 23 non-injured and 11 SCI patients were scanned using a ZOOM sequence. For both techniques, manual shim and fat saturation volume adjustments were performed before data acquisition to confine the adjustment volume to the anatomy of interest as much as possible to limit residual distortions and chemical-shift artifacts. Control DTI data were obtained in normal cervical cords for both methods.
Statistical analysis
Initially, DTI volumes were corrected for motion-induced artifacts by aligning diffusion directional images to the reference image (b0) based on affine transformation technique (Philips ViewForum Workstation R6.3, Best, Netherlands). Next, DTI scalars including FA, mean diffusivity (MD), axial diffusivity (AD), and radial diffusivity (RD) were computed using linear estimation of tensor (Philips FiberTrack Module, Best, Netherlands).
To obtain DTI metrics, regions of interest (ROIs) were manually placed at each cervical intervertebral disc level on the generated FA map in the axial plane. These intervertebral disc levels included: C1–C2, C2–C3, C3–C4, C4–C5, C5–C6, C6–C7, and C7–T1. Each ROI was drawn within a distance of 1–2 voxels of the cord boundary to prevent partial volume effects from the nearby cord–cerebrospinal fluid (CSF) junction. Figure 2 represents ROI emplacement at each intervertebral disc level for control, mild, and severe SCI cases.
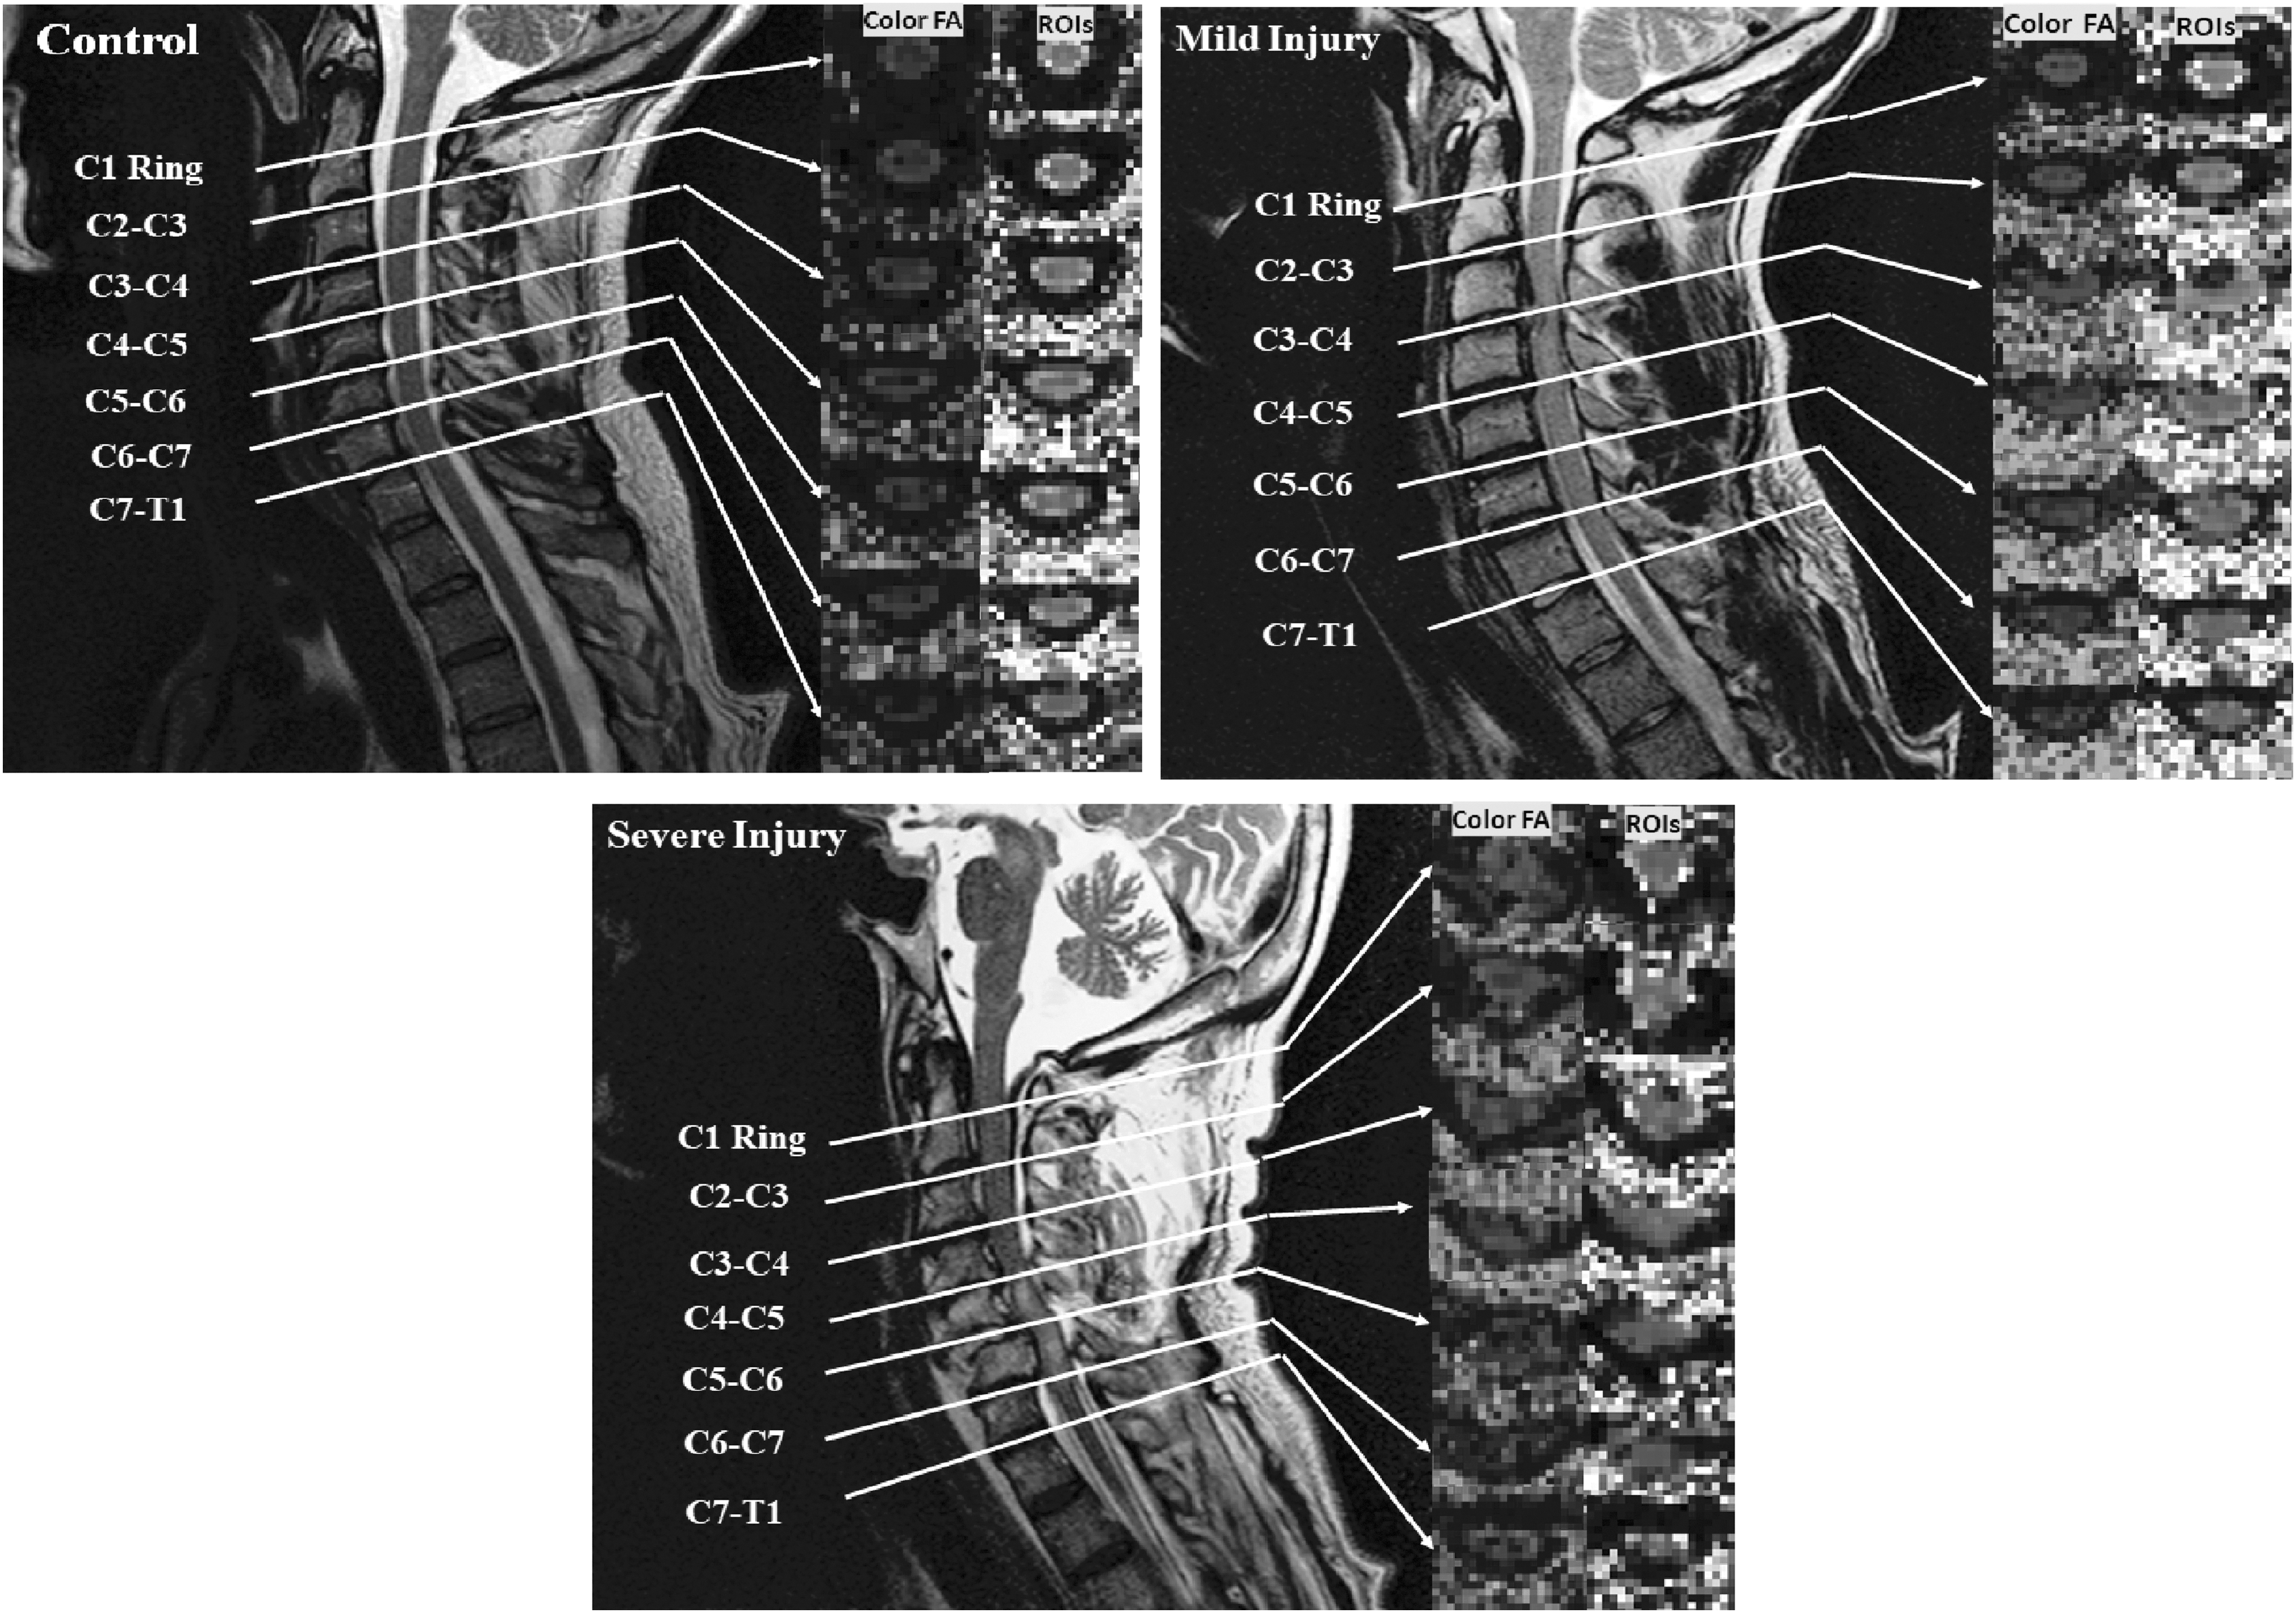
Illustration of placement of ROIs on an FA map after being anatomically localized by level by a board-certified neuroradiologist in three different cases including control, and mild and severe SCI patients. Level of injuries were defined at C3–C4 for a patient with mild injury and C5–C6 for a patient with severe injury. FA, fractional anisotropy; ROI, region of interest; SCI, spinal cord injury.
DTI values were then averaged over the whole cord ROI. The control subject exams collected using the two EPI methods were employed to transform the patient data into normalized values using a z-score. 32 Because control data were available for both DTI techniques, z-scores were calculated for each DTI parameter at each location for every patient. In this study, separate control means and standard deviations (SDs) were computed for each of the two DTI methods (ZOOM and full-field EPI) and the z-score was used to normalize the data for each acquisition technique. Each patient's z-score was computed using the control mean and SD appropriate for that patient's DTI scan method. For the SCI patients who were scanned using the ZOOM sequence (n = 11), the z-score was computed with the single pooled mean and SD of controls (n = 23) scanned with the same sequence. Similarly, for the SCI patients who were scanned based on a full-field ss-EPI sequence (n = 13), the z-score was computed using mean and SD of the controls (n = 22) scanned with the same sequence.
Each patient DTI data set was co-registered by lesion center. Analysis of variance (ANOVA; with Dunnet-Hsu adjustment) was performed for the entire data set to determine statistically significant differences in the cardinal DTI values indexed relative to the anatomical location of the SCI epicenter. An exploratory assessment was performed that compared all MRI/DTI parameters against all neurological subscores and recovery parameters. To compare these non-parametric data sets, Spearman rank-order correlation was used to identify heretofore expected and unexpected relationships between dependent and independent variables (p < 0.05).
An ROC analysis was performed using the independent variables that exhibited the highest correlation with lower-extremity motor deficit and recovery to determine the accuracy of various DTI z-scores in predicting severity of SCI and in discriminating recovery. SCI severity was stratified by a LEMS of less than 30 (50 total possible). Note that a threshold value of 30 was chosen empirically based on ROC analysis for different threshold values and optimal cutpoint values. Best discrimination in respect to severity of injury was found at the value of 30. Lower-extremity motor recovery was stratified by a threshold of greater than 50% motor recovery rate.
Results
Tables 1 and 2 represent absolute values of DTI measures for control and SCI groups averaged along all subjects at each cervical intervertebral disc level scanned using full-field ss-EPI and ZOOM-EPI, respectively. Overall, a decrease in FA and an increase in AD, MD, and RD were demonstrated in the SCI group compared with controls with both DTI techniques.
DTI Measures for Control and SCI Groups Averaged along All Subjects at Each Cervical Intervertebral Disc Level Scanned Using Full-Field ss-EPI
AD, axial diffusivity; DTI, diffusion tensor imaging; FA, fractional anisotropy; MD, mean diffusivity; RD, radial diffusivity; SCI, spinal cord injury; ss-EPI, single-shot echo planar imaging.
DTI Measures for Control and SCI Groups Averaged along All Subjects at Each Cervical Intervertebral Disc Level Scanned Using ZOOM-EPI
AD, axial diffusivity; DTI, diffusion tensor imaging; FA, fractional anisotropy; MD, mean diffusivity; RD, radial diffusivity; SCI, spinal cord injury; ZOOM-EPI, zonally magnified oblique multi-slice echo planar imaging.
Correlation of DTI features to neurological deficit and recovery
Figure 3 shows the relationship of the DTI z-scores relative to the proximity of injury center for patients dichotomized based upon severity of initial lower-extremity motor score (LEMS), with the severe category designated as an LEMS <30 (50 maximum total). Mild injuries (i.e., LEMS ≥30) in general had lower FA, MD, and RD absolute z-scores relative to the severe category (i.e., LEMS <30), with two-way ANOVA demonstrating significant (p < 0.05) difference between injury severity (mild to moderate vs. severe). AD was the only parameter that had no apparent discriminatory value.
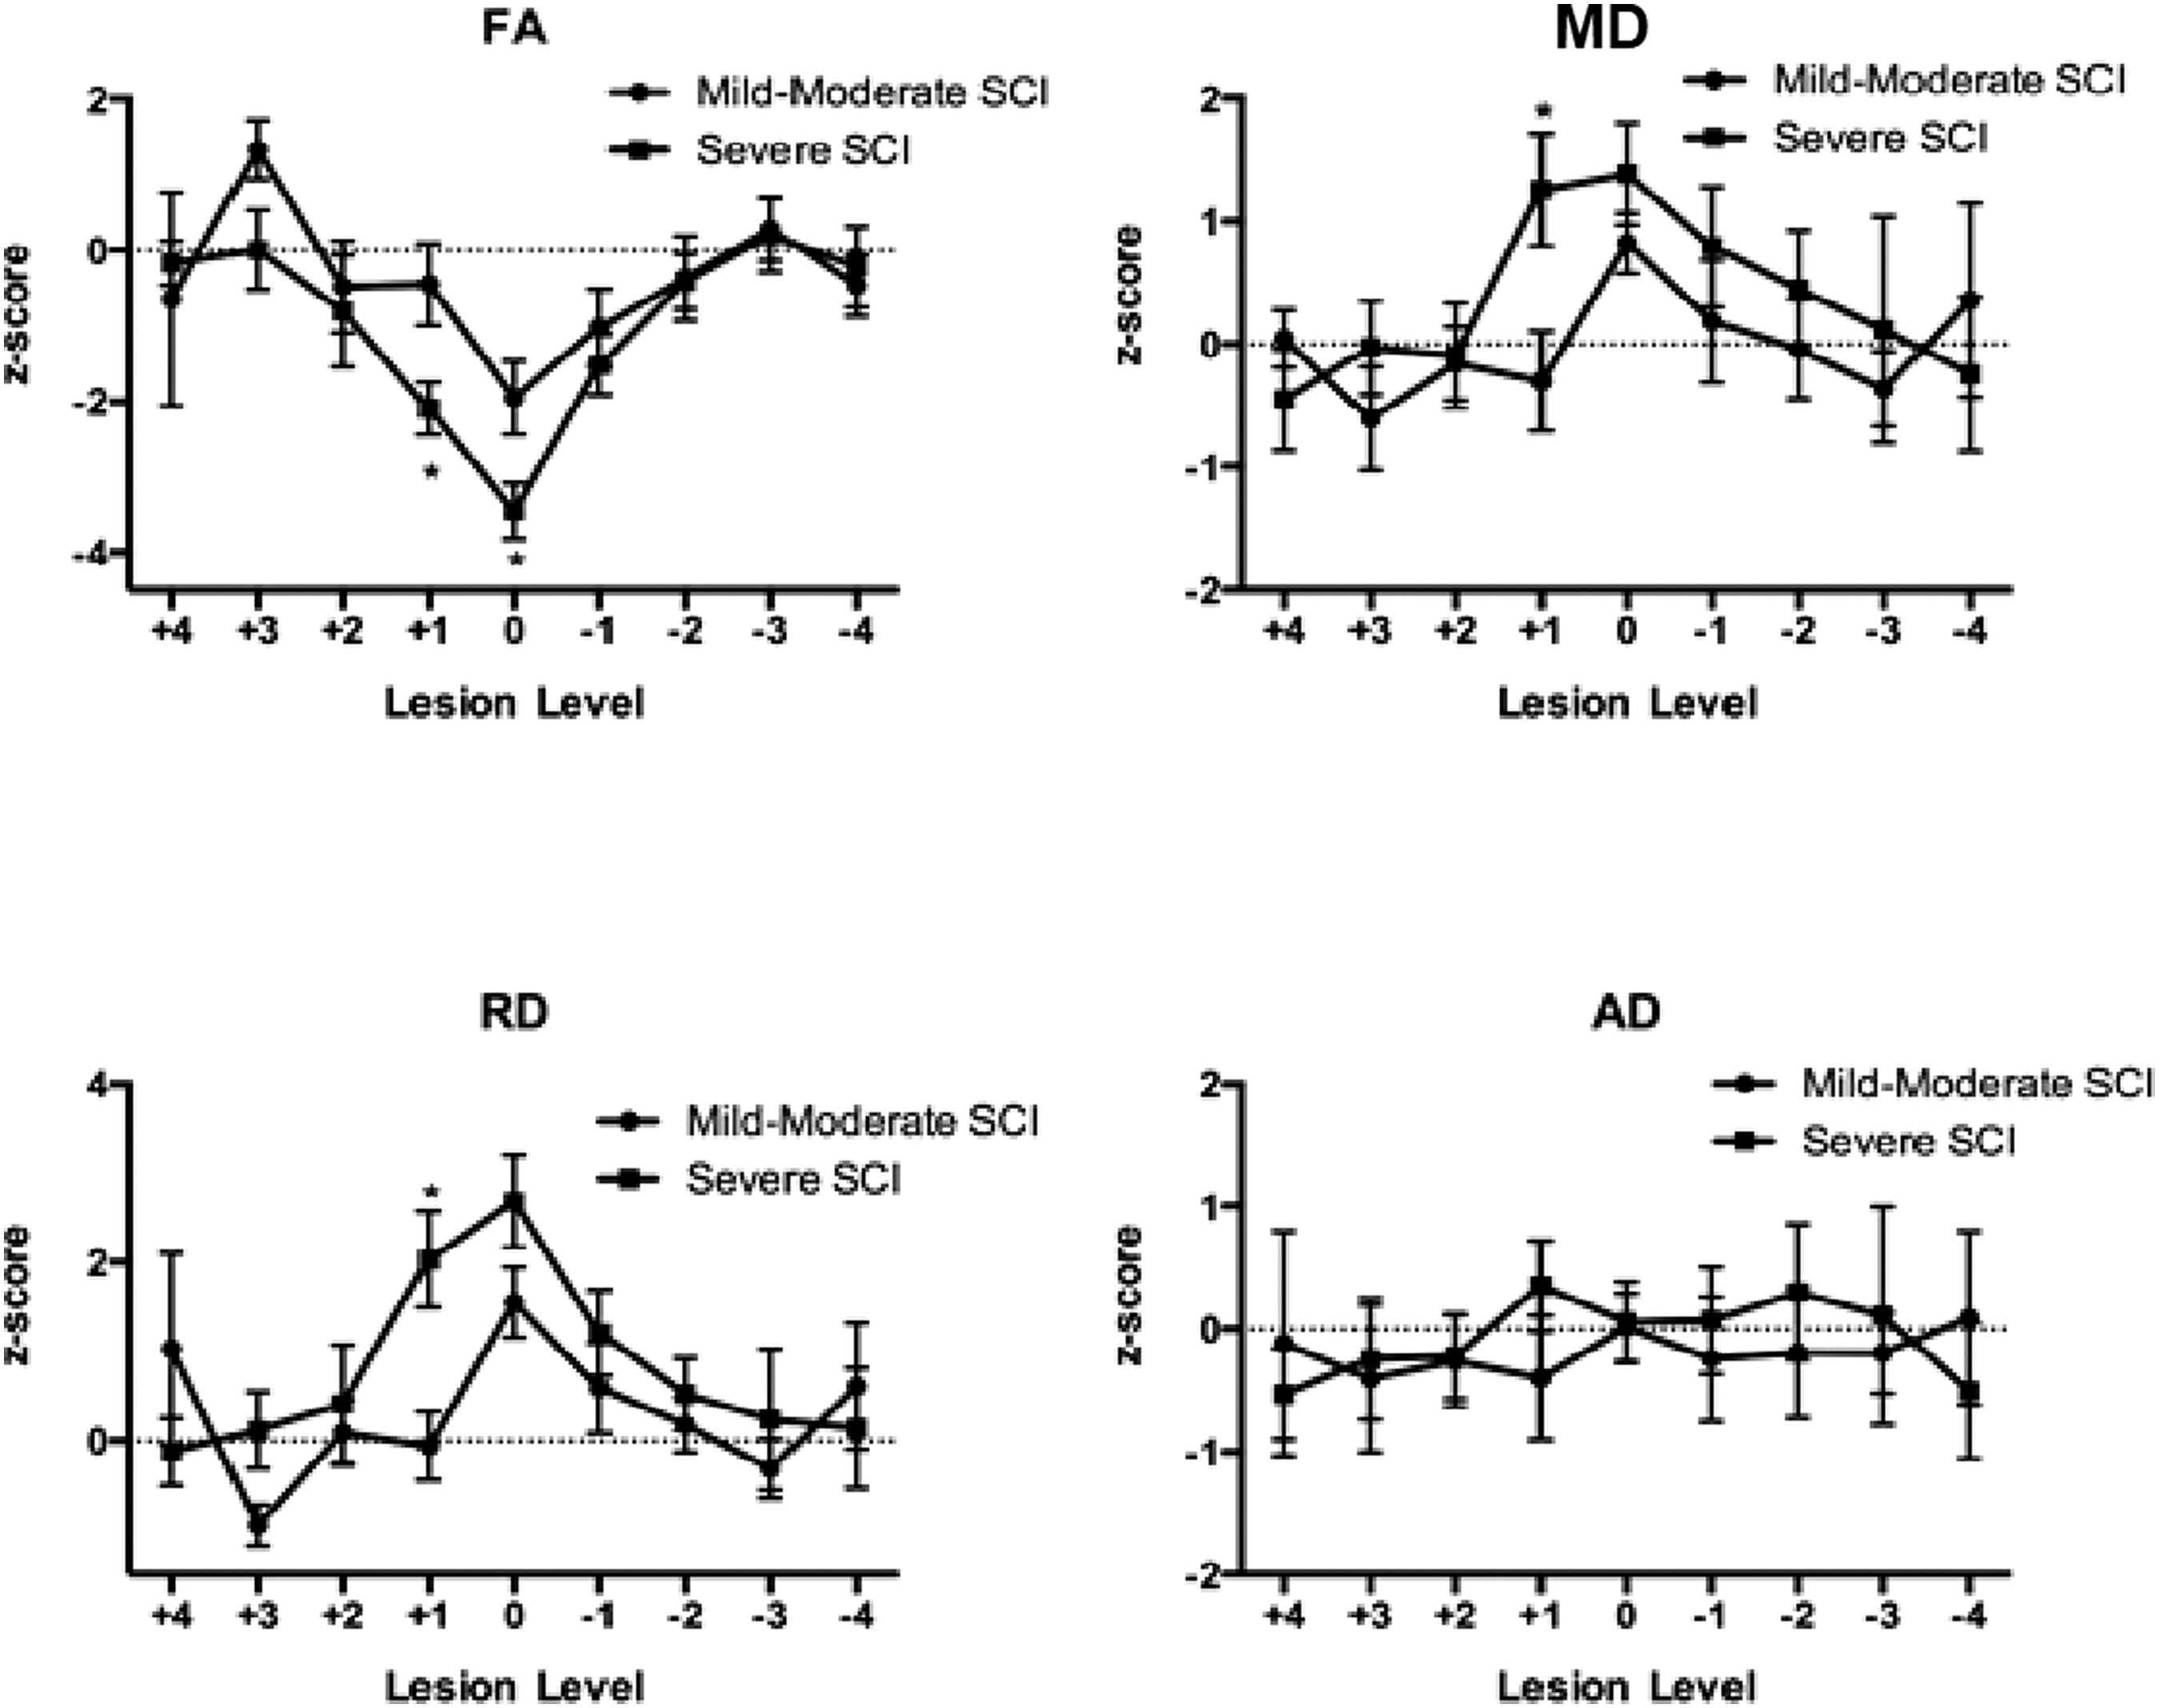
Relationship of DTI parameters to SCI severity. FA, MD, RD, and AD in proximity to the lesion epicenter are dichotomized based upon severity of initial LEMS, with the severe category designated as a LEMS <30 (50 maximum total). Data are co-registered to injury epicenter and represent mean ± SD of z-scores of DTI parameters normalized to equivalent spinal level in normal controls (see Methods section). *p < 0.05 compared with “mild–moderate SCI” by two-way ANOVA with post hoc pair-wise analysis. AD, axial diffusivity; ANOVA, analysis of variance; DTI, diffusion tensor imaging; FA, fractional anisotropy; LEMS, lower-extremity motor score; MD, mean diffusivity; RD, radial diffusivity; SCI spinal cord injury; SD, standard deviation.
All four cardinal DTI features obtained at the level of injury and immediately proximal to the level of injury discriminated between the good and poor recovery groups. “Good” recovery was denoted by higher FA and lower MD, RD, and AD absolute z-scores compared with “poor” recovery. Post hoc analysis of recovery curves demonstrated a statistically significant difference for values measured one level cranial (+1) to the lesion epicenter for MD, RD, and AD (Fig. 4). The DTI profile curves also differed by DTI parameter; FA and RD changes were most dependent upon proximity to the lesion center, whereas MD and AD changes spanned a longer distance of the spinal cord.
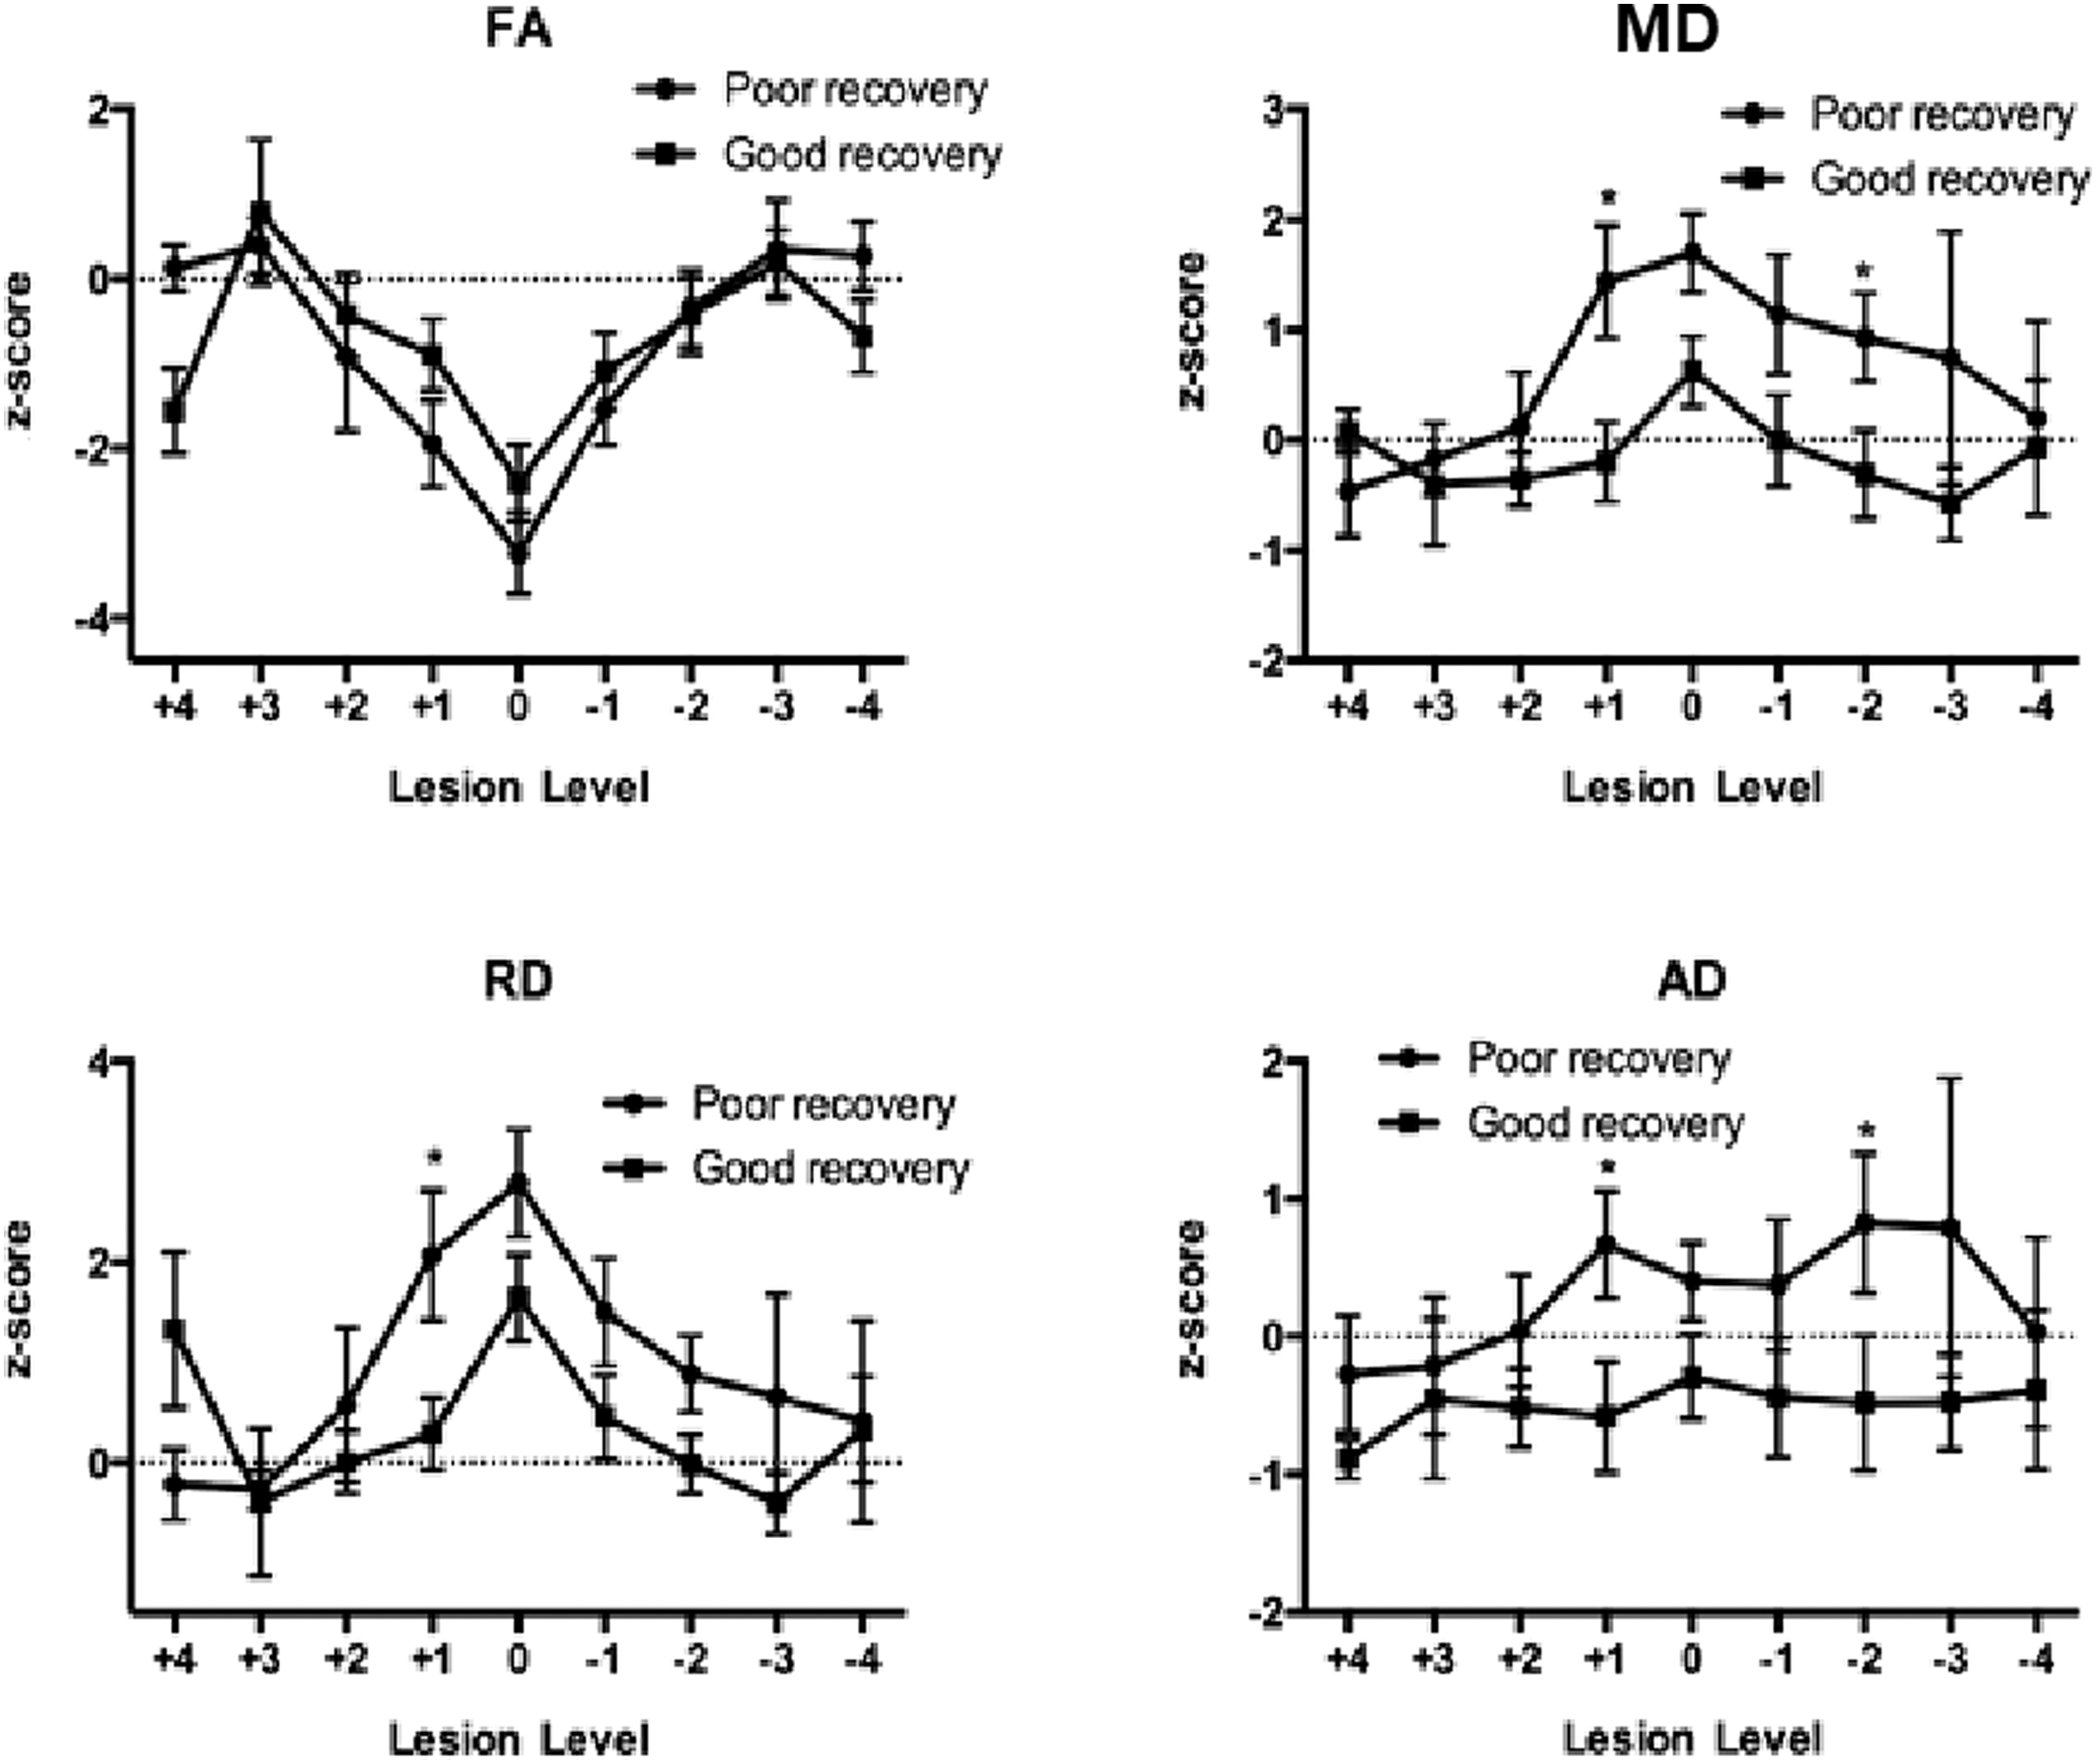
Relationship of DTI parameters to neurological recovery. FA, MD, RD, and AD in proximity to the lesion epicenter are dichotomized based upon Lucas and Ducker recovery scores for lower-extremity motor scores (LEMS). Good recovery denotes recovery of >0.5 and poor recovery a calculation of ≤0.5. Data are co-registered to injury epicenter and represent mean ± SD of z-scores of DTI parameters normalized to equivalent spinal level in normal controls (see Methods section). *p < 0.05 compared with “mild–moderate SCI” by two-way ANOVA with post hoc pair-wise analysis. AD, axial diffusivity; ANOVA, analysis of variance; DTI, diffusion tensor imaging; FA, fractional anisotropy; MD, mean diffusivity; RD, radial diffusivity; SCI spinal cord injury; SD, standard deviation.
Given the significant difference in dichotomized neurological severity and recovery data (Figs. 3 and 4) measured at a level rostral (+1 level) to injury epicenter, an exploratory analysis of correlations with the dependent clinical variables was performed for each adjacent anatomical index level in proximity to the lesion center. Spearman correlations for the four cardinal DTI z-scores at the anatomical level immediately cranial to the lesion epicenter are shown in Table 3. Compared with the identical comparison performed at the SCI lesion center there was a marked increase in the number of statistically significant correlations with the neurological parameters and the magnitudes of the correlations on average were more substantial. Whereas FA exhibited the largest correlation with the neurological parameters at the injury center, FA, MD, and radial and axial diffusivity measured immediately cephalad to the lesion center all exhibited a significant relationship to the neurological assessment at various time-points. This relationship was not observed for any of the other adjacent levels cranial or caudal to the lesion epicenter.
Spearman Correlations between Cardinal DTI Z-scores Measured at the Adjacent Rostral Level from SCI Center Compared with Various Neurological Parameters
p < 0.05 statistically significant correlations, presented in bold for clarity.
AD, axial diffusivity; ASIA, American Spinal Injury Association; DTI, diffusion tensor imaging; FA, fractional anisotropy; LEMS, lower-extremity motor score; MD, mean diffusivity; RD, radial diffusivity; SCI, spinal cord injury; YSS, Yale Scale Score.
In addition, different relationships were also observed for the recovery parameters when compared with the DTI z-scores derived from DTI measurements made one level rostral to the injury center (Table 4). Improvement in motor function was determined by comparing an admission LEMS with a final (6-month) motor score. In this analysis, MD and RD showed the largest proportion of significant correlations with the recovery indices compared with either FA or AD. MD and RD showed significant correlation with four and five of the recovery values, whereas FA and AD showed significant correlation with two of the recovery indices (Table 4). FA measured above lesion center showed the strongest correlation to total LEMS recovery rate (r = 0.441, p = 0.040), final SCIM (r = 0.521, p = 0.041), and WISCI (highest correlation, r = 0.624, p = 0.006). MD measured above the lesion epicenter correlated with lower-extremity motor recovery. RD exhibited moderate correlation with most of the recovery parameters. AD demonstrated the weakest and least significant overall correlation to the neurological recovery indices.
Spearman Correlations between Cardinal DTI Z-scores Measured at the Adjacent Rostral Level from SCI Center Compared with Various Neurological Recovery Parameters
p < 0.05 statistically significant correlations, presented in bold for clarity.
AD, axial diffusivity; DTI, diffusion tensor imaging; FA, fractional anisotropy; LEMS, lower-extremity motor score; MD, mean diffusivity; RD, radial diffusivity; SCI, spinal cord injury; SCIM, Spinal Cord Independence Measure; WISCI, Walking Index for Spinal Cord Injury; YSS, Yale Scale Score.
Accuracy and discriminatory power of the DTI indices
ROC analysis was performed to test the accuracy and discriminatory power of the highly correlative DTI parameters found in the preceding exploratory analysis. Significance was confirmed at p < 0.05 using the Mann-Whitney U test to ensure 95% confidence intervals. The Mann-Whitney U test is a non-parametric test and is a version of the independent sample t test performed on ranked data. Mann-Whitney U follows a z distribution when the sample size is greater than 20. Figure 5 shows the results of the ROC analysis using the four DTI z-scores measured in three adjacent locations: lesion epicenter and one station above and one below the lesion epicenter. The test was to discriminate mild from severe SCI using an arbitrary threshold of 30 for LEMS. The area under the curve (AUC) was significant (p < 0.05) for FA measured at injury center and above (AUC 0.769 and 0.838, respectively), and MD and RD measured above the lesion epicenter (AUC 0.761 and 0.829, respectively). No significant discriminatory power was demonstrated for AD.
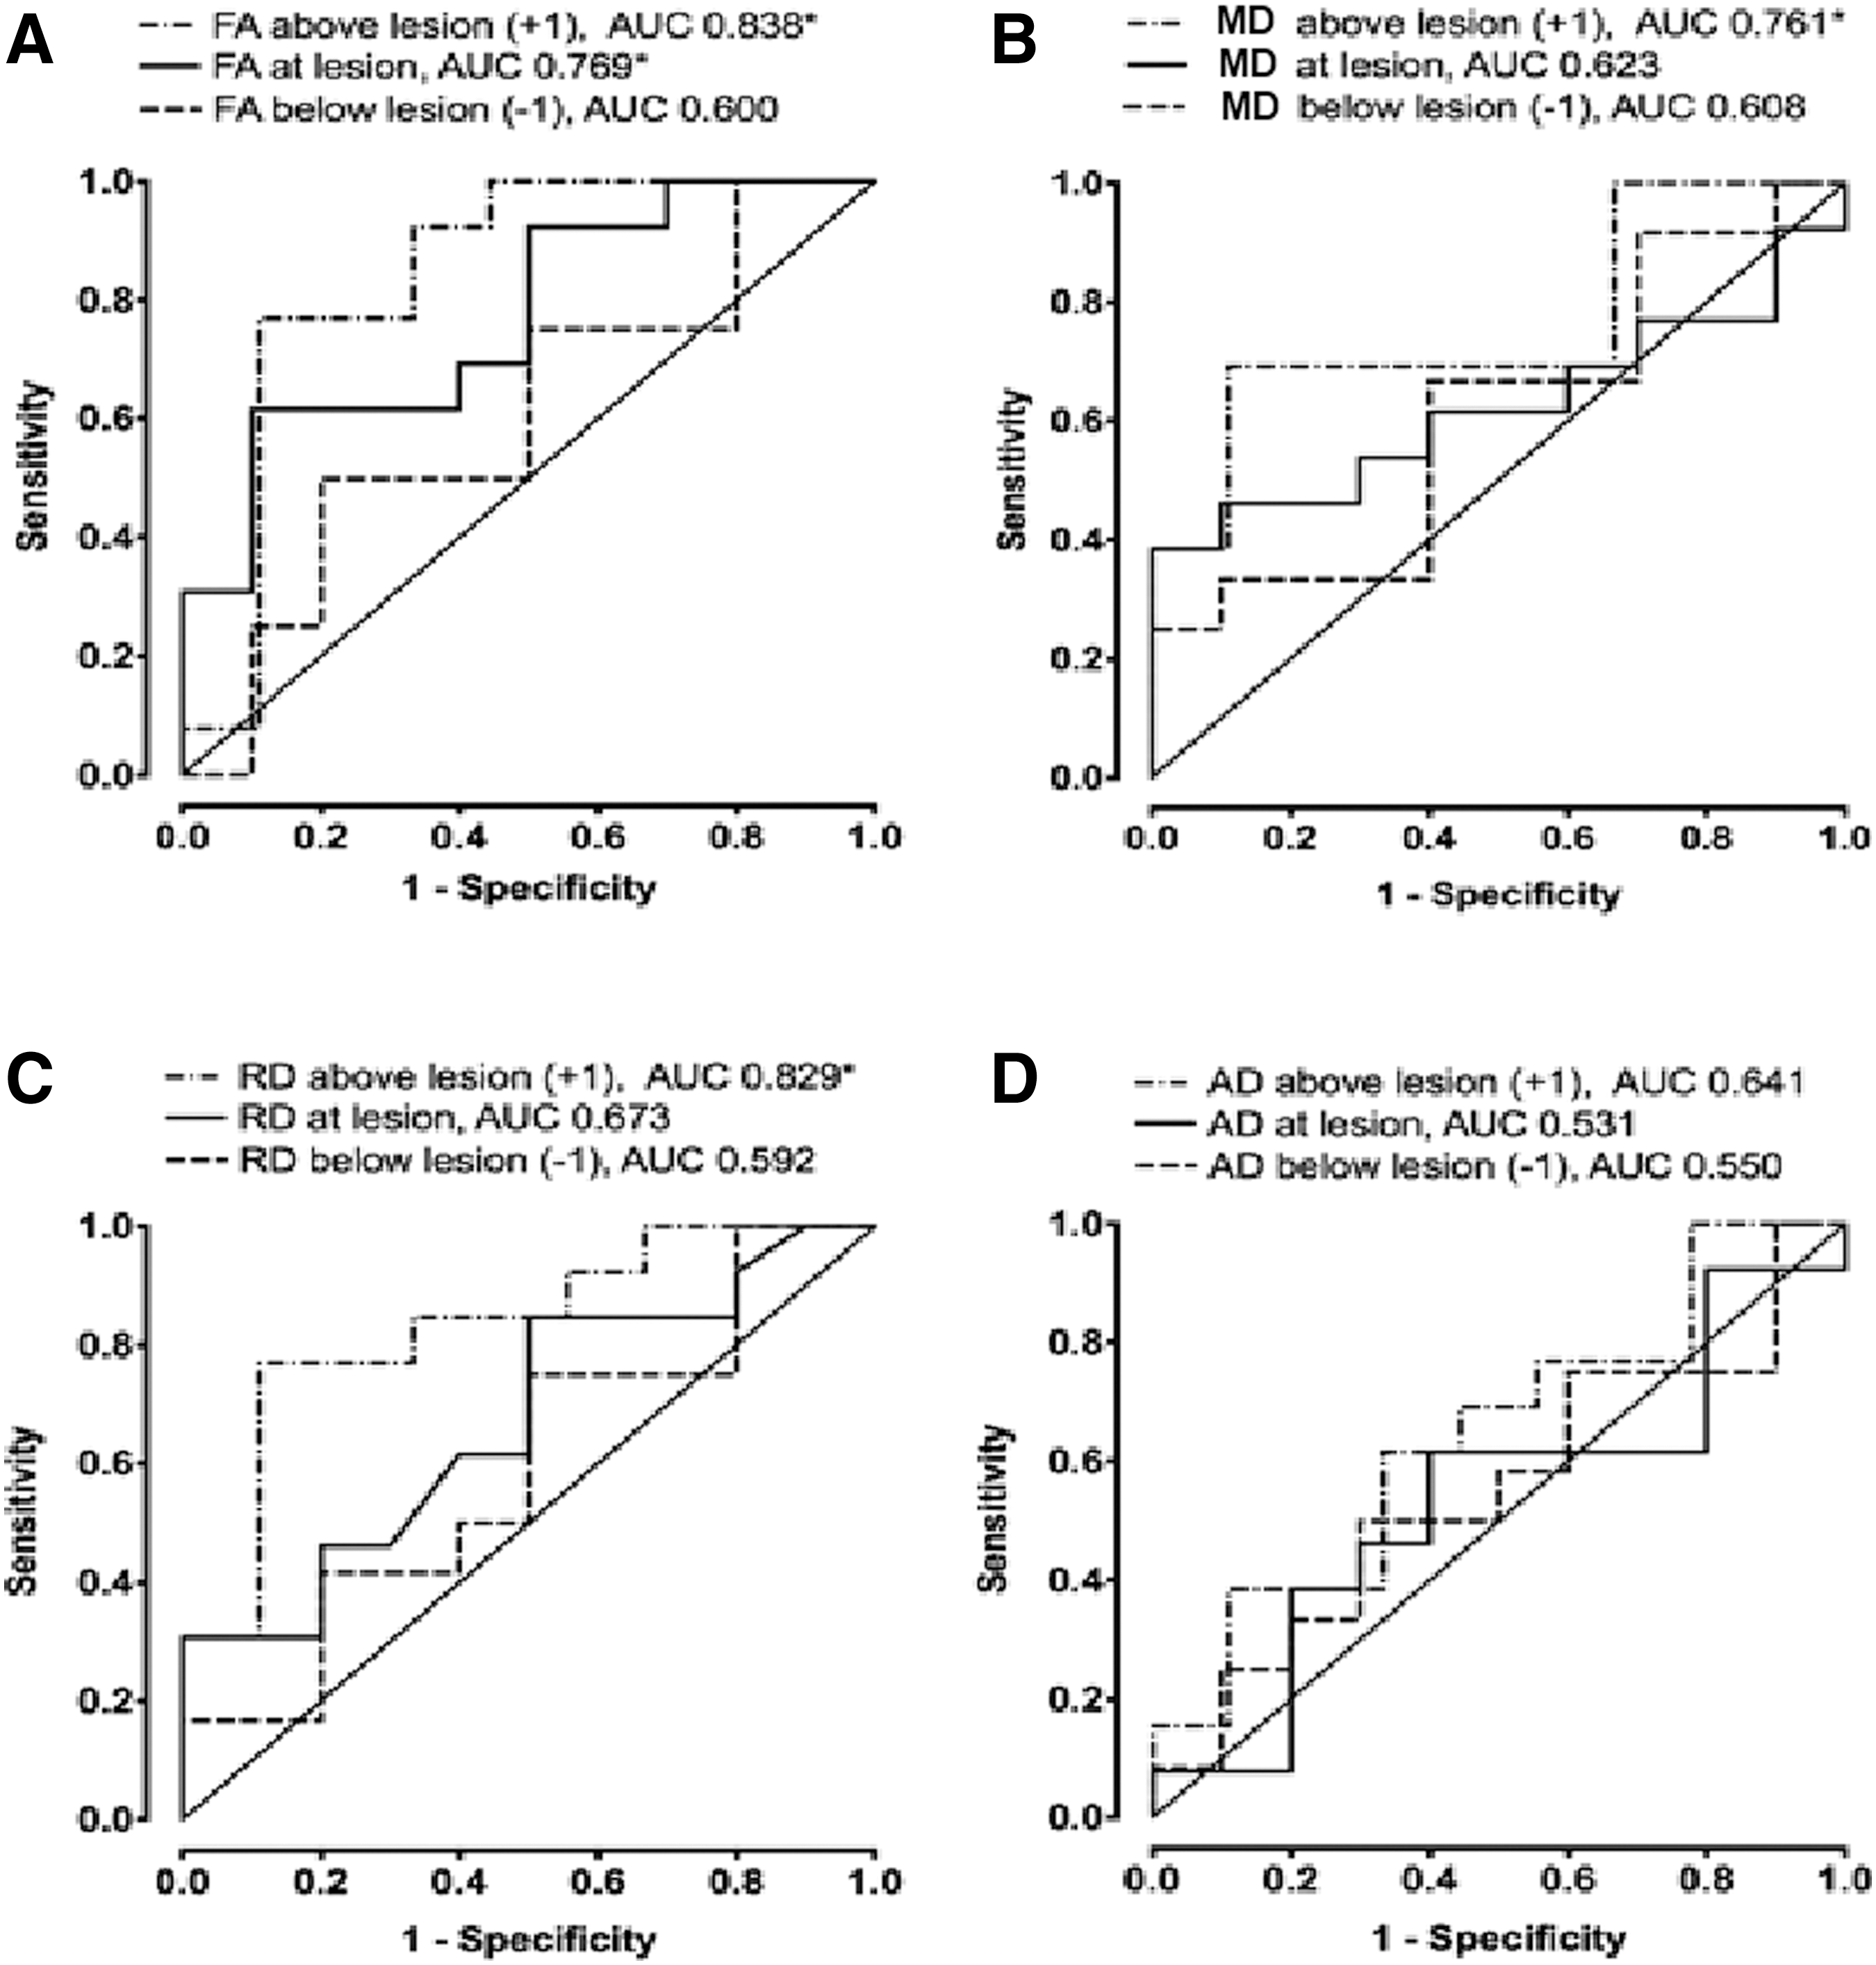
DTI parameters predicting severity of neurological injury. ROC curves of DTI parameters are created to test accuracy and discriminatory power for severity of initial neurological injury.
Finally, an ROC analysis was performed for the four cardinal DTI z-scores measured at and ± one level above and below injury epicenter to determine if lower-extremity motor recovery can be discriminated with DTI alone based upon a dichotomized threshold for a lower-extremity recovery rate of 0.5 (Fig. 6). The AUC was significant (p < 0.05) for MD measured at center, above, and below injury (AUC 0.783, 0.785, and 0.779, respectively) and for RD measured above the lesion epicenter (AUC 0.744). There was no significant discriminatory power demonstrated for FA and AD for lower-extremity motor recovery. Finally, an estimation of optimal cutoff value was performed for all significant ROC curves, which represents a DTI parameter z-score with a highest combination sensitivity/specificity for predicting the clinical outcome, along with the corresponding likelihood ratio, derived from the slope of the tangent line at cutoff points. Severe injury (LEMS <30) is predicted by an FA z-score less than −1.50 calculated at one level rostral to the lesion epicenter with a sensitivity of 77%, a specificity of 89%, and a likelihood ratio of 6.92.
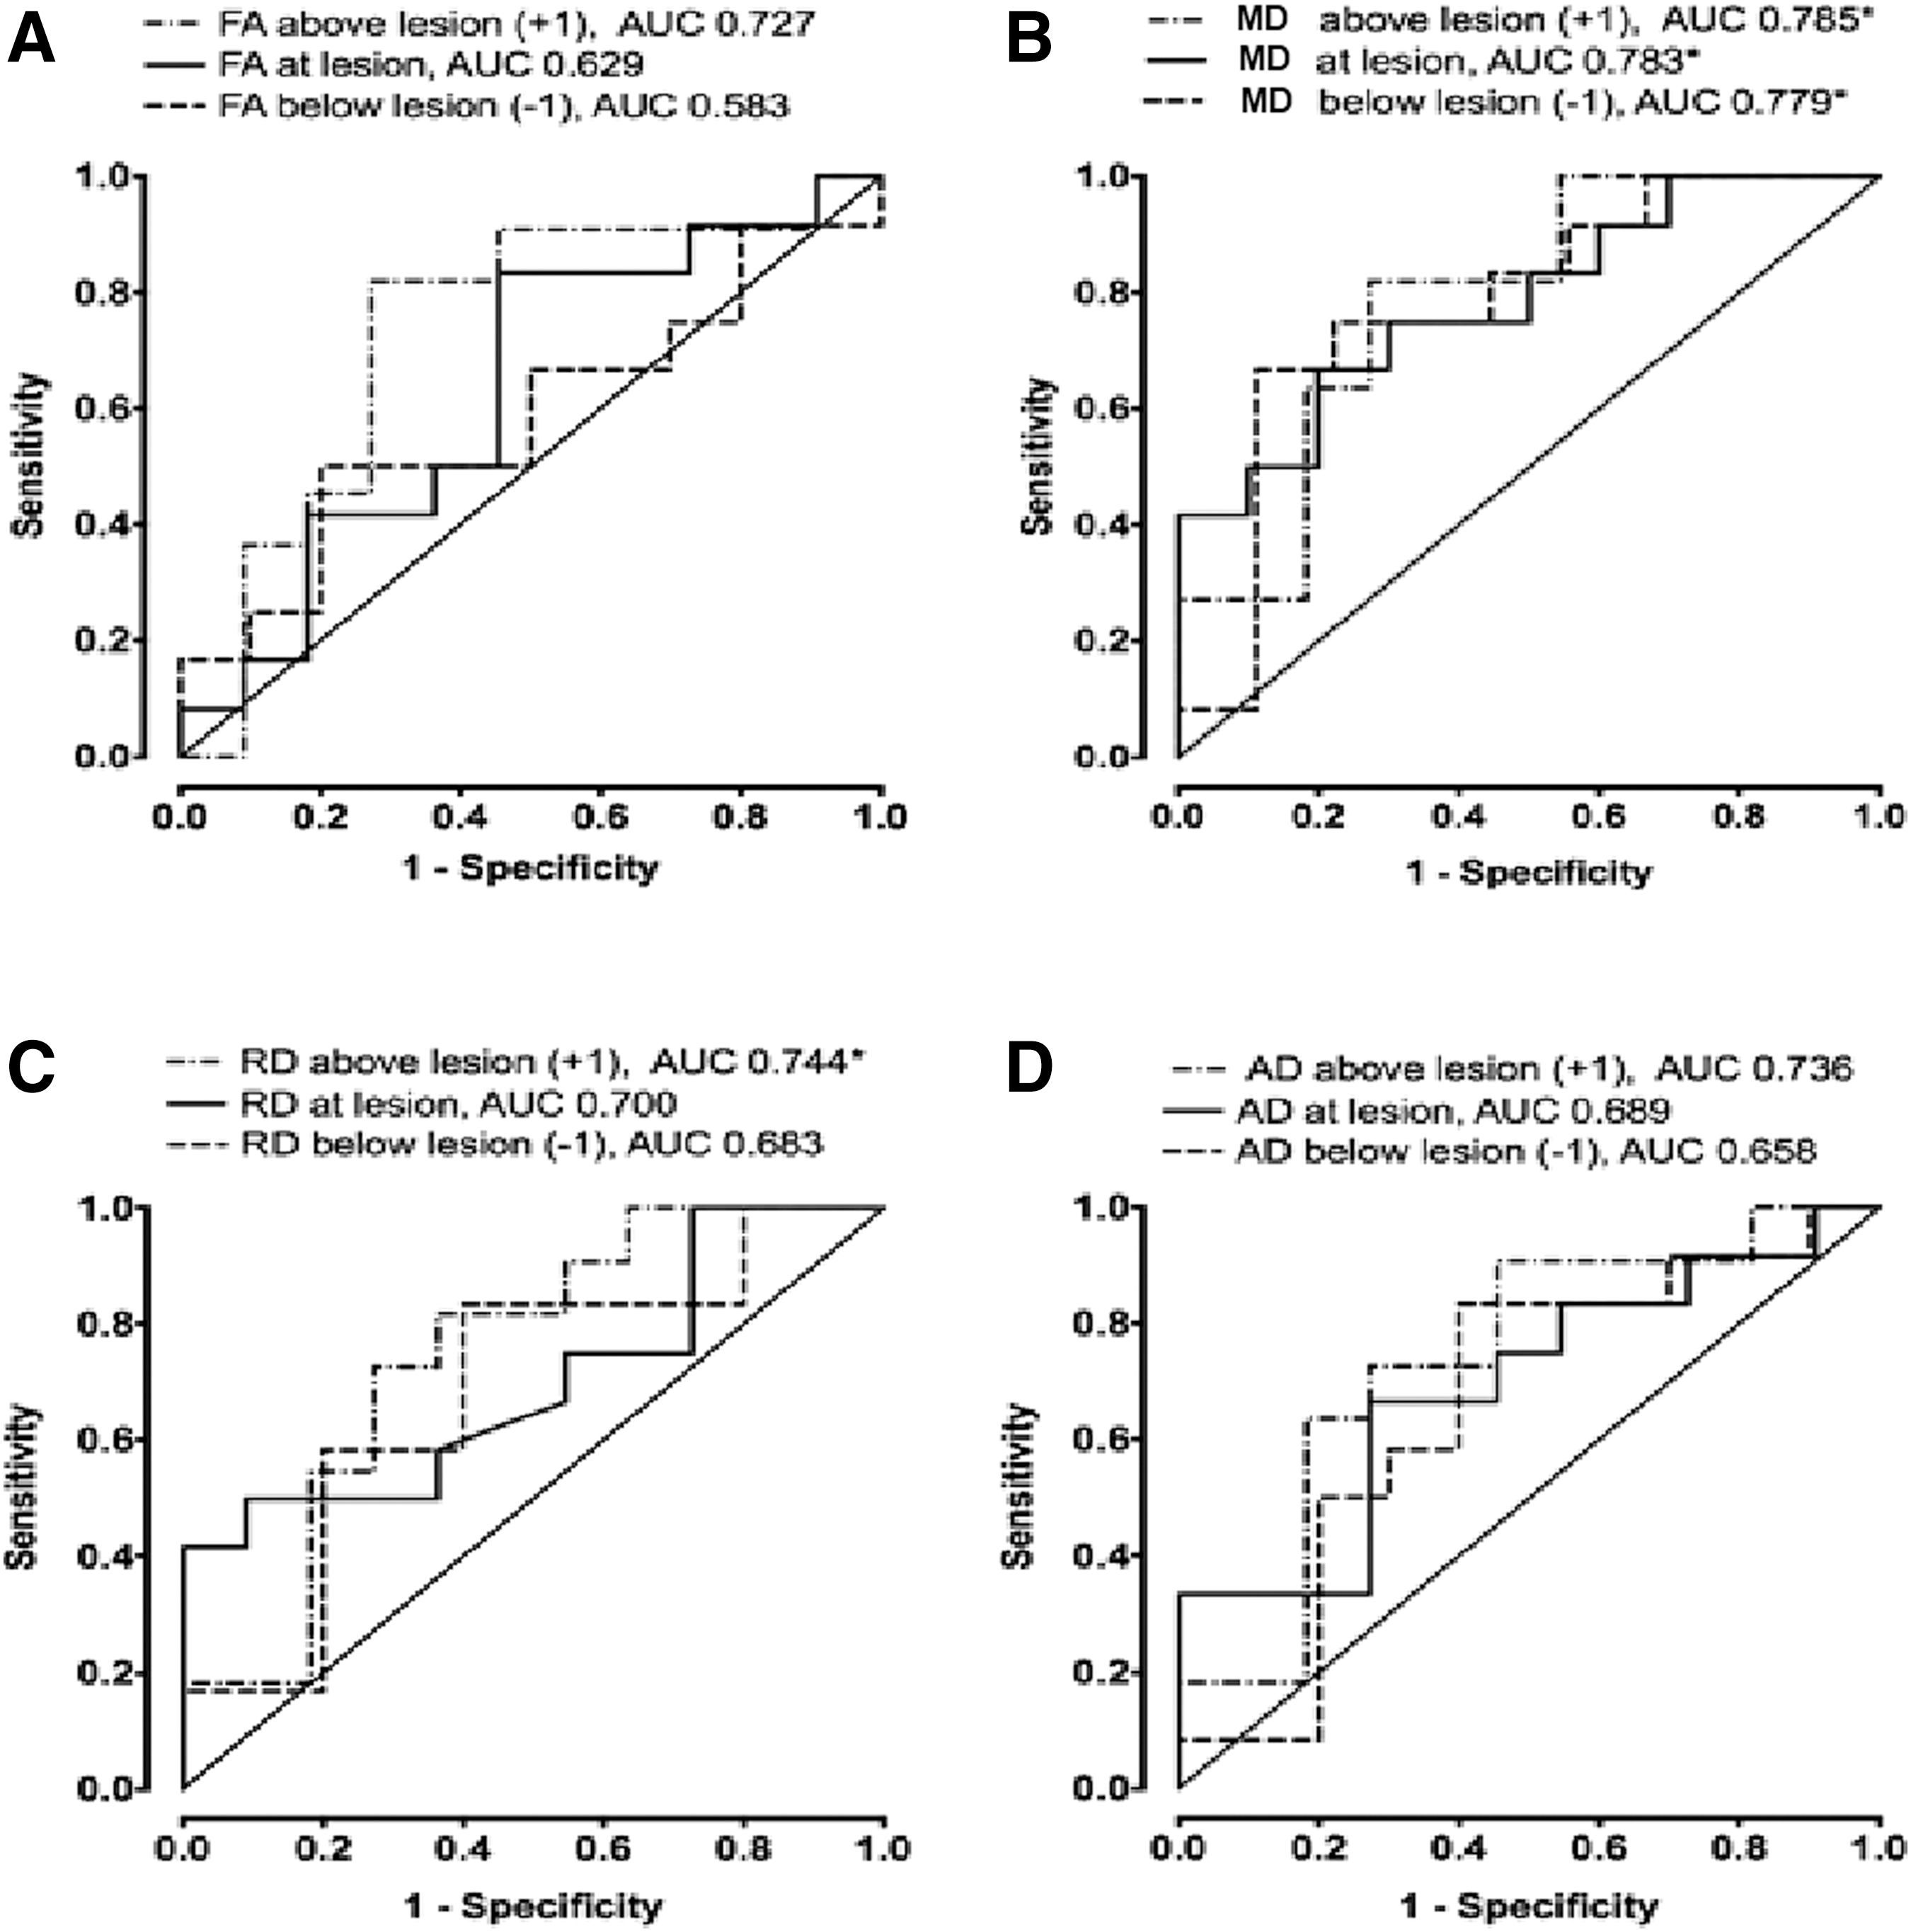
DTI parameters predicting long-term neurology recovery. ROC curves of DTI parameters are created to test accuracy and discriminatory power for neurology recovery.
Discussion
The results of this study show that spinal cord DTI measures of decreased FA, and increased MD and RD are related to the severity of SCI and can independently forecast capacity for neurological recovery 6 months after acute SCI. The sensitivity and specificity for prediction of severity of injury were highest for FA and RD, whereas MD offered the best prediction of neurological recovery when measured at one level rostral to the injury epicenter.
Absolute values of DTI parameters are known to vary significantly across the length of the normal cervical spinal cord and differ by the DTI acquisition technique. 8 –10,32 This underscores the importance of strict normalization of absolute DTI values. This study employed a cervical spinal cord DTI data analysis similar to that performed by Uda and colleagues, 25 applied to cervical myelopathy where data from each patient were compared with the distribution of normal subjects utilizing a unitless z-score. 32 –36 Shanmuganathan was the first investigator to apply this methodology to human SCI. 38 Our study extends the value of using the z-score normalization in the human SCI population using several acquisition techniques.
This study is also the first to demonstrate that DTI indices measured immediately rostral to the anatomical level of injury in human SCI consistently show higher correlations (moderate to strong) and accuracy in predicting severity of initial neurological injury and forecasting lower-extremity motor recovery than indices measured at the center of injury. Spearman correlation between cardinal DTI z-scores measured rostral to the SCI lesion center and SCI severity showed moderate to strong correlation in FA (r = −0.51) and RD (r = 0.54) and weak to moderate correlation in MD (r = 0.47) and AD (r = 0.26). Moderate to strong correlation to LE motor recovery was found for MD (r = −0.51) and weak to moderate correlation was demonstrated for FA (r = 0.33), RD (r = −0.47), and AD (r = −0.45). Weak to moderate correlation was found for all DTI z-scores calculated at the SCI lesion epicenter to LEMS (FA: r = −0.48; MD: r = 0.23; RD: r = 0.34; AD: r = 0.02). Similarly, weak to moderate correlation was found for all DTI measured at lesion epicenter and LE motor recovery (FA: r = 0.27; MD: r = −0.44; RD: r = −0.35; AD: r = −0.34). Similar observations were reported in animal models of SCI where weakest correlations were observed between DTI parameters and measures of recovery obtained at lesion center, whereas the highest correlations were observed caudal to the epicenter. 33 –35
The exact mechanism for this observed higher correlation with clinical parameters when DTI is measured above the SCI epicenter remains unclear; however, both technical and physiological factors may be responsible. The fidelity of DTI data at the epicenter may be compromised by difficulty in establishing reliable ROIs in a compressed cord where there may be significant anatomical distortion or hemorrhage that can substantially degrade the quality of the DTI measurements. In that respect, perilesional DTI values may relate to axonal health, one that better correlates with neurological functional outcomes.
Studies using conventional MRI have shown a clear relationship between the longitudinal and cross-sectional extent of spinal cord hemorrhage and edema to neurological deficit at admission and functional recovery 1 year after injury. 2 –4 Although there is a wealth of experimental literature on the application of DTI in SCI, 33 –35 there are far fewer clinical SCI MRI DTI studies that address DTI's capability to predict neurological recovery. 36,38 Tsuchiya and associates found no relationship between initial MD values and recovery parameters in 14 SCI patients. 36 Cheran and colleagues 37 were the first investigators to report a strong relationship between RD, LD, FA, and MD to 1-year total motor index scores (MIS) in 25 patients. 36 In a smaller study with 16 patients, Shanmuganathan and co-workers demonstrated a strong correlation between measures of AD and SCIM III scores assessed at 1-year after injury. 38 Hemorrhagic injury and alteration in AD values offered the best predictive model of 1-year neurological status. 38
Our study builds upon these prior works by evaluating actual percent neurological recovery (between initial and final clinical status) and more segmental DTI measures that led to the discovery of the inherently stronger correlations of initial motor deficit and motor recovery to rostral DTI indices. Our results suggest that one can more accurately forecast percent neurological recovery with DTI measures measured one level rostral to the anatomical level of injury compared with values obtained at the lesion center.
Although MRI and DTI will likely never replace a high-quality ISNCSCI examination, they do offer three distinct advantages: (1) speed, (2) objectivity, and (3) direct visualization of the end organ (the spinal cord). The results of this study suggest that physiological data derived from baseline DTI may offer supplemental information to forecast spontaneous neurological recovery. As DTI capabilities are now available on clinical MRI platforms, routine use of DTI may prove valuable as another objective measure of spinal cord integrity and provide an indirect means to address capacity for neurological recovery. This is of particular importance in the acute injury period where patient impairment, the presence of other clinical comorbidities, and lack of skilled evaluators often decrease the reliability of the initial neurological assessment. 39 The variability of the initial clinical assessment has profound implications in proving efficacy of novel therapies where it is currently estimated that the number of patients required to prove clinical value of a new drug is prohibitive. 29 Identification of a reproducible objective physiological metric could provide a supplemental objective means to gauge severity of injury in the uncooperative patient.
Principle limitations of this study were related to recruitment and retention of patients over the full clinical evaluation period of 6 months. Insufficient patients in each cervical injury (AIS impairment and neurological level) category precluded performing a similar assessment of neurological impairment and recovery for the upper extremities. Logistically, as there now is improved access to quality rehabilitation in local communities, long-term retention of patients at the acute tertiary care center where they initially were assessed and treated has become more challenging for many SCI centers. The smaller sample size prevented more granular stratification of patients by injury and recovery.
Past studies have revealed age-related changes in diffusion tensor metrics as a result of natural degeneration of the central nervous system (CNS), primarily demyelination and axonal loss. 40 –42 We did not attempt to correct for age- or gender-related differences due to sample size limitations. With a larger overall sample size these differences could be addressed through the normalization process. These steps would be necessary for any multi-institutional cohorts.
Although the cervical spinal cord is relatively straight, natural curvature exists and could be substantial in some subjects. All the axial DTI data sets in this study were acquired in one single slab. To minimize partial volume effects due to spinal cord curvature, care was taken to prescribe the slab as close to perpendicular to the long axis of the spinal cord. An alternative method to mitigate curvature effects is to acquire data in multiple axial oblique slabs that parallel each disc level. This methodology unfortunately adds substantially to setup and acquisition time, which can be challenging in an acutely injured population. This limitation could be overcome in the future by imaging the spinal cord using parallel or multi-band DTI techniques, which will allow faster imaging.
One potential limitation to this study could be inter-sequence variability raised by ZOOM-EPI and full-field EPI. Inter-sequence variability has been defined as the variability between diffusion metrics obtained from different pulse sequences run on the same imaging unit. At the time of the initial proposal, only the full FOV EPI technique was FDA approved. Subsequently, midway through patient recruitment the reduced FOV (ZOOM) technique became FDA approved. Although the ZOOM methodology provided better quality data, testing showed that the values derived were not identical to full FOV methods used previously. The z-score methodology was tested and validated as a method to normalize the two techniques against controls, so that we could take advantage of the better technique and still have a comparable methodology to combine both methods. Normalization of SCI patient DTI data acquired by ZOOM-EPI or full-field EPI to the control groups acquired with the similar sequences minimized this variability.
Our preliminary results are very encouraging and support the feasibility of performing multi-institutional SCI DTI studies using a variety of imaging devices and pulse sequences. Normalization processes such as the z-score technique help to mitigate the significant differences in absolute DTI values inherent to factors related to imaging equipment, vendor, and physiological differences related to age and gender. With a larger sample size, the analysis can be performed as a function of these covariates to minimize DTI inter-subject and scanner variabilities. Despite these inherent variabilities we were able to support the conclusion that DTI has potential to be used as a prognostic marker to forecast neurological injury and recovery after cervical SCI.
Conclusion
In summary, clinically relevant changes in cardinal DTI metrics were measured at an anatomical level immediately rostral to the anatomical level of SCI rather than at lesion center that were predictive not only of initial motor impairment in the lower extremities, but also of motor recovery at 6 months. DTI indices are useful in discriminating severity of initial SCI and those who have potential for spontaneous recovery. Measures made immediately rostral to the anatomical level of injury consistently showed moderate to strong correlations and accuracy in predicting neurological injury and recovery. Z-score normalization methodologies may be useful for multi-center clinical trials. Future work should focus on a multi-variate model to determine if the combination of clinical, anatomical MRI, and DTI metrics more accurately predicts the capacity for spontaneous neural recovery after SCI.
Footnotes
Acknowledgments
This study was supported by Department of Defense grant #W81XWH-10-1-0935.
Author Disclosure Statement
No competing financial interests exist.