
Abstract
Neurological disorders usually present very heterogeneous recovery patterns. Nonetheless, accurate prediction of future clinical end-points and robust definition of homogeneous cohorts are necessary for scientific investigation and targeted care. For this, unbiased recursive partitioning with conditional inference trees (URP-CTREE) have received increasing attention in medical research, especially, but not limited to traumatic spinal cord injuries (SCIs). URP-CTREE was introduced to SCI as a clinical guidance tool to explore and define homogeneous outcome groups by clinical means, while providing high accuracy in predicting future clinical outcomes. The validity and predictive value of URP-CTREE to provide improvements compared with other more common approaches applied by clinicians has recently come under critical scrutiny. Therefore, a comprehensive simulation study based on traumatic, cervical complete spinal cord injuries provides a framework to investigate and quantify the issues raised. First, we assessed the replicability and robustness of URP-CTREE to identify homogeneous subgroups. Second, we implemented a prediction performance comparison of URP-CTREE with traditional statistical techniques, such as linear or logistic regression, and a novel machine learning method. URP-CTREE's ability to identify homogeneous subgroups proved to be replicable and robust. In terms of prediction, URP-CTREE yielded a high prognostic performance comparable to a machine learning algorithm. The simulation study provides strong evidence for the robustness of URP-CTREE, which is achieved without compromising prediction accuracy. The slightly lower prediction performance is offset by URP-CTREE's straightforward interpretation and application in clinical settings based on simple, data-driven decision rules.
Introduction
Traumatic spinal cord injury (SCI) occurs when an external physical impact damages the spinal cord and leads to permanent neurological dysfunction and disability. 1 To date, no treatment is available to repair the damaged spinal cord. Hence, patients who suffered SCI must rely on rehabilitation programs that advance and support the spontaneous neurological recovery. 2 Nonetheless, a series of pre-clinical trials recently delivered promising results to translating scientific discoveries from the laboratory to human application. 3 However, the translation from “bench to bedside” 3 for SCI involves a series of major challenges. 4 –8 The two most prominently discussed challenges refer to the definition of study designs with respect to trial inclusion criteria and stratification of the heterogeneous SCI population, and the selection of possibly cohort-specific clinical outcomes to assess the efficacy of a given intervention. 5 These two challenges are greatly interconnected.
For multiple reasons, in early clinical trials (phase I and II), the enrollment in SCI may target a rather broad range of participants that eventually could profit from an intervention to ensure that a possible treatment effect can actually be detected. However, to minimize ceiling effects, it is favorable to exclude “individuals unlikely to benefit from the intervention, i.e. those likely to achieve full recovery without treatment.” 6 At the same time, potential flooring effects should be addressed by excluding patients “where [a] treatment is unlikely to produce meaningful improvement in outcome.” 6
To address these issues, Tanadini and colleagues 9 proposed for the first time in SCI the use of the unbiased recursive partitioning technique called conditional inference trees (URP-CTREE) as a means to achieve a prediction-based stratification algorithm depending on baseline characteristics of the trial participants population, thus informing trial planners about which cohorts may be included or excluded for minimizing potential flooring and ceiling effects. In addition, the algorithm supports the ability to define cohort-specific trial end-points. Therefore, enrollment of individuals with different levels and severities of SCI into a single trial is greatly promoted. 6,10 Due to the ability to identify more homogeneous subgroups and predict recovery patterns, similar approaches have been successfully applied in multiple clinical fields and have experienced many applications both within the research field of SCI, as well as non-SCI medical research. 7,9 –19
Nonetheless, the extent to which URP-CTREE provides improvements compared with other approaches more familiar to clinicians has recently come under critical scrutiny. 9,17 For example, Evaniew and colleagues 17 performed an external validation of the previously published URP-CTREE model. 9 They applied the partition rules provided by the URP-CTREE of Tanadini and colleagues 9 to an independent data set and concluded “limited ability to stratify an independent data set into homogeneous subgroups.” While the overall accuracy for the independent data set was promising, it seemed sensitive to timing of baseline neurological examinations.
The goal of this study is to provide a simulation framework to investigate and quantify the issues raised with regard to 1) the replicability and robustness of URP-CTREE to identify homogeneous subgroups, and 2) its prediction performance.
Methods
The herein-provided simulation framework to assess replicability and robustness of the URP-CTREE algorithm is based on two different data sources, which are introduced in the “Data sources” section. Further, the methods used for the simulation study and the prediction performance comparison are discussed in the subsequent sections.
Data sources
The analyses in Tanadini and colleagues 9 were based on data extracted from the European Multicenter Study about Spinal Cord Injury (EMSCI), while Evaniew and colleagues 17 relied on the Rick Hansen Spinal Cord Injury Registry (RHSCIR). Both entities are internationally recognized, prospective, multi-site observational data collection efforts aiming at improving the understanding of care after SCI and follow the International Standard for Neurological Classification of Spinal Cord Injury (ISNCSCI) neurological assessment. 20 The Upper Extremity Motor Score (UEMS) represents a subset of the ISNCSCI. The UEMS consists of the sum of the tested strength of 10 key muscles of the upper extremity (five on each side of the body). Each key muscle is rated on a scale between 0 (no detectable contraction) and 5 (full range, active movement against resistance), and Total UEMS sum score ranges between 0 and 50. The UEMS and its distribution at final follow-up for each of the patient subgroups described by Tanadini and colleagues is compared as metric of external validation by Evaniew and colleagues. This clinical end-point was originally chosen because it relates to changes in upper extremity function and has been suggested as a potential end-point in clinical trials. 5,21 –25
European Multicenter Study about Spinal Cord Injury (EMSCI)
The European Multicenter Study about Spinal Cord Injury (EMSCI;
Rick Hansen Spinal Cord Injury Registry
RHSCIR is a Canadian multi-center prospective, observational registry of adults with traumatic SCI who received care at one of the 18 acute and 13 rehabilitation RHSCIR sites. 7 For consented patients who contribute to the RHSCIR, data elements are collected during the pre-hospital, acute and in-patient rehabilitation phases of their care including socio-demographic factors, medical history, injury details, diagnoses, interventions, neurologic impairment, complications and patient-reported outcomes. 26 In contrast to the five pre-defined assessment time frames for EMSCI up to 48 weeks after SCI, RHSCIR continues collecting data about healthcare system utilization after SCI at 1, 2, 5, 10, 15, 20, … years after the date of injury. 20 Interested researchers may apply for access to and usage of the RHSCIR data by indicating their interest to the Data Access Committee.
Unbiased recursive partitioning based on conditional inference tree
URP-CTREE is a tree-based regression model that implements a data-driven approach to identify homogeneous subgroups. 27,28 Following Wolfson and Venkatasubramaniam 16 and Tanadini and colleagues, 9 the algorithm underlying URP-CTREE performs two major steps, which are repeated iteratively until an a priori–specified stopping criteria is fulfilled. At the beginning, all observations in the data set at hand are considered and are contained in the root node of the tree. Step 1 of the algorithm tests which predictor (baseline characteristic) has the strongest association with the clinical end-point (outcome) of interest. Thus, for each individual predictor, a statistical association test is performed, whereas the resulting p values are corrected for multiple-testing. If the null hypothesis of total independence between the predictor variables and the clinical end-point cannot be rejected, the algorithm stops without implementing any split in the observations in a given node. In such cases, one can state that there is no statistically significant association between any potential predictor and the clinical end-point of interest. For cases where the association test with null hypothesis of total independence can be rejected, the algorithm then selects the predictor with the strongest statistical association (meaning the smallest p value after the multiple testing correction) and continues with Step 2.
Step 2 represents the actual splitting step and is based on a two-sample linear statistic which evaluates all possible dichotomous splits on the previously selected predictor. This procedure maximizes the discrepancy of the two resulting subgroups (i.e., the two resulting subgroups are as distinct as possible). The iteration of Step 1 and Step 2 is recursively applied until no more statistically significant predictors are associated with the clinical outcome of interest or a stopping rule is triggered. At every iteration where Step 2 is implemented, a tree node (a group of observations) is split into two new nodes (two distinct subgroups of observations) that are as different as possible. An example for a stopping rule might be the requirement for a minimum number of observations (patients) in a terminal node.
In the context of SCI research, the URP-CTREE algorithm is used to determine which early clinical assessments (e.g., American Spinal Cord Injury Association Impairment Scale, Spinal Cord Independence Measure, UEMS) significantly contribute to the clinical end-point according to the study protocol. Depending on the early (baseline) observations, the trial participants are then stratified (split) into homogeneous groups.
A more detailed introduction to URP-CTREE algorithm can be found elsewhere. 27 -29 URP-CTREE has been tested in both cervical complete and incomplete SCI models as a means to be “inclusive” in trial recruitment. 5,9,10
EMSCI-based URP-CTREE with end-point Total UEMS at 6 months after the cervical sensorimotor complete spinal cord injury
Tanadini and colleagues 9 performed a retrospective, longitudinal analysis of prospectively collected neurological data from the EMSCI network on C4–C6 cervical sensorimotor complete subjects. Predictors were based on a broad set of early (< 2 weeks) clinical assessments, and the end-point was the 6-month clinical examination of Total UEMS. The stated aim of the research article was to compare the accuracy of URP-CTREE with established regression models to predict future clinical end-points from early neurological assessments, and to investigate the contribution of these methods to the stratification of subjects into homogeneous subgroups.
Figure 1 visualizes the URP-CTREE estimated by the EMSCI data set and computed with the ctree() function from add-on package party. 30 Note that it is the exact same as Figure 2 in Tanadini and colleagues' article. 9 We can therefore conclude that the publication by Tanadini and colleagues 9 is reproducible since running the same software on the same input data obtains the same results. 31
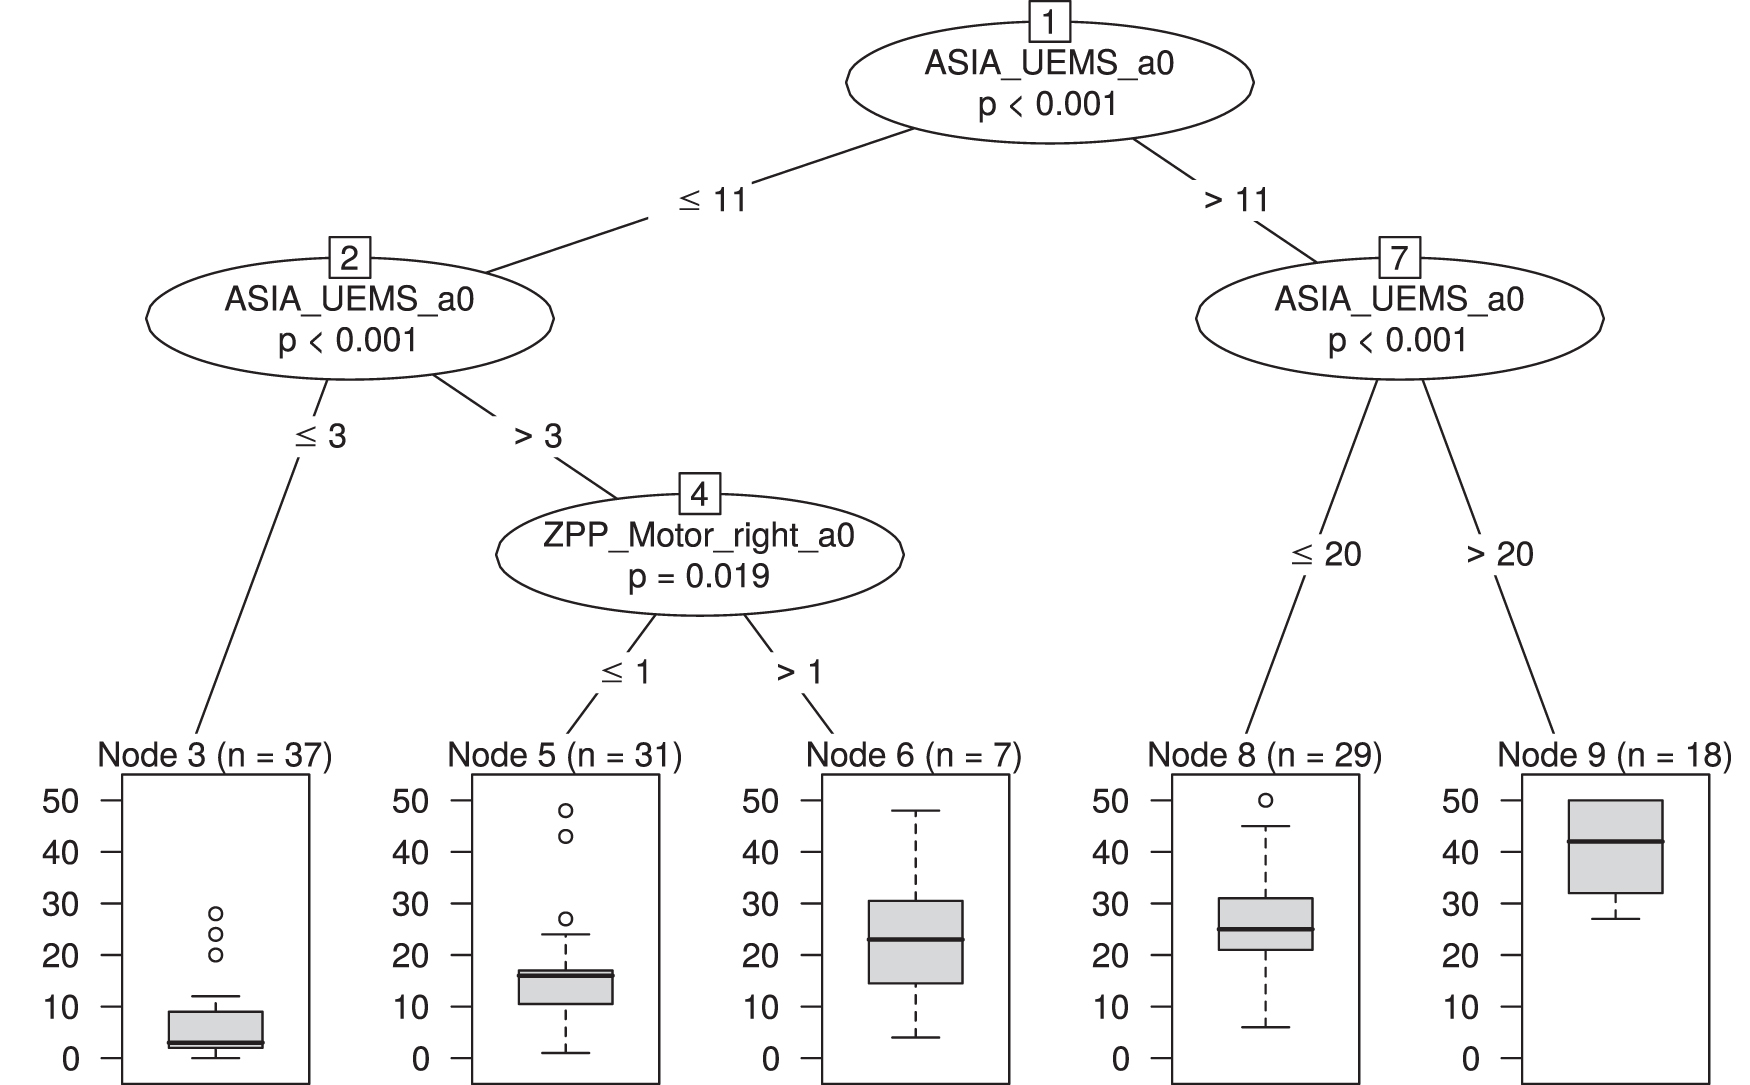
Resulting unbiased recursive partitioning with conditional inference tree (URP-CTREE) for the end-point Total Upper Extremity Motor Score (UEMS) at 6 months after the cervical sensorimotor complete SCI (N = 122, European Multicenter Study about Spinal Cord Injury [EMSCI] data set).
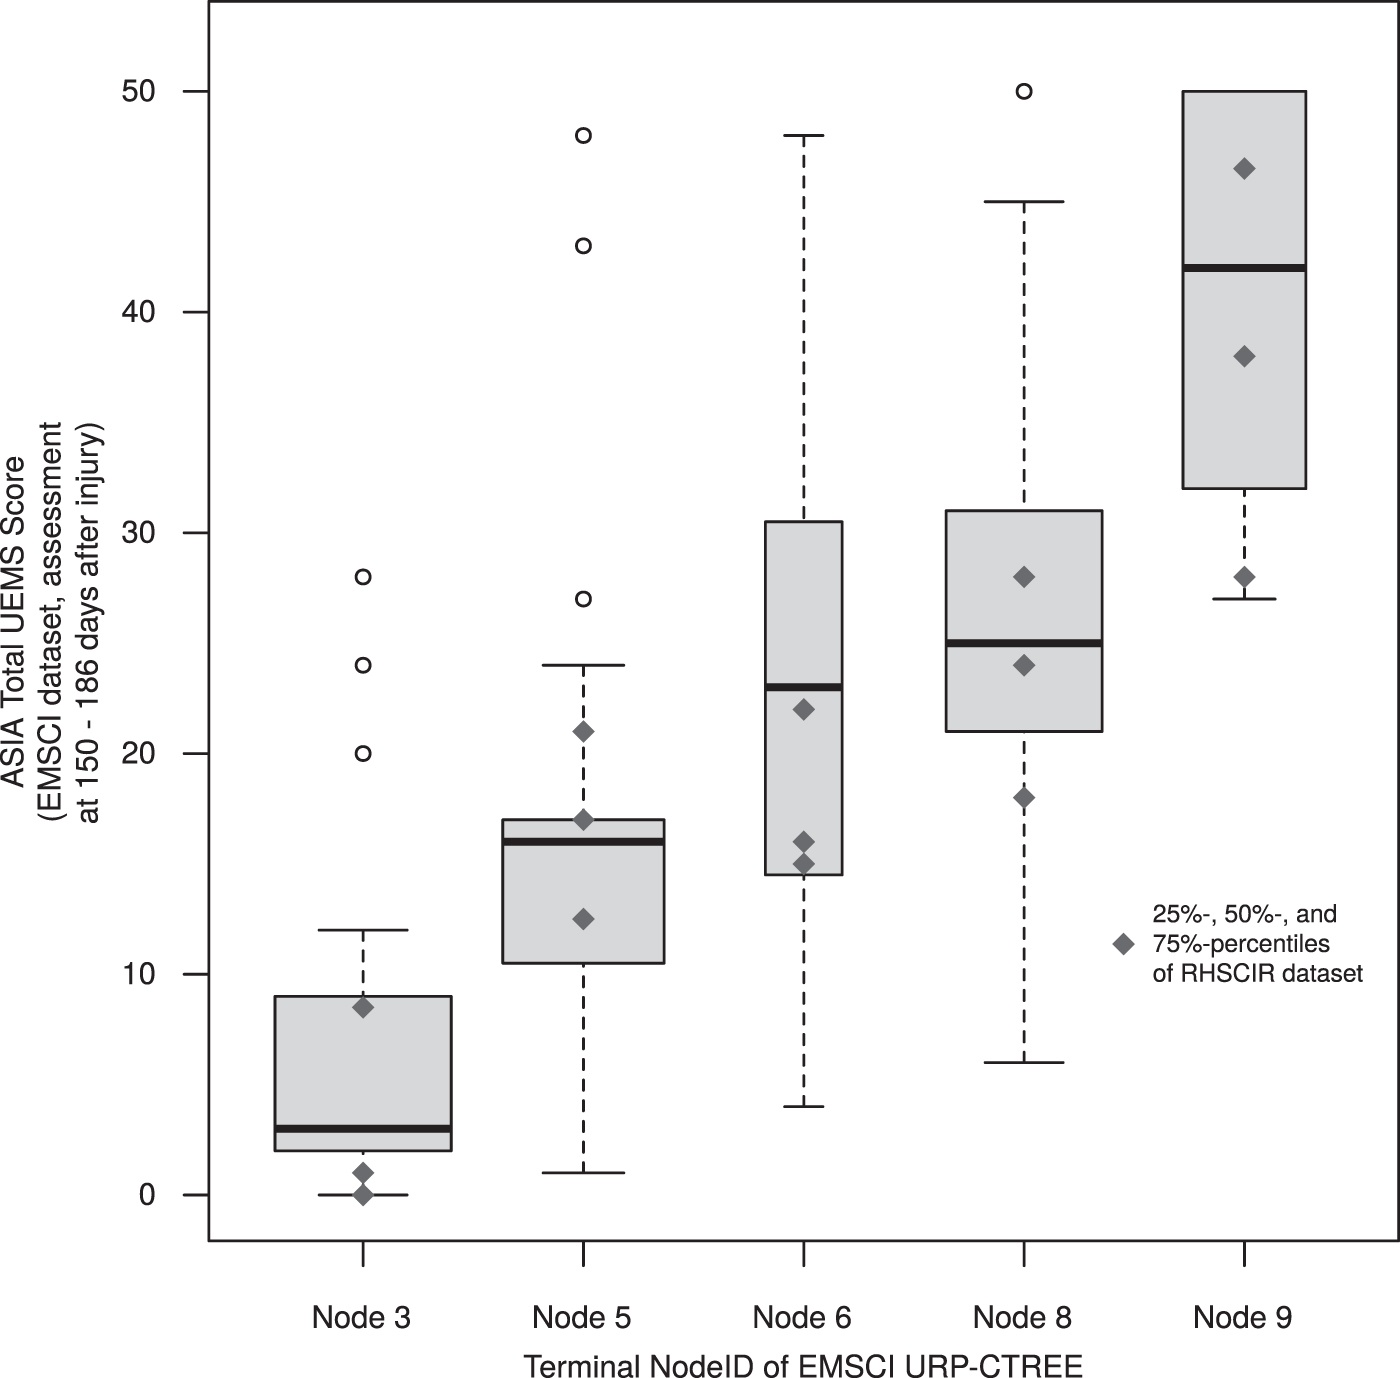
Total Upper Extremity Motor Score (UEMS) score distributions at 6 months after spinal cord injury stratified by the terminal nodes resulting from the unbiased recursive partitioning with conditional inference trees (URP-CTREE; Fig. 1) by Tanadini and colleagues. 9 The underlying data points are from the European Multicenter Study about Spinal Cord Injury (EMSCI) data set (N = 122), and the width of the boxplots is proportional to the sample size of the terminal nodes in Figure 1. The blue rhombi represent the 25%, 50%, and 75% percentiles of the Total UEMS score distributions at final follow-up of the Rick Hansen Spinal Cord Injury Registry (RHSCIR) data set retrieved from Evaniew and colleagues. 17
Besides the identification of homogeneous subgroups, such an estimated URP-CTREE results in an interpretable prediction rule for the future expected clinical outcome dependent on the provided baseline variables used for the partitioning. In other words, the algorithm predicts future outcomes within more homogeneous subgroups based on sequential splits of early predictors. The homogeneous subgroups are represented by the final nodes (nodes 3, 5, 6, 8, 9) in Figure 1. Although the distribution of the end-point Total UEMS within the final nodes might be similar (e.g., for nodes 6 and 8), the subgroups differ with respect to their underlying conditions such as the early predictors. Additionally, the tree provides a straightforward visual explanation of potentially non-linear relationships or higher-order interaction effects among the explanatory variables.
Applying the EMSCI-based URP-CTREE decision rules to RHSCIR
Evaniew and colleagues applied the URP-CTREE based partition rules reported in Tanadini and colleagues to their RHSCIR sample. In other words, Evaniew and colleagues used the predictors and splits derived from EMSCI as if they were being used to stratify enrollment of RHSCIR patients to a clinical trial.
Total UEMS score distributions at 6 months after SCI stratified by the terminal nodes resulting from the URP-CTREE (Fig. 1) by Tanadini and colleagues. 9 The underlying data points are from the EMSCI data set (N = 122) and the width of the boxplots is proportional to the sample size of the terminal nodes in Figure 1. The blue rhombi represent the 25%, 50%, and 75% percentiles of the Total UEMS score distributions at final follow-up of the RHSCIR data set retrieved from Evaniew and colleagues. 17
Figure 2 visually combines the two data sets RHSCIR (N = 101) and EMSCI (N = 122). 9,17 Figure 2 shows the Total UEMS score distributions at 6 months after SCI stratified by the terminal nodes resulting from EMSCI URP-CTREE (Fig. 1). The underlying data points are from the EMSCI data set and the width of the boxplots is proportional to the sample size of the EMSCI URP-CTREE terminal nodes. The blue rhombi (retrieved from Figure 3A in Evaniew and colleagues' article) added to the boxplots in Figure 2 represent the 25%, 50%, and 75% percentiles of the Total UEMS score distributions at final follow-up of the RHSCIR data set (Table 1).
Total Upper Extremity Motor Score (UEMS) score at final follow-up.
RHSCIR, Rick Hansen Spinal Cord Injury Registry.
We retrieved the needed information for our analysis per terminal node from Figure 2 and Figure 3A of Evaniew and colleagues' article. Table 1 provides an overview of the extracted numbers.
Comparative framework: Putting differences into context
In an attempt to externally validate and assess the ability to accurately identify homogeneous subgroups and predict final UEMS motor recovery of a previously published URP-CTREE model, Evaniew and colleagues applied the partition rules provided by Tanadini and colleagues to an independent data set. 9,17 In the context of reproducible research, the external validation executed by Evaniew and colleagues can be classified as testing the technical reproducibility and replicability of the URP-CTREE suggested by Tanadini and colleagues. 9,17
Technical reproducibility and replicability
In the literature and across different scientific disciplines, one finds some confusion with regard to the distinction between reproducibility and replicability. 32,53 The absence of a standard definition for reproducibility and replicability makes the assessment thereof rather challenging. 53 We here follow the definition of the Turing Way and the recently published report of the U.S. National Academies. 33,53 Reproducibility is defined as the ability to run the same analysis on the same input data and obtain the same results. This contrasts replicable results (i.e., replicability). Research results are replicable when the same analysis performed on a different data set produces qualitatively similar scientific findings. 33,53
Hence, to assess technical reproducibility, we ran the same URP-CTREE analysis with the ctree() function from add-on package part
Replicability: Examining the URP-CTREEs robustness in external validation
While the external validation of the URP-CTREE algorithm conducted by Evaniew and colleagues showed some differences, “it is difficult to say exactly how close to the original URP-CTREE findings the results of [an] external validation study would need to be in order to confirm the robustness [replicability] of the initial prediction.” 17 In other words, while some degree of differences is to be expected, it remains a great challenge to quantify the degree of differences that would undermine external validity and therefore replicability. Indeed, no straightforward answer to this question exists and as Rougier and colleagues argues, it can only be judged by an expert in the field what exactly “similar enough” and “qualitatively similar answers” in terms of replicability mean. 31,33
We therefore propose a framework where the results obtained in a different data set are evaluated against the matrix of expected deviations that are likely to be observed if the original URP-CTREE findings were applied to independently simulated replications of the EMSCI data set. This will allow biomedical researchers to quantify the amount of deviation from the original URP-CTREE that is inherent to the natural variability in the clinical setting under consideration, and therefore provide a benchmark expectation of “similar enough” to judge the deviations reported in Evaniew and colleagues. 17
For this, we assumed that the distribution of Total UEMS score at final follow-up in every replication study is exactly the very same as the distribution of Total UEMS score at final follow-up as in the URP-CTREE model depicted in Figure 1, and thus as in the EMSCI data set.
For each replication study generated following this criterion, we were then able to compare the differences between the distributions of Total UEMS score at final follow-up in the five subgroups corresponding to the terminal nodes of URP-CTREE in Figure 1. This provides a reasonable understanding of the distributional differences which can be expected under this idealized model that can then be compared with the differences observed by Evaniew and colleagues. 17
The technical steps implementing the above outlined parametric bootstrapping were: The URP-CTREE estimates the empirical cumulative distribution functions separately for each terminal node (in Fig. 1 depicted on the quartile scale as boxplots). This represents a nonparametric estimation of the distribution of Total UEMS score at final follow-up. We replaced the nonparametric estimates of Step 1 with a parametric model for ordinal outcomes stratified by terminal node.
For this, our starting point was the most popular regression model for ordinal outcome variables: the proportional odds logistic regression (Polr) model.
34
-36
This model features one intercept parameter for each possible outcome category. In case of the Total UEMS score at 6 months after the date of injury (here: YUEMS
6
), this model requires 50 intercept parameters. The unconditional probability of Total UEMS score k at final follow-up would then be specified as:
Hence, fitting an individual Polr model to each terminal node reveals limitations, since the number of intercepts exceeds the number of observations within the terminal nodes. To overcome this challenge, the Continuous Outcome Logistic Regression (Colr) model, also known as enhanced Proportional Odds Logistic Regression (ePolr) model has been introduced. 8,37 The Colr model estimates a smooth and parsimonious function h(), instead of estimating one intercept parameter αk to each possible outcome category:
The smooth parametrization of h makes the Colr model especially attractive for ordinal responses with a considerably high number of possible outcome categories (e.g., the Total UEMS score). Further, fitting a Colr model allows us to not only estimate the odds of being less than or equal a particular category k = 0, 1, 2, …, 49 but results in a fully parametric model. We estimated such a Colr model stratified by the terminal nodes of the URP-CTREE (Fig. 1) using the n = 122 patient observations of the EMSCI data set:
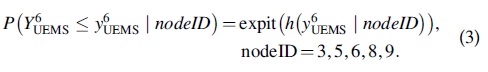
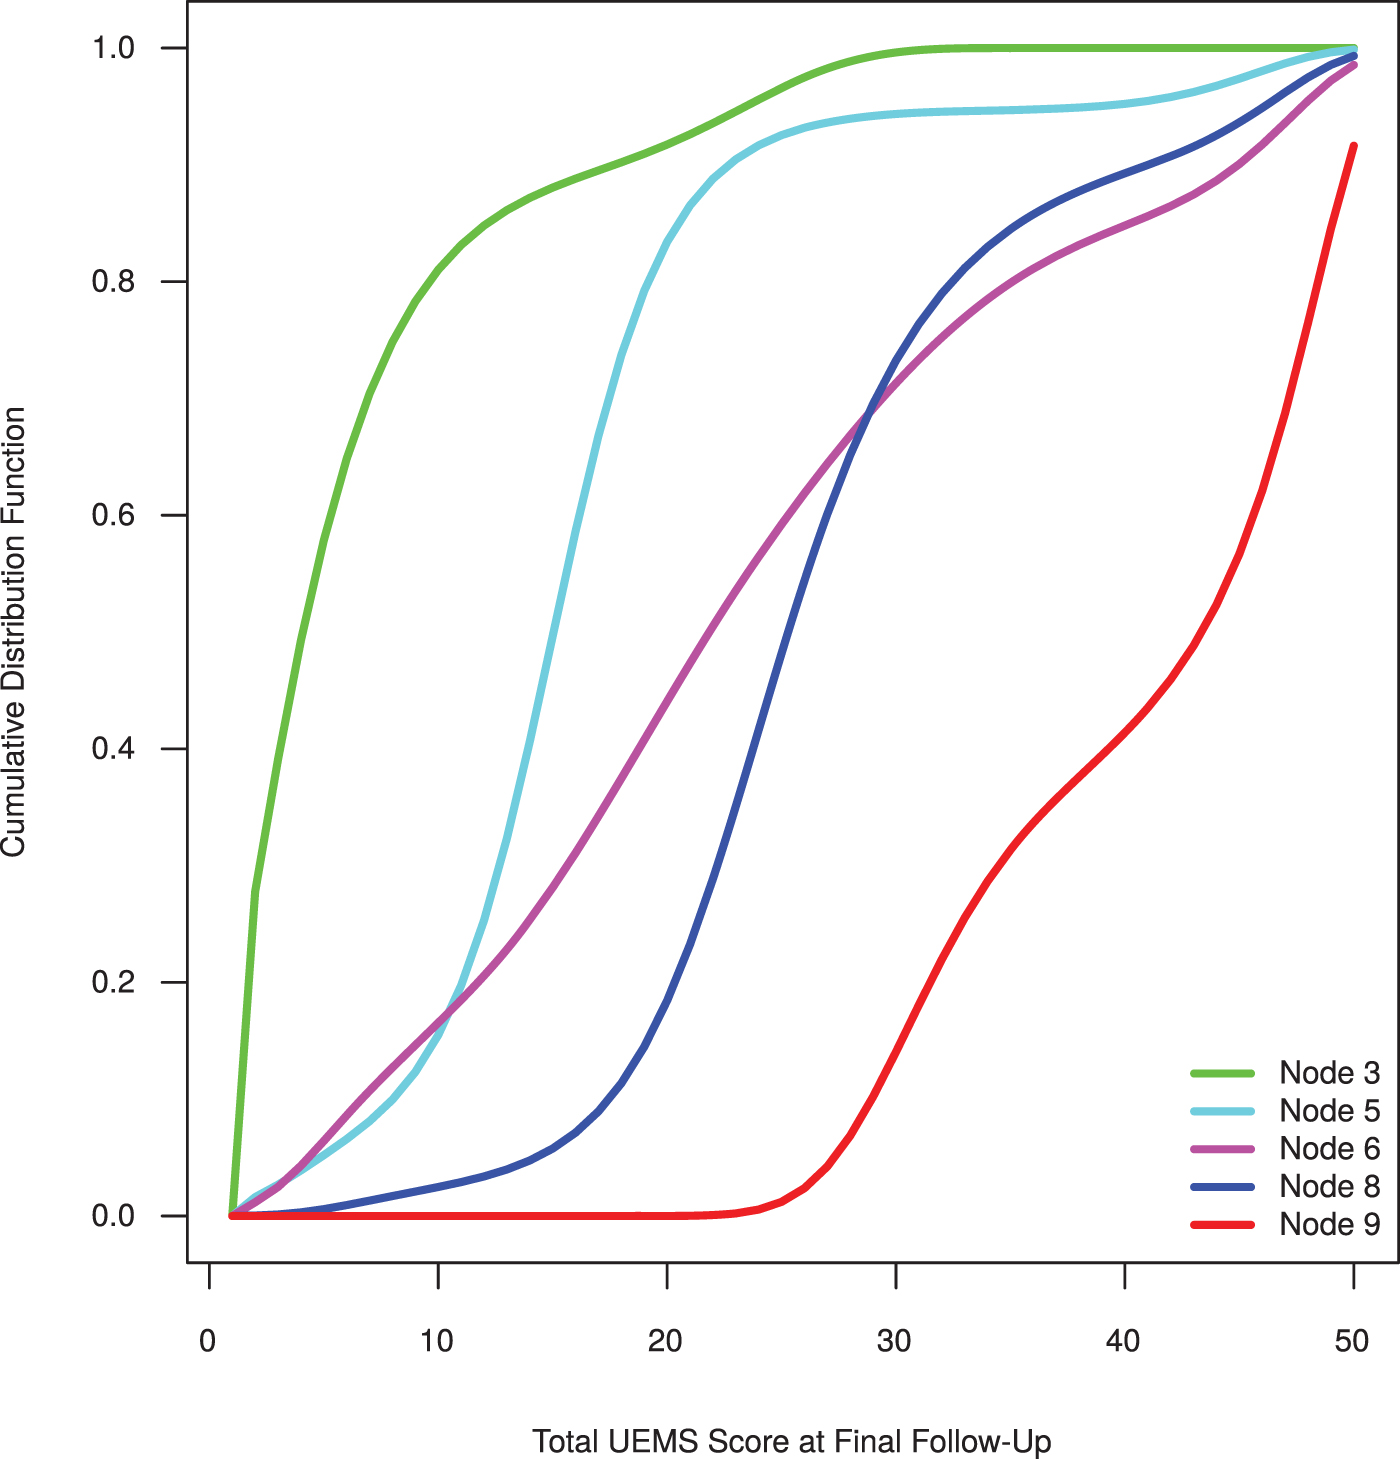
Figure 3 shows the node specific cumulative distribution functions estimated by the stratified Colr model defined in Equation (3). We hereafter refer to this model as base model. Note that the identified homogeneous subgroups represented by the terminal nodes 3, 5, 6, 8, and 9 of the EMSCI URP-CTREE (Fig. 1) are well distinguishable by their terminal node specific cumulative distribution function.
Estimated cumulative distribution functions of the Continuous Outcome Logistic Regression (Colr) model stratified by terminal node (subgroup). The EMSCI data set (N = 122) was used to estimate the model.
While terminal nodes 6 and 8 might have been less distinct on the quartile scale (shown in the boxplots of Fig. 1), they are clearly distinctive by the terminal node specific cumulative distribution function (Fig. 3). This can be ascribed to different baseline characteristics identified among the observations nonetheless resulting in similar Total UEMS scores at follow-up in terminal node 6 and 8.
It is important to note that samples from each of the five subgroup-specific distributions depicted in Figure 3 can be generated by the parametric bootstrap through the inversion method: Uniform random variables were generated first and the distribution functions were then inverted numerically to obtain artificial Total UEMS score at final follow-up values following the same node specific distribution. The theoretical and computational details for the underlying statistical framework are explained in detail elsewhere. 38
We then simulated new outcomes of Total UEMS score at final follow-up according to the distributions defined in Step 2 to imitate additional replication studies.
The base model 3 is estimated with the EMSCI data set, because we did not have access to patient-level data of the RHSCIR database. Evaniew and colleagues used similar inclusion criteria as Tanadini and colleagues for their analysis resulting in a total RHSCIR sample size of 101 patients. 9,17 For the proceeding simulation, we therefore considered a total sample size of N = 101 as well as the exact terminal node sizes of the RHSCIR URP-CTREE (Table 1) to ensure an adequate comparison between the EMSCI and the RHSCIR analyses. Hence, we sampled n = 101 EMSCI participants with replacement for each of the 10,000 hypothetical repetitions of the prospective observational study while defining the terminal node sizes of the RHSCIR URP-CTREE as probability weights. Subsequently, we draw parametric bootstrap samples from the base model for each of the 10,000 sampled data sets conditional on the terminal nodes.
Prediction accuracy
The identification of prognostic factors and hence prediction models have long been difficult yet of high interest in SCI research and specifically for SCI rehabilitation. 39 –43 An accurate prediction model facilitates effective rehabilitation, improves medical plans and enhances the collaboration with patients and their relatives. 44
The URP-CTREE algorithm results in prediction-based decision rules for inclusion and stratification. 10 Hence, having accurate valid end-point predictions for future participants is an important requirement for SCI clinical research. Nevertheless, possible shortcomings of URP-CTREE have been thematized with regard to both the amount of accuracy gained as compared with commonly known regression models, and the amount of accuracy loss as compared with advanced machine learning algorithms. 17 To conclude, predictions based on single trees might be sensitive to small changes to the learning sample and thus Garge and colleagues suggest to base predictions on multiple tree models. 45 Such an ensemble learning method based on the aggregation of multiple single trees is defined as random forest. 46 A model-based random forest algorithm specifically tailored to ordinal outcomes has recently been introduced. 47 To assess these potential shortcomings of a single URP-CTREE, we implemented a benchmark study, for which we used the ordinal forests of Buri and Hothorn 47 as advanced machine learning algorithm together with other commonly used outcome prediction procedures.
We investigated this by implementing a cross-validation study to compare the following four methods: a) unconditional baseline model; b) prognostic regression model with linear predictor; c) prognostic URP-CTREE; and d) prognostic ordinal forest. The four models reflect: a) the absence of any information in the baseline variables about the UEMS at final follow-up; b) a model where a linear function of baseline variables describes the UEMS distribution at final follow-up; c) a tree-structured model relying on homogeneous patient subgroups estimated by URP-CTREE; and d) a machine-learning model where a highly non-linear interaction function of baseline variables describes the distribution of UEMS at final follow-up. Note that we here use a slightly adapted version of the ordinal forest proposed by Buri and Hothorn. 47 The adaption is ascribed to the potentially large amount of response categories of the total sum score UEMS at final follow-up. For this, we enhanced the underlying proportional odds logistic regression model following the argumentation outlined in Buri and colleagues. 8
To evaluate and compare the four different procedures, we first generated 100 random splits of the EMSCI data set dividing it into learning and validation samples in proportion. CHECH ORIG We then trained the four above-introduced models (a through d) with the learning samples before evaluating them with the validation sample. The log-likelihood of the validation sample, the so-called out-of-bag log-likelihood, was used as the overall performance measure to compare the competing methods. This performance measure allows us to compare the prediction accuracy without differentiating between probabilistic (a, b, d) and deterministic (c) predictions. Note that larger values of the out-of-bag log-likelihood reflect a good performance and are hence preferable.
We provide the data and detailed code to reproduce all procedures of this publication elsewhere. 54
Results
Validation of replicability: Comparison of simulated range with external validation data set
We previously introduced a comparative framework to quantify the amount of expected deviation from the original URP-CTREE which are likely to be observed when applying the same partition rules to a potential replication study. This framework was used as benchmark to evaluate the robustness of the initial predictions applied to the independent RHSCIR data set. The URP-CTREE is considered replicable if the independent data set predicts outcomes which are “qualitatively similar” considering the expected deviations of the provided framework. 33 In other words, the proposed procedure defines a benchmark for the expectation of “similar enough” so that one can judge if the originally proposed URP-CTREE is replicable. The judgment is done by comparing the distribution of Total UEMS score at final follow-up from RHSCIR to the artificially generated distributions sampled from the terminal node specific distributions (Fig. 3) imitating additional replication studies. We here compare the estimated and artificially simulated 25%, 50%, and 75% percentiles of the distributions per terminal nodeID (Table 1). For the sake of comparability, we subtracted the respective percentiles reported in Figure 3A in Evaniew and colleagues 17 from each artificially simulated 25%, 50%, and 75% percentile. The resulting differences are shown in Figure 4.
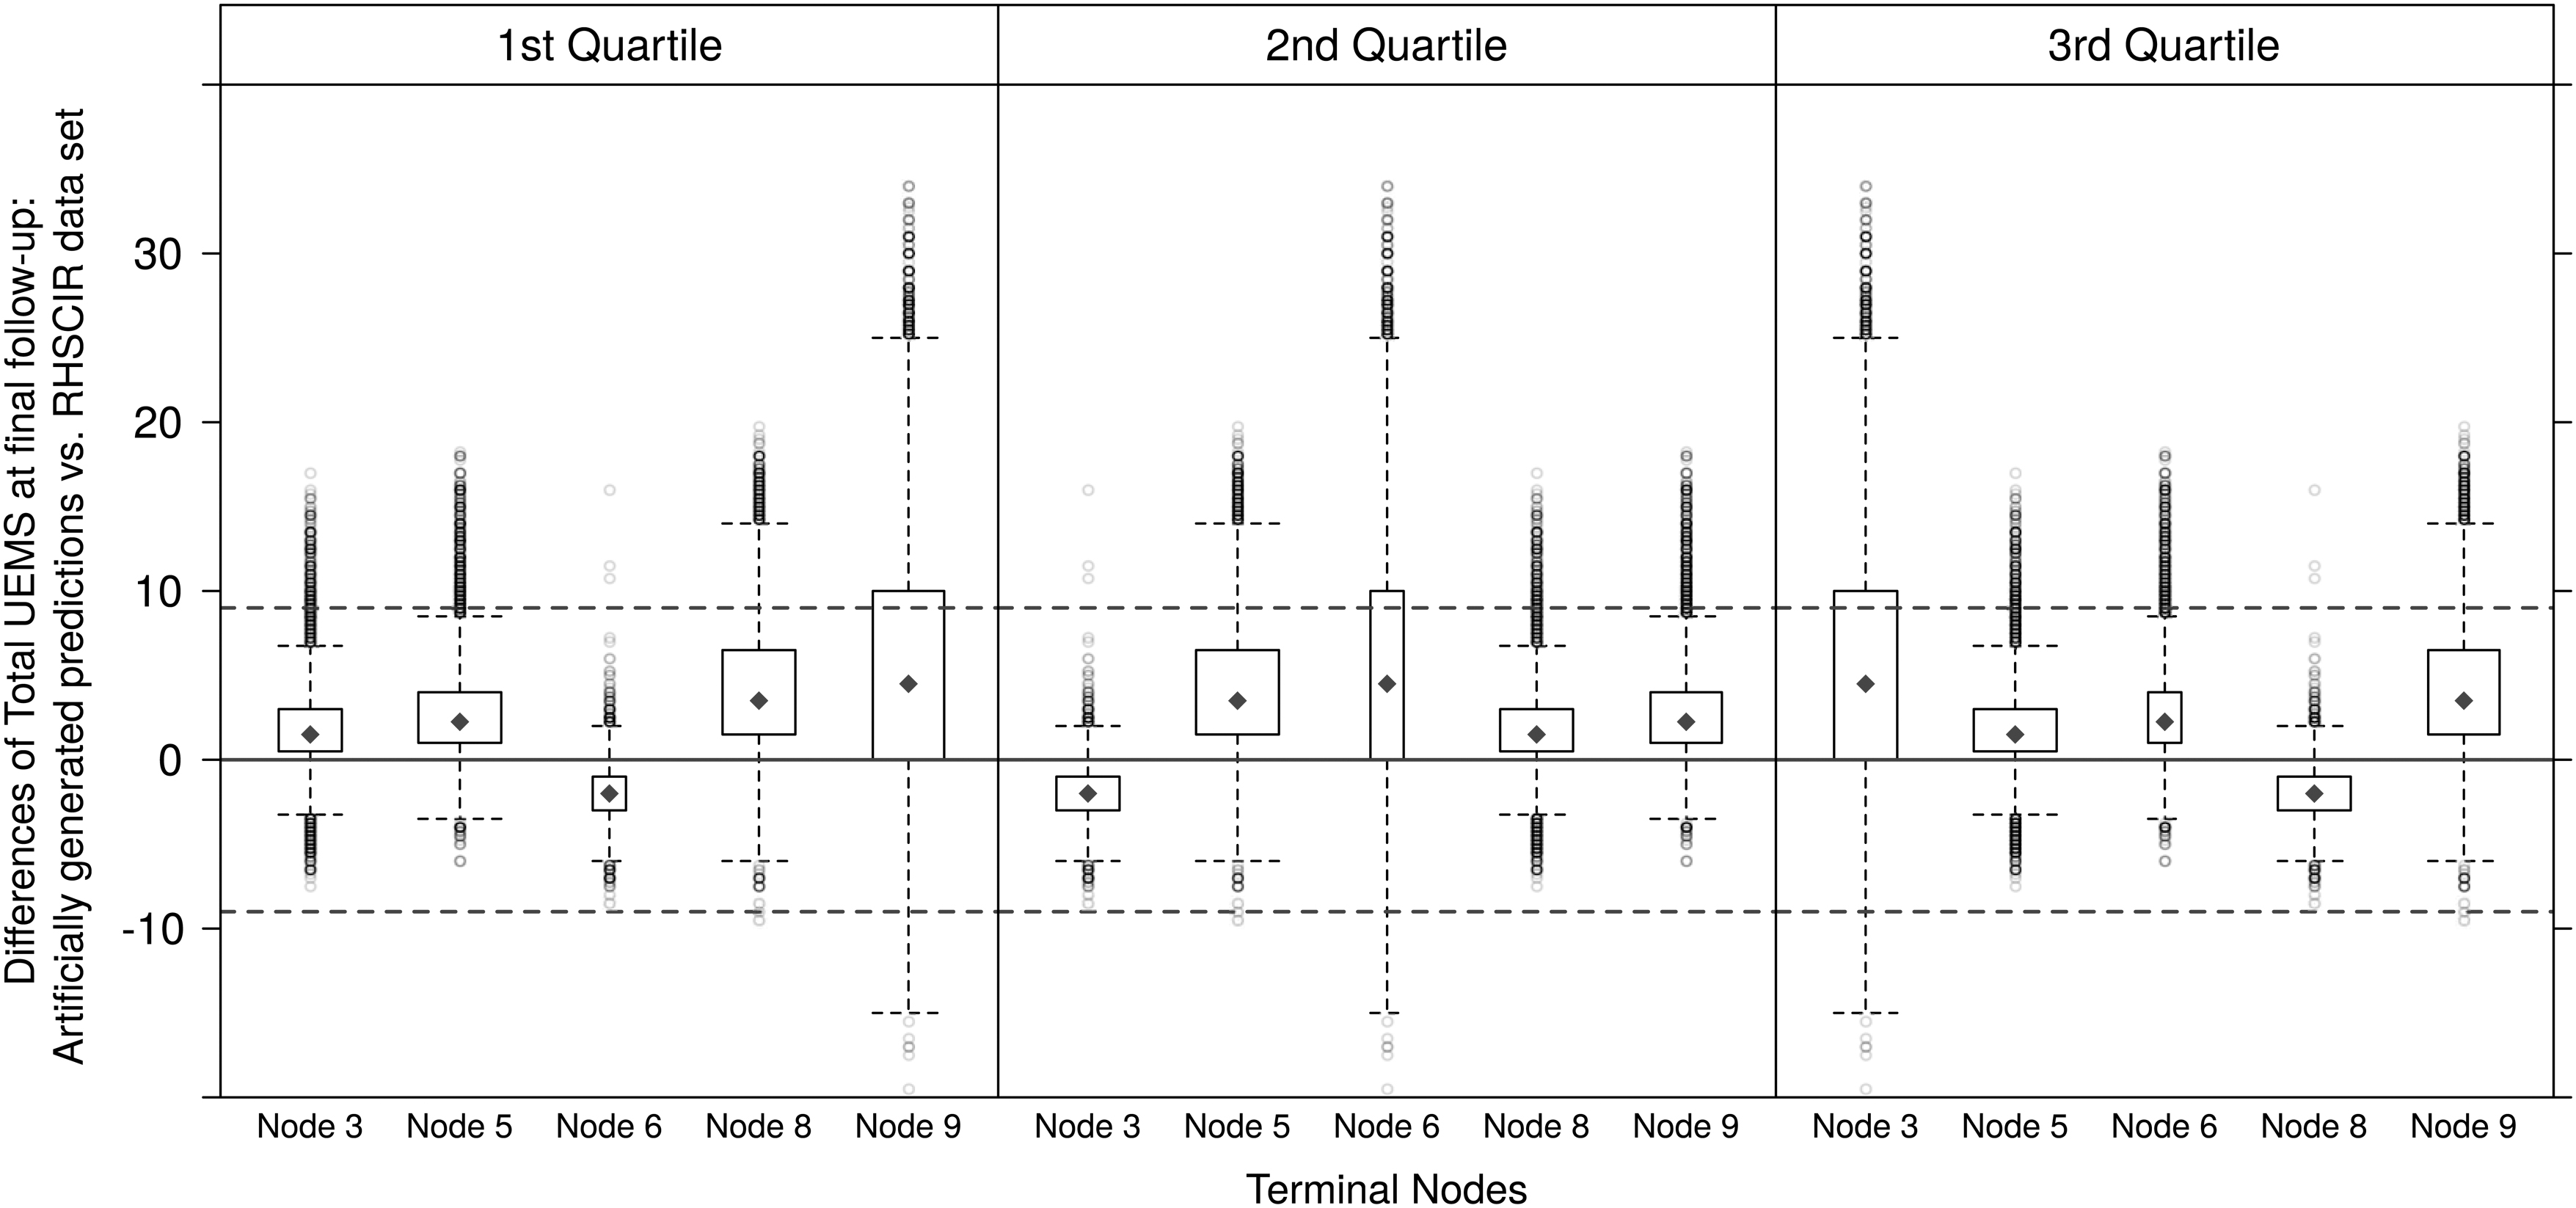
Comparison of the distribution of estimated (Rick Hansen Spinal Cord Injury Registry [RHSCIR]) and artificially simulated Total Upper Extremity Motor Score (UEMS) score at final follow-up. For the sake of comparability, the differences are plotted. Cases for which the difference of the estimated and artificially simulated quartiles is zero, lie on the red solid line. The red dashed lines at 9 represent the prespecified threshold of 9 UEMS score differences. The width of the individual boxplots is proportional to the sample size of the terminal nodes of Figure 2 in Evaniew and colleagues. 17 The blue rhombi represent the medians of the differences.
Comparison of the distribution of estimated (RHSCIR) and artificially simulated Total UEMS score at final follow-up. For the sake of comparability, the differences are plotted. Cases for which the difference of the estimated and artificially simulated quartiles is zero, lie on the red solid line. The red dashed lines at ±9 represent the prespecified threshold of 9 UEMS score differences. The width of the individual boxplots is proportional to the sample size of the terminal nodes of Figure 2 in Evaniew and colleagues. 17 The blue rhombi represent the medians of the differences.
The width of the individual boxplots is proportional to the sample size of the terminal node reported in Evaniew and colleagues: node 3 (n3 = 18), node 5 (n5 = 31), node 6 (n6 = 5), node 8 (n8 = 24), node 9 (n9 = 23). Cases for which the difference of the artificially simulated and estimated 25%, 50%, and 75% percentiles are zero, lie on the red solid line. The red dashed lines at ±9 UEMS score difference represent the prespecified threshold also used by Evaniew and colleagues. 17 Following their argumentation, the deviations within the dashed lines are still considered as acceptable. Note that all the medians (blue rhombi) of the differences per 25%, 50%, and 75% percentiles and per terminal nodeID lie within the ±9 UEMS score difference threshold.
To conclude, one has to consider that the results are restricted to the assumption that the Total UEMS distribution of the RHSCIR data set is the same as in the EMSCI data set, and thus in the URP-CTREE model proposed by Tanadini and colleagues. 9 Nevertheless, under this assumption, the comparison of the results from the external validation study by Evaniew and colleagues with our benchmark simulation suggests that the real observed differences in Figure 3A in Evaniew and colleagues are within the expected range. 17 This in turn suggests a certain degree of replicability and robustness of the results by Tanadini and colleagues. 9
Outcome prediction comparison study
The aim of our outcome prediction comparison study was to assess the possible shortcomings of URP-CTREEs in comparison to traditional statistical techniques or novel machine learning methods in terms of their prediction accuracy. We defined the out-of-bag log-likelihood as overall performance measure.
Comparison of prognostic models for Total UEMS at 6 months after SCI. We first generated 100 random splits of the EMSCI data into learning and validation samples in proportion 3:1 and then calculated the out-of-bag log-likelihoods for the quantification of the performance of the four competitors: 1) Colr() as unconditional continuous outcome logistic regression model; 2) Colr(α) as prognostic Colr model; 3) prognostic Conditional Inference Tree (URP-CTREE); and 4) prognostic ordinal forest. Larger values are preferable reflecting good performance of the respective algorithm. Each repetition corresponds to one parallel coordinate.
Figure 5 shows the out-of-bag log-likelihoods for the four different prognostic methods each applied to the 100 random splits of the EMSCI data set. All the methods which take the baseline patient characteristic variables into account outperformed the unconditional Colr model. Hence, one can state that it is beneficial to take available baseline measurements into account for potential prognostic models. The superior performance of the URP-CTREE and the ordinal forests compared with the linear model Colr(α) can be explained by a presumably non-linear impact of the predictor variables or the presence of higher-order interaction effects. The two upfront procedures, the URP-CTREE and the ordinal forest, only show slight differences in their out-of-bag log-likelihoods (Fig. 5). We therefore conclude that the performance of the URP-CTREE is comparable to a novel machine learning algorithm and superior to traditional statistical techniques involving additive and linear effects.
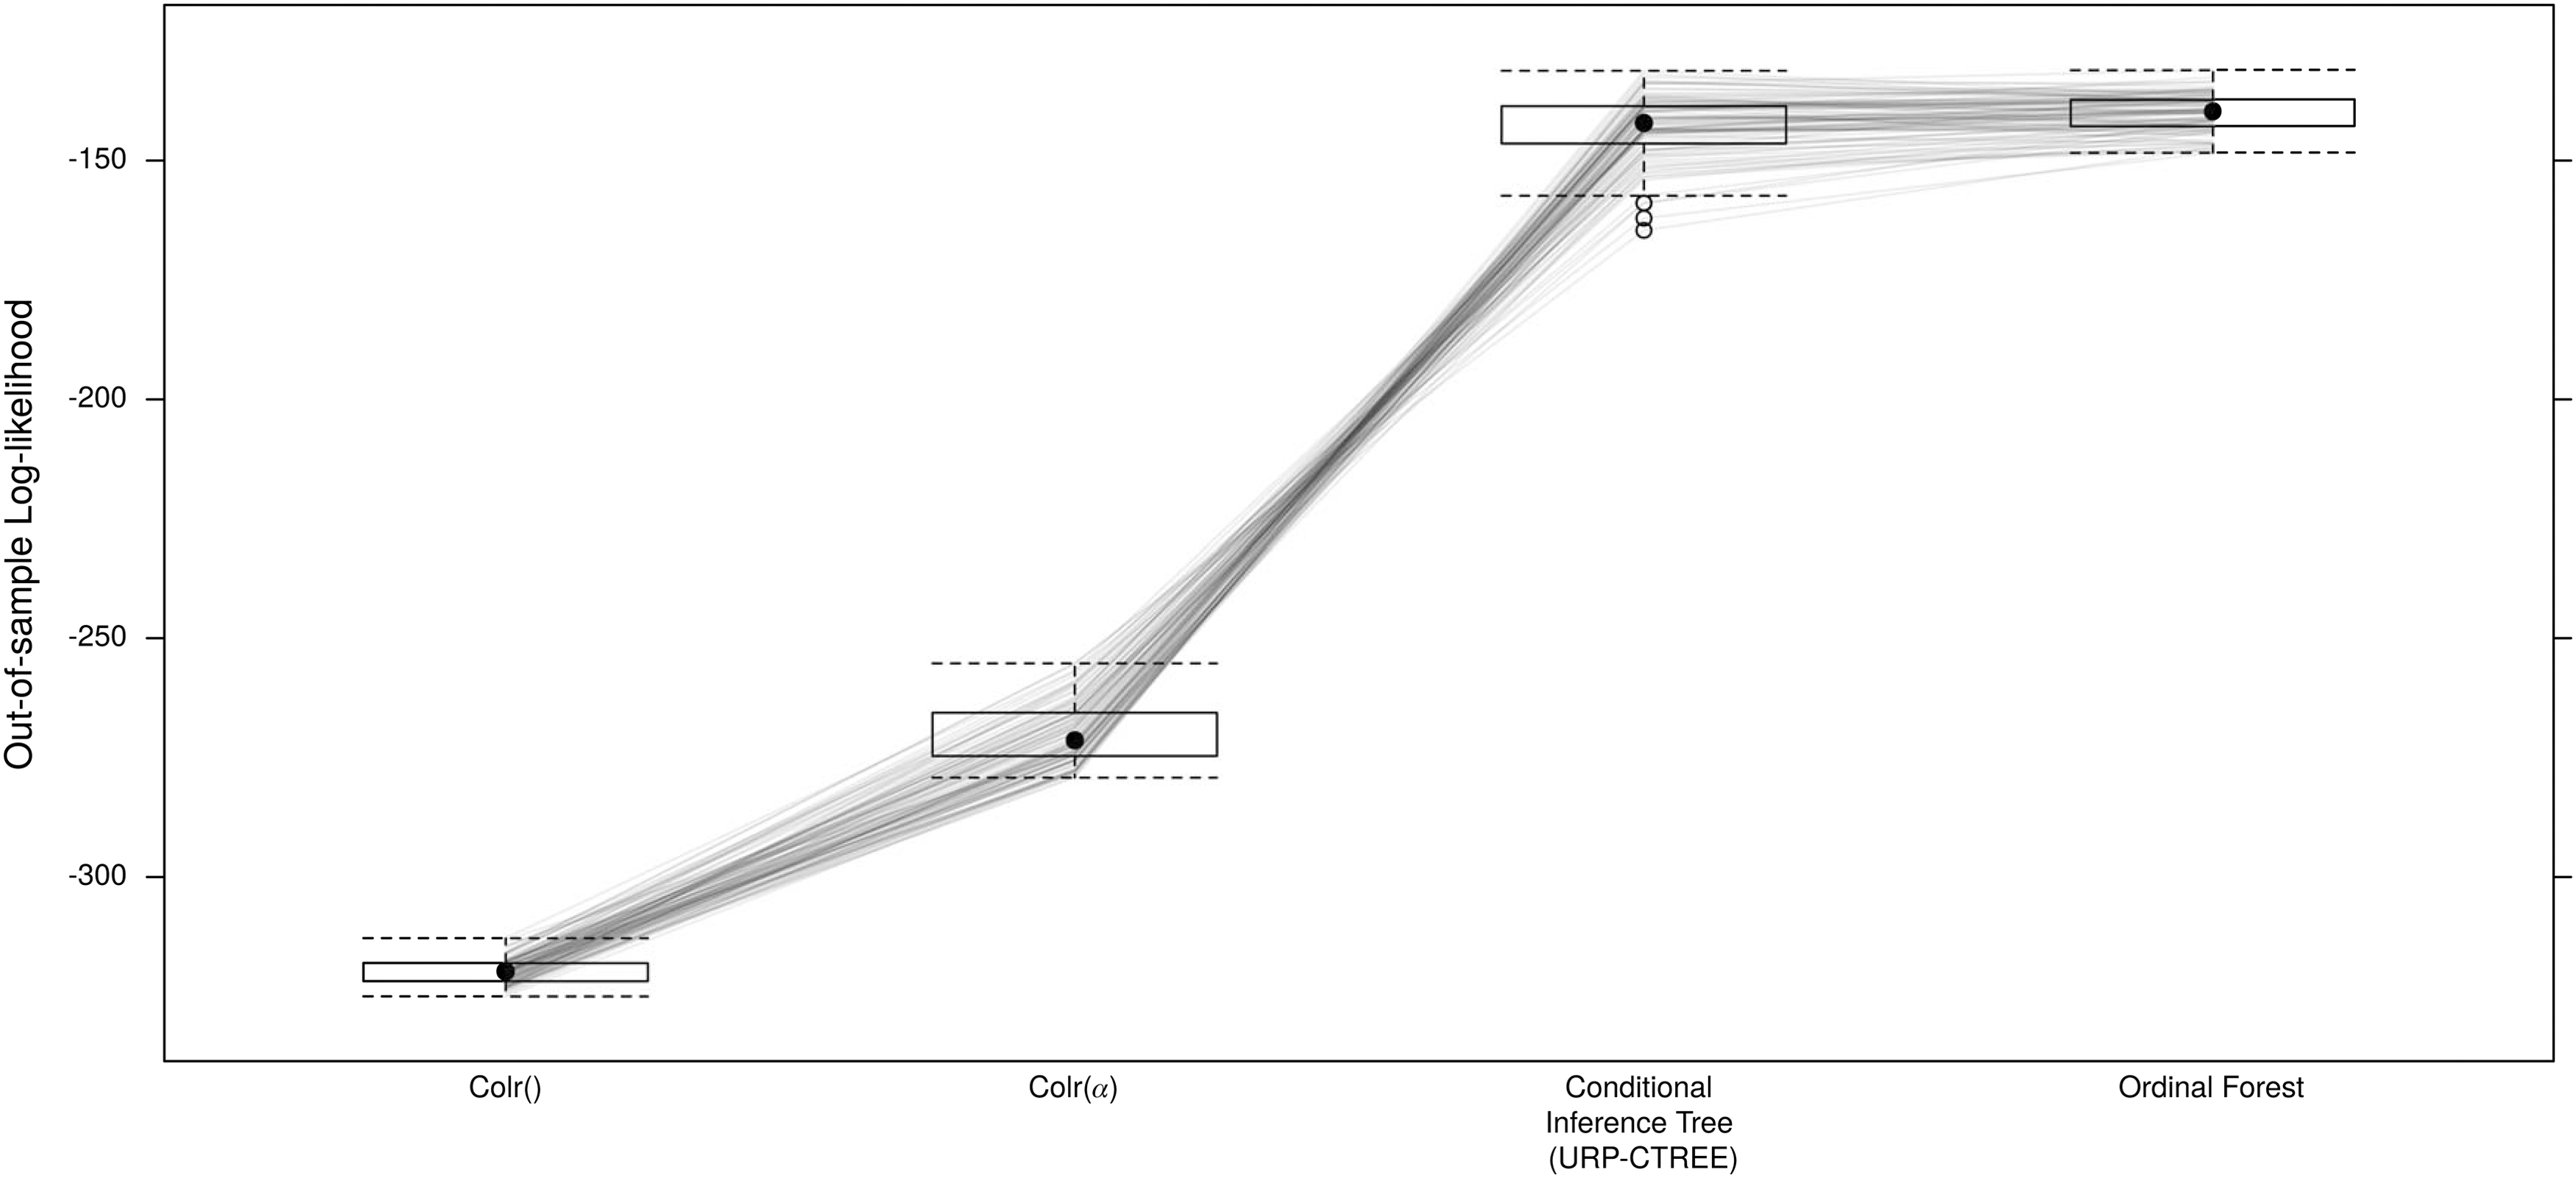
Comparison of prognostic models for Total Upper Extremity Motor Score (UEMS) at 6 months after spinal cord injury. We first generated 100 random splits of the European Multicenter Study about Spinal Cord Injury (EMSCI) data into learning and validation samples in proportion 3:1 and then calculated the out-of-bag log-likelihoods for the quantification of the performance of the four competitors: 1) Colr() as unconditional continuous outcome logistic regression model; 2) Colr(α) as prognostic Colr model; 3) prognostic Conditional Inference Tree (URP-CTREE); and 4) prognostic ordinal forest. Larger values are preferable reflecting good performance of the respective algorithm. Each repetition corresponds to one parallel coordinate. 25
Discussion
The URP-CTREE algorithm has been introduced to examine how indicators at early time points after SCI injury can be used to identify homogeneous subgroups from a very heterogeneous group of SCI patients to adequately recruit them for a prospective clinical trial. 9 The stratified subgroups are beneficial to quantify potential treatment effects of an intervention because it minimizes the sources of variability. Hence, the study design of future clinical trials benefits in the sense that the patient enrollment process can be well targeted to specific outcome levels and underlying conditions. This represents a big advantage specifically for SCI research given the fact that the number of newly injured traumatic spinal cord patients is low and very heterogeneous.
Evaniew and colleagues externally validated the previously published URP-CTREE by applying the proposed partition rules based on the EMSCI data set to the independent RHSCIR data set. 9,17 Evaniew and colleagues determined some limitations in the ability to stratify the RHSCIR cohort into homogeneous subgroups. Their conclusion is based on statistical tests for testing median differences in adjacent groups. We regard this as a valid approach; however, it should be noted that the differences among the homogeneous subgroups are strongly influenced by the baseline characteristics which were not considered in their approach. While the recovery of patients as measured by the UEMS 6 months after injury may appear similar, the fact that those patients had very different baseline characteristics reveals quite different recovery patterns. Consequently, those recovery patterns have to be considered different even though they lead to the same final outcome. To conclude, homogeneous subgroups may vary significantly in regards of their baseline characteristics even though the adjacent medians may not be statistically significantly different.
Further, Evaniew and colleagues also evaluated the prediction accuracy and judged it promising, but likely improvable due to the sensitivity towards the timing of baseline neurological examinations. Both concerns are valid on their own, however, both deviations in the context of external validation and the level of accuracy of prediction can only be scientifically evaluated if measured against a reference matrix. Such a reference matrix is provided by the herein proposed framework which quantifies the degree of external validity and prediction accuracy. As both aspects concurred in questioning the practical utility of URP-CTREE in comparison to established methods that are more familiar to researchers and clinicians, we have additionally implemented a performance comparison with traditional statistical techniques, such as linear or logistic regression, and a novel machine learning method.
Our approach to assess replicability and robustness of the URP-CTREE algorithm aimed to quantify the amount of expected deviation between the original URP-CTREE estimated by the EMSCI data set and an independent data set. For the sake of comparability, we based our comparison on the 25%, 50%, and 75% percentile following the ideas implemented in the external validation study. 17 Our analysis suggests that the real observed differences between the two publications can be expected under the assumption that the Total UEMS distribution of the RHSCIR data set is the same as in the EMSCI data set. 9,17
In terms of prediction performance of the URP-CTREE, our simulations determined that a single tree might not outperform the out-of-bag log-likelihood performance of a random forest like machine learning approach. However, a single tree strikes an advantageous balance between model complexity and interpretability. 16 We argue that the straightforward interpretability and the visual representation of a single tree compensates for the slightly higher variance of the out-of-bag log-likelihoods. 29 This particularly stresses the beneficial application of URP-CTREEs especially in a clinical context where straightforward interpretation and communication of the results is of utmost importance also for scientists without any strong background in statistics or machine learning. 18 Further, patient stratification in clinical trials requires the proper definition of patient subgroups, these being readily available from tree-based models but not from models with continuous risk score.
These findings let us conclude that the URP-CTREE algorithm is a favorable algorithm for the prediction of future clinical end-points and the planning of future SCI clinical trials by providing easily implementable, data-driven rationales for early patient stratification based on simple decision rules.
Generally speaking, clinical research profits from adequately used statistical methods and hence, from carefully collected data to (re-)evaluate the statistical procedures. The two underlying investigated data sets are extractions from two different large SCI databases (i.e., EMSCI and RHSCIR), which improve the understanding of care after SCI. As previously mentioned, both data sets consist of internationally recognized data variables, such as the ISNCSCI neurological assessment. However, the precise timing of the baseline neurological examination is variable which subsequently leads to challenges for direct comparisons and hence requires caution for final conclusions. For future research, we believe that SCI clinical trials would benefit from a standard definition of the timing of baseline neurological evaluation and investigations in relation to the time at which the injury occurred. 48 Such a standardization would also warrant to potential merging of several SCI databases (i.e., the RHSCIR and the EMSCI database, with other sources to bridge gaps of data collection limitations). Although, one should consider that, there are distinct differences in SCI care between the USA and Europe. Unlike many SCI centers in the U.S., European, and Canadian rehabilitation centers treat people living with SCI as inpatients for several months after injury. Hence, it will be important to track differences in the level and duration of care after SCI as these may influence trial outcomes. 6
Conclusion
The URP-CTREE algorithm enables the stratification of a heterogeneous population into homogeneous subgroups. This is especially advantageous for SCI trials where the patient population is extremely heterogeneous. The procedure allows to define inclusive trial criteria while minimizing potential ceiling and flooring effects. Our research goal was to evaluate the EMSCI URP-CTREE published in Tanadini and colleagues in terms of its robustness applied to external data sets and prediction accuracy in comparison with traditional statistical techniques and a novel machine learning. Our simulation study provided strong evidence for the robustness of URP-CTREE, which is achieved without compromising prediction accuracy as shown in the cross-validation study. Hence, the robust URP-CTREE method provides an easily implementable, data-driven rationale for early patient stratification and for prediction of future clinical end-points simplifying the planning of future SCI clinical trials based on simple decision rules.
Computational details
All computations were performed using version 4.0.2.
49
The tram
50
add-on package was used to estimate the terminal node specific cumulative distribution functions (Fig. 3). The underlying statistical theory is described elsewhere.
38
The traforest() function from the trtf
51
package was used to estimate the transformation forests for the cross-validation study (Fig. 5). The add-on trtf
51
package was built on top of the infrastructure packages partykit
52
and mlt
Footnotes
Acknowledgments
We thank René Koller for continuous assistance with the EMSCI database.
Funding Information
The authors disclosed receipt of financial support for the research, authorship, and publication of this article from the Horizon 2020 Research and Innovation Programme of the European Union under grant agreement number 681094, and is supported by the Swiss State Secretariat for Education, Research and Innovation (SERI) under contract number 15.0137.
Author Disclosure Statement
The authors declare that there are no conflicts of interest.