
Abstract
Traumatic spinal cord injury causes rapid neuronal and vascular injury, and predictive biomarkers are needed to facilitate acute patient management. This study examined the progression of magnetic resonance imaging (MRI) biomarkers after spinal cord injury and their ability to predict long-term neurological outcomes in a rodent model, with an emphasis on diffusion-weighted imaging (DWI) markers of axonal injury and perfusion-weighted imaging of spinal cord blood flow (SCBF). Adult Sprague–Dawley rats received a cervical contusion injury of varying severity (injured = 30, sham = 9). MRI at 4 h, 48-h, and 12-weeks post-injury included T1, T2, perfusion, and DWI. Locomotor outcome was assessed up to 12 weeks post-injury. At 4 h, the deficit in SCBF was larger than the DWI lesion, and although SCBF partially recovered by 48 h, the DWI lesion expanded. At 4 h, the volume of the SCBF deficit (R 2 = 0.56, padj < 0.01) was significantly correlated with 12-week locomotor outcome, whereas DWI (R 2 = 0.30, padj < 0.01) was less predictive of outcome. At 48 h, SCBF (R 2 = 0.41, padj < 0.01) became less associated with outcome, and DWI (R 2 = 0.38, padj < 0.01) lesion volume became more closely related to outcome. Spinal cord perfusion has unique spatiotemporal dynamics compared with diffusion measures of axonal damage and highlights the importance of acute perfusion abnormalities. Perfusion and diffusion offer complementary and clinically relevant insight into physiological and structural abnormalities following spinal cord injury beyond those afforded by T1 or T2 contrasts.
Introduction
The acute period after traumatic spinal cord injury (SCI) is crucial for promoting better neurological outcomes and minimizing the progressive secondary injury to tissue initially spared from the traumatic insult. 1 The complex and heterogeneous nature of SCI pathophysiology, along with the additional complications that emerge in clinical SCI settings, has proved to be difficult when attempting to translate promising pre-clinical research into therapies. 2 Reliable markers of injury severity and prognosis during the acute period could significantly alter clinical management and lead to more precise interventions or treatments. Unfortunately, clinically available tools such as neurological assessments and conventional magnetic resonance imaging (MRI) contrasts, 3 although central to the diagnosis of SCI, are limited in their ability to predict long-term functional outcomes. The lack of an established biomarker to stratify heterogeneous injuries in clinical trials and in experimental animal studies may be a barrier to the translation of otherwise promising acute therapies.
Because of the largely irreversible nature of axonal damage, a beneficial biomarker for acute SCI is one that can identify tissue that is at risk for long-term damage but that may be salvaged with appropriate and timely intervention. Using a multi-modal approach, MRI can make this distinction. Diffusion MRI has consistently detected microscopic damage in animal models of SCI 4 –6 that represents irreversible axonal damage. Previous work developed a diffusion MRI approach for the spinal cord that suppresses extra-axonal signals using a high-strength (filtering) gradient, which enhances the sensitivity to cytotoxic edema and its underlying microscopic structural changes. This is compared with other contrasts such as diffusion tensor imagining, which are sensitive to both cytotoxic and vasogenic edema. 7,8 This method, termed “filtered diffusion-weighted imaging” (fDWI), is a promising biomarker of early axonal damage. 9 However, axon damage is an evolving feature of injury, and other pathophysiological features are thought to be direct and causal mechanisms of secondary injury, notably hypoperfusion and edema. MRI techniques to measure these potential causal mechanisms include perfusion MRI methods, such as arterial spin labeling, which was recently optimized for the rodent spinal cord. 10 Additionally, both T1- and T2-weighted imaging are affected by water content and are sensitive, although not specific, to edema. 11
The main goal of this study was to evaluate advanced quantitative MRI techniques collected acutely after SCI in the rat as biomarkers for the prediction of long-term neurological outcomes. We aimed to differentiate MRI modalities to access irreversible axonal damage (fDWI) and modalities that measure secondary physiological changes including spinal cord blood flow (SCBF) and edema (T1 and T2). First, we identified the behavioral and chronic MRI metrics that were most related to injury severity as primary outcome measures. Next, we compared the temporal and spatial changes in perfusion and diffusion MRI following SCI across a range of injury severities. Third, we use data-driven methods to establish acute MRI thresholds to predict final tissue fate. Finally, we evaluated the ability of acute advanced MRI measures to predict chronic functional outcome. The long-term goal of this project is to evaluate the utility of MRI biomarkers to progress toward improved patient management and successful interventional strategies for traumatic SCI.
Methods
The study design and analysis plan were pre-registered with the Open Science Framework Preregister (
Animals
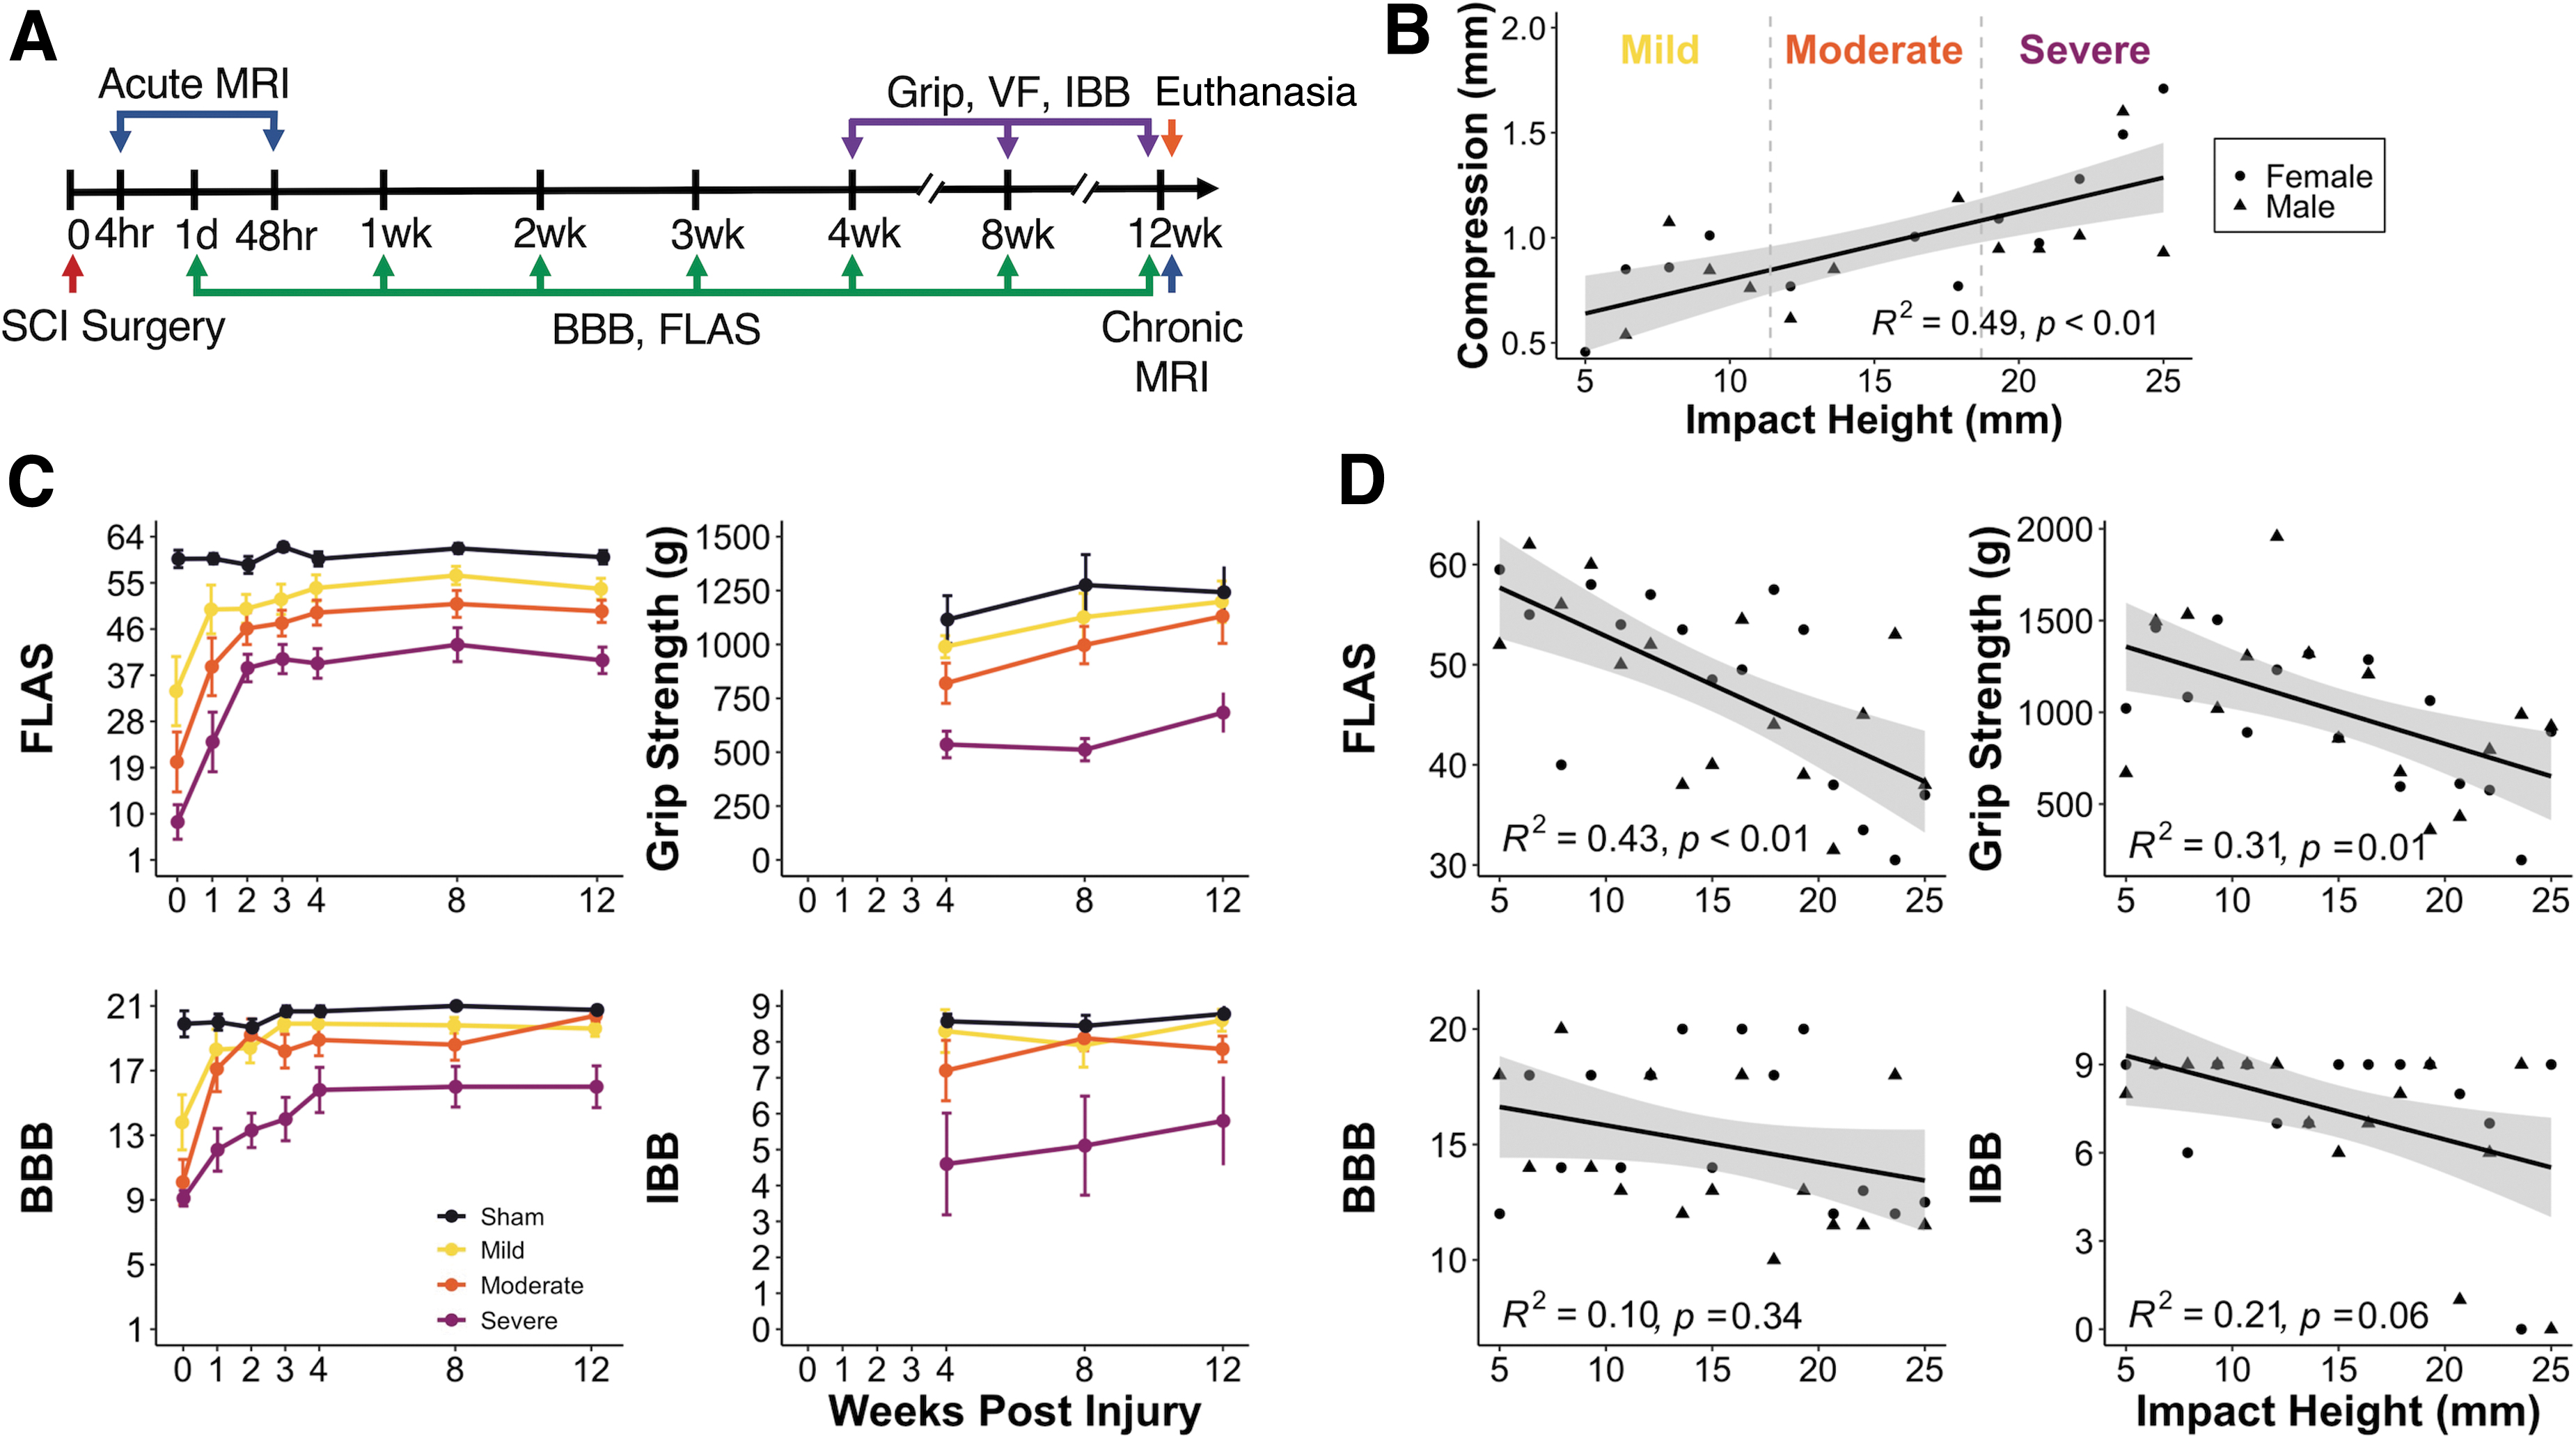
All animal procedures were approved by the Institutional Animal Care and Use Committees at the Medical College of Wisconsin and the Clement J. Zablocki Veterans' Affairs Medical Center in accordance with the Animal Welfare Act and the Health Research Extension Act. All studies were conducted and reported in accordance with the Animal Research: Reporting of In Vivo Experiments (ARRIVE) guidelines. 14 This study used a total of 42 Sprague–Dawley (Charles River Laboratories, Wilmington, MA) adult rats ranging in age from 8 to 10 weeks and weighing 250–300 g, of which 10 were sham and 32 had cervical spinal cord contusion injuries. An equal number of males and females were included in each group. Animals were housed at our facility for 1 week prior to surgery and underwent handling and acclimation to behavioral apparatuses, with supplemental nutritional care to minimize complications or early end-points. 15 Animals were on study for a total of 12 weeks following SCI, with MRI time points at 4 h (3:57 ± 0:37), 48 h (48:12 ± 0:39), and 12 weeks post-injury. Behavioral testing was performed between 1 and 90 days post-injury (Fig. 1A).
Summary data for magnetic resonance imaging (MRI) and behavioral metrics.
Spinal cord contusion
Rats received a midline contusion injury at cervical level 5 (C5), with a range of injury severities, and 10 rats received a sham laminectomy-only surgery. Animals were block randomized to injury severity to ensure equal distributions across all injury severities and to balance the effects of sex.
Animals were anesthetized with 4–5% inhaled isoflurane and maintained with 1.5–3% inhaled isoflurane while respiration was monitored. Animals were placed on a heating pad set at 37°C. Subcutaneous analgesic and fluids were administered before the start of surgery (carprofen:1.25 mg, lactated Ringer's solution: 5 mL). Their backs were shaved and cleaned with betadine and alcohol. Using aseptic techniques, an incision was made through the skin and the muscle was separated from the spinal column. A dorsal laminectomy was performed at C5, leaving the dura intact. The spine was held in a customized holder for stability, and a contusion injury was performed at the midline with the Multicenter Animal Spinal Cord Injury Study Impactor 16 using a 10 g rod with a 2.5 mm diameter tip. Drop height varied uniformly between 5 and 25 mm, and cord compression was recorded from the impactor software as the distance from the pre-injury spinal cord surface to the point of maximal compression measured during the impact. Sham animals underwent the same laminectomy procedure, but without an impact. The incision site was sutured, and animals recovered under supervision. Post-operative care of analgesic (carprofen: 1.25 mg) and fluids (lactated Ringer's solution: 5 mL) was administered twice a day for a minimum of 3 days. Supplemental nutrition of Ensure, trail mix, or Nutella was provided as needed to prevent excess weight loss. Animals were housed in pairs except for the first 24–48 h after surgery, when they were housed singly.
MRI acquisition
MRI was performed on a 9.4T Bruker Biospec (Paravision 6.0.1, Billerica, MA). At 4 and 48 h post-injury, rats were placed in a prone position inside a 38 mm diameter Litz coil (Doty Scientific, Inc., Columbia, SC). Animals were anesthetized with 4–5% inhaled isoflurane and maintained at 2% inhaled isoflurane for the duration of the MRI, adjusted to maintain stable respiration of 30–50 breaths per min. Body temperature was maintained within 1° of 37°C with heated air and recorded every 10 min.
Automated, fieldmap-based B0 shimming was performed to minimize magnetic field inhomogeneity. T1-weighted sagittal images were used to position slices over the injury epicenter. Axial and sagittal, multi-echo T2-weighted rapid acquisition with relaxation enhancement (RARE) images were collected with 8 or 12 slices, respectively, centered around the injury site (repetition time [TR]: 2000 ms; echo time [TE]: 20, 59, and 99 ms; two repetitions; 0.16 mm2 in-plane resolution; 1 mm slice thickness).
A multi-delay pseudo-continuous arterial spin labeling (pCASL) was used to obtain perfusion-weighted images, as previously detailed. 10 The label plane was positioned perpendicular to the vertebral arteries at C7 with a labeling duration of 1100 ms, 400 μs Hanning pulses, 1 ms pulse repeat, 5 μT average B1, and 45/5 mT/m Gmax/Gmean). A slice-selective inversion pulse 1555 ms before imaging nulled the signal from cerebral spinal fluid. Four post-label delay times (100, 200, 300, and 400 ms) were collected to minimize the effect of transit time. For sagittal imaging, a single-slice RARE readout with TR/TE = 4000/5 ms, RARE factor = 16, repetitions = 3, in-plane resolution = 0.20 mm2, slice thickness = 2 mm. For axial imaging, a four-segment echo planar readout was used with eight slices positioned superior to the labeling plane and TR/TE = 4000/13.6 ms, repetitions = 4, in-plane resolution = 0.23 mm2, slice thickness = 1.25 mm. A proton density-weighted image and images with inversion times of 200, 1500, 3000, and 6000 ms were collected at the end of each pCASL scan. To quantify pCASL inversion efficiency, a flow-compensated gradient-echo axial image was acquired 4 mm superior to the label plane with a short label duration (200 ms) and post-label delay (10 ms), with TR/TE = 225/3.5 ms, averages = 4, in-plane resolution = 0.28 mm2, and slice thickness = 1 mm.
An fDWI protocol was acquired with separate acquisitions for either sagittal and axial using RARE and echo planar imaging (EPI) readouts, respectively. The diffusion preparations used the same parameters including a high-strength (b = 2000 sec/mm2) diffusion gradient perpendicular to the cord (filter) with an additional 20 diffusion vectors (b = 800 sec/mm2) orthogonal to the first. For RARE imaging, the diffusion preparation preceded the excitation to maintain phase stability and has been described in detail previously 8 The EPI readout used conventional Stejskal–Tanner diffusion gradients with a four-shot echo planar imaging readout and TR/TE = 1800/32 ms, repetitions = 3, slice thickness = 1.25 mm, number of slices = 12. The total protocol duration was ∼1.5 h.
At 12 weeks, an abbreviated MRI protocol was used to image the spinal cord lesions using T2-weighted imaging, previously shown to correlate with histology of spared tissue.
12
Rats were placed in a 72 mm diameter quadrature volume coil (Bruker Biospin). Axial and sagittal, multi-echo T2-weighted RARE images were collected with 12 or 14 slices, respectively, centered around the injury site: TR: 2000/20 ms; TE: 20, 59, and 99 ms; six repetitions, 0.16 mm2 in-plane resolution, 0.6 mm thick thickness. The total protocol duration was ∼1 h. All MRI sequences are available at
Image processing
A processing pipeline was integrated into Nipype
17
and consisted of calculation of quantitative maps followed by spatial registration, available at
To segment lesions at 12-weeks post-injury, spinal cord masks were initially drawn on T2 maps in native space, to include both the lesion cavity and the bordering spinal cord tissue. The manual regions of interest (ROIs) were necessary to avoid including surrounding cerebrospinal fluid (CSF) in the lesion mask. To ensure objectivity, these masks were subsequently thresholded with T2 values of 120 ms to generate final lesion-only masks. The threshold of 120 ms was 2 standard deviations above the sham animal mean T2 value.
Quantitative maps and binary masks were spatially registered to a custom template space. Briefly, the Atlas of the Rat Spinal Cord
21
was digitized and manually segmented into white and gray matter, noting that each spinal cord level contains a coronal section from a single animal. To enforce symmetry, images and their left–right mirrored versions were iteratively averaged and aligned using a non-linear registration in advanced normalization tools (ANTs). Each image was expanded to a thickness of 3 mm and stacked along the longitudinal axis with the central canal aligned across all levels. The final image was resampled at a resolution of 50 × 50 × 150 mm3. A CSF region was added as a border region of 2 voxels. All template image files were created to be compatible with the Spinal Cord Toolbox, including maps of segmental levels, centerline, and images to mimic T1 and T2 contrast. The template is available at
Behavioral testing
A comprehensive behavioral testing protocol was implemented to include measures of locomotion and sensory function. Measures of locomotion included the Basso, Bresnahan, and Beattie (BBB) Scale Test, 23 the forelimb locomotor assessment score (FLAS), 24 and the Irvine, Beattie, and Bresnahan (IBB) Forelimb Recovery Scale. 25 BBB and FLAS were conducted weekly for the first month and monthly thereafter. The IBB, a manual Von Frey filament test, and a forelimb grip strength test (Bioseb) 26 were conducted at 4, 8, and 12 weeks by the same individual. Behavioral tests were scored from video recordings, and study personnel were blinded to injury severity for all tests and scoring.
Statistical and data analysis
Voxelwise comparisons between sham and SCI rats for each contrast were evaluated with a two-sample unpaired t test and non-parametric permutation inference, based multi-comparison correction of the familywise error rate implemented in FSLrandomise. 27 Impact height was used as a covariate to account for within-group variability.
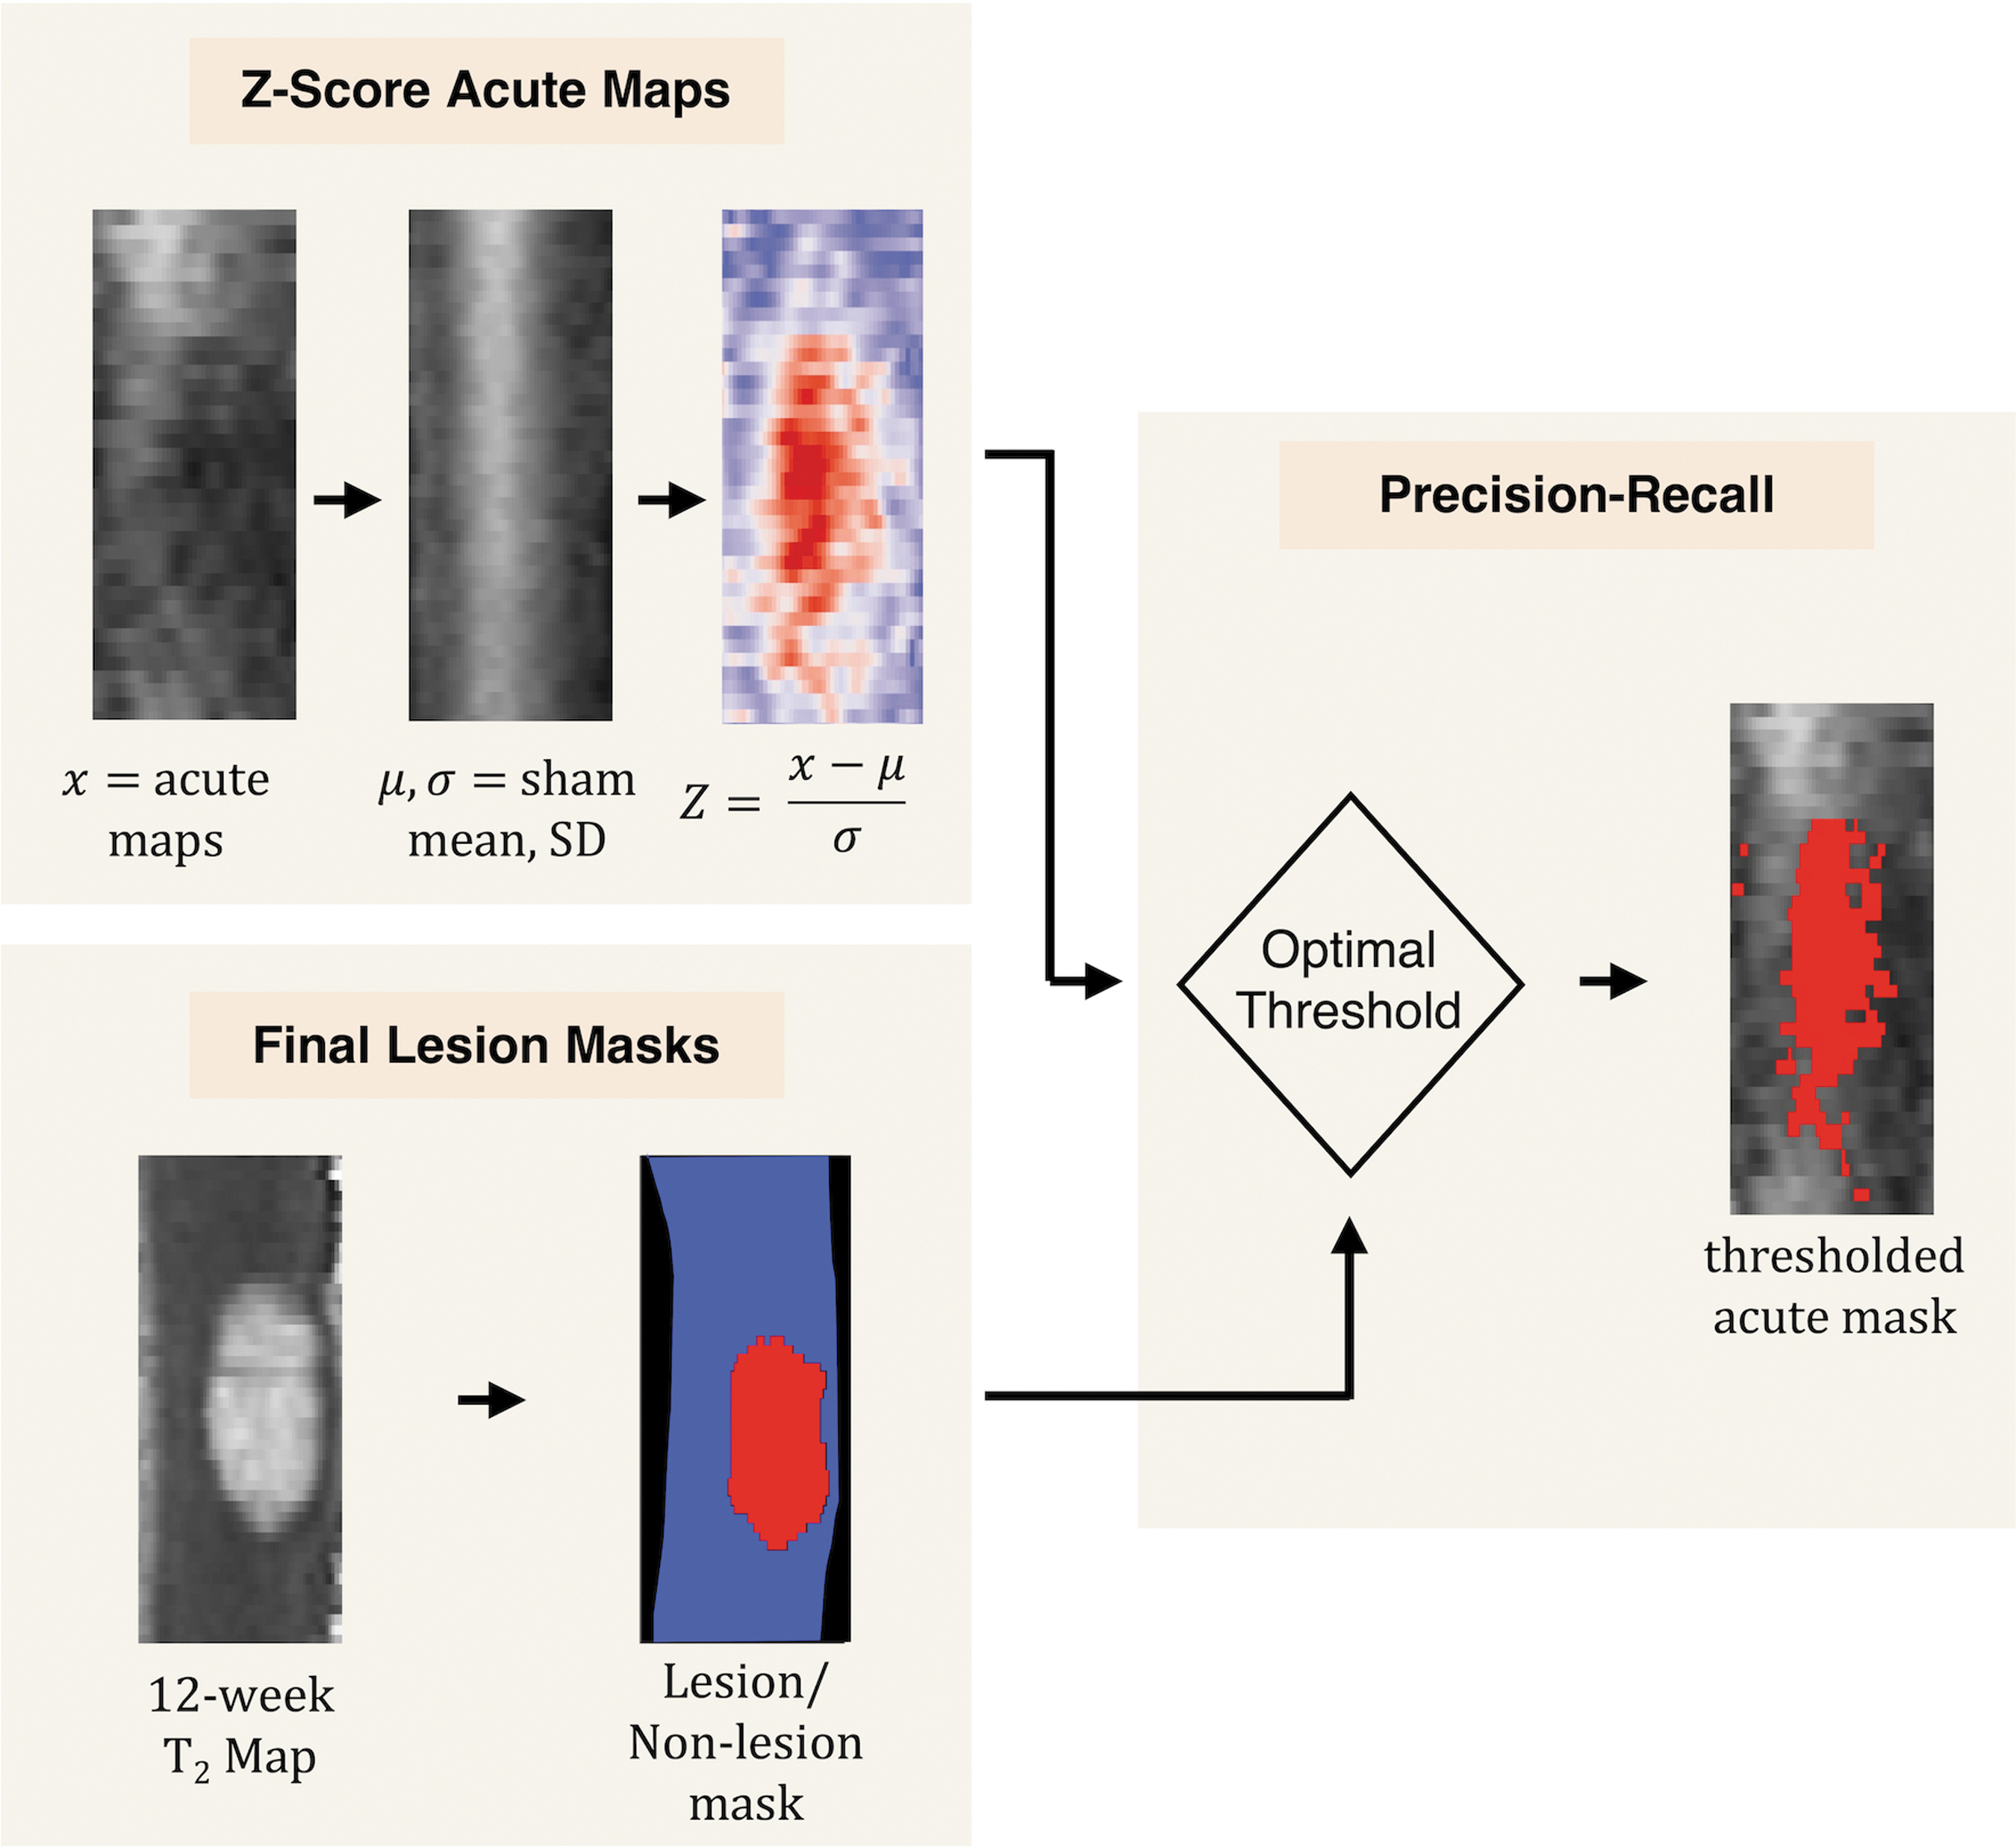
An unbiased approach was used to determine the ability of each acute MRI quantitative metric to predict final tissue fate and derive an optimal threshold for differentiating abnormal values. Final tissue fate was defined as the binary lesion from the 12-week MRI. To account for differences between white and gray matter, particularly for fADC|| and SCBF, maps were converted to z scores using the voxelwise mean and standard deviation of the sham group, which included both 4- and 48-h time points. Because the relative percentage of lesion or non-lesion voxels was highly imbalanced, a precision-recall analysis was used in which the area under the curve (AUC) and the optimal threshold were derived from the analysis for each MRI contrast (Fig. 2). Acute MRI quantitative maps were subsequently masked based on the optimal threshold for each metric, to quantify the volume of abnormality in each of the acute contrasts.
Methods to establish data-derived thresholds
Linear regressions were used to evaluate associations between impact height and either 12-week behavioral or MRI metrics. Linear regression was used to determine the predicative value of acute lesion volume from each MRI metric on 12-week functional outcomes. Within-analysis multiple comparisons were accounted for by controlling the false discovery rate, 28 and adjusted p-values are reported. To aid visualization, injuries were additionally grouped by impactor drop height into mild (5–11 mm), moderate (12–18 mm), and severe (19–25 mm) ranges, but all quantitative analysis used continuous variables.
Results
Associations of behavioral and chronic MRI metrics to injury severity
The final sample size was 39 (injured group = 30, sham group = 9). One sham rat (female) was excluded because of a surgical error and was not replaced. One injured rat died before completing all time points as a result of a complication from anesthesia, and a surgical error occurred in one injured rat. Both were replaced with rats of the same injury severity and sex. Prescribed impact height was positively associated with the measured cord compression (mm) (R 2 = 0.49, p < 0.01) (Fig. 1B). Behaviorally, a decrease in forelimb function was present immediately after SCI and dependent on the impact height, with all animals exhibiting functional recovery across the study period (Fig. 1C). To identify the relationship between behavioral metrics and impact severity, linear regression revealed that FLAS (R 2 = 0.3943, p adj < 0.01), and forelimb grip strength (R 2 = 0.31, p adj = 0.01) significantly predicted by impact height (Fig. 1D). IBB (R 2 = 0.21, p adj = 0.04) was also significant, but the scale exhibited ceiling effects. Impact height did not predict BBB (R 2 = 0.10, p adj = 0.34). Von Frey was not correlated with impact height for either forelimb (R 2 = 0.001, p adj = 1.0) or hindlimb (R 2 = 0.03, p adj = 1.0) sub-scores. Based on the results of these data, subsequent analyses used 12-week FLAS score as the measure of long-term functional outcome.
For visualization of the changes in MRI contrasts caused by injury, animals' injuries were categorized as mild, moderate, or severe for each of the two measured time points. The qualitative results reveal signs of SCI, including increased T1 and T2, and decreased fADC|| and SCBF across the range of injury severities (Fig. 3). No MRI changes were observed in the spinal cord following sham surgeries. The relationship between 12-week MRI metrics and impact height was evaluated (Fig. 4). Minimal cross-sectional area (i.e., spared tissue) was negatively correlated with impact height (R 2 = 0.30, p adj = 0.02), whereas neither lesion volume (R 2 = 0.01, p adj = 1.0) nor length (R 2 = 0.01, p adj = 1.0) was significantly correlated with impact height. Minimal cross-sectional area was moderately associated with 12-week FLAS; however, not significantly (R 2 = 0.16, p adj = 0.18). Lesion volume (R 2 = 0.001, p adj = 1.0) and length were not associated with 12-week FLAS.
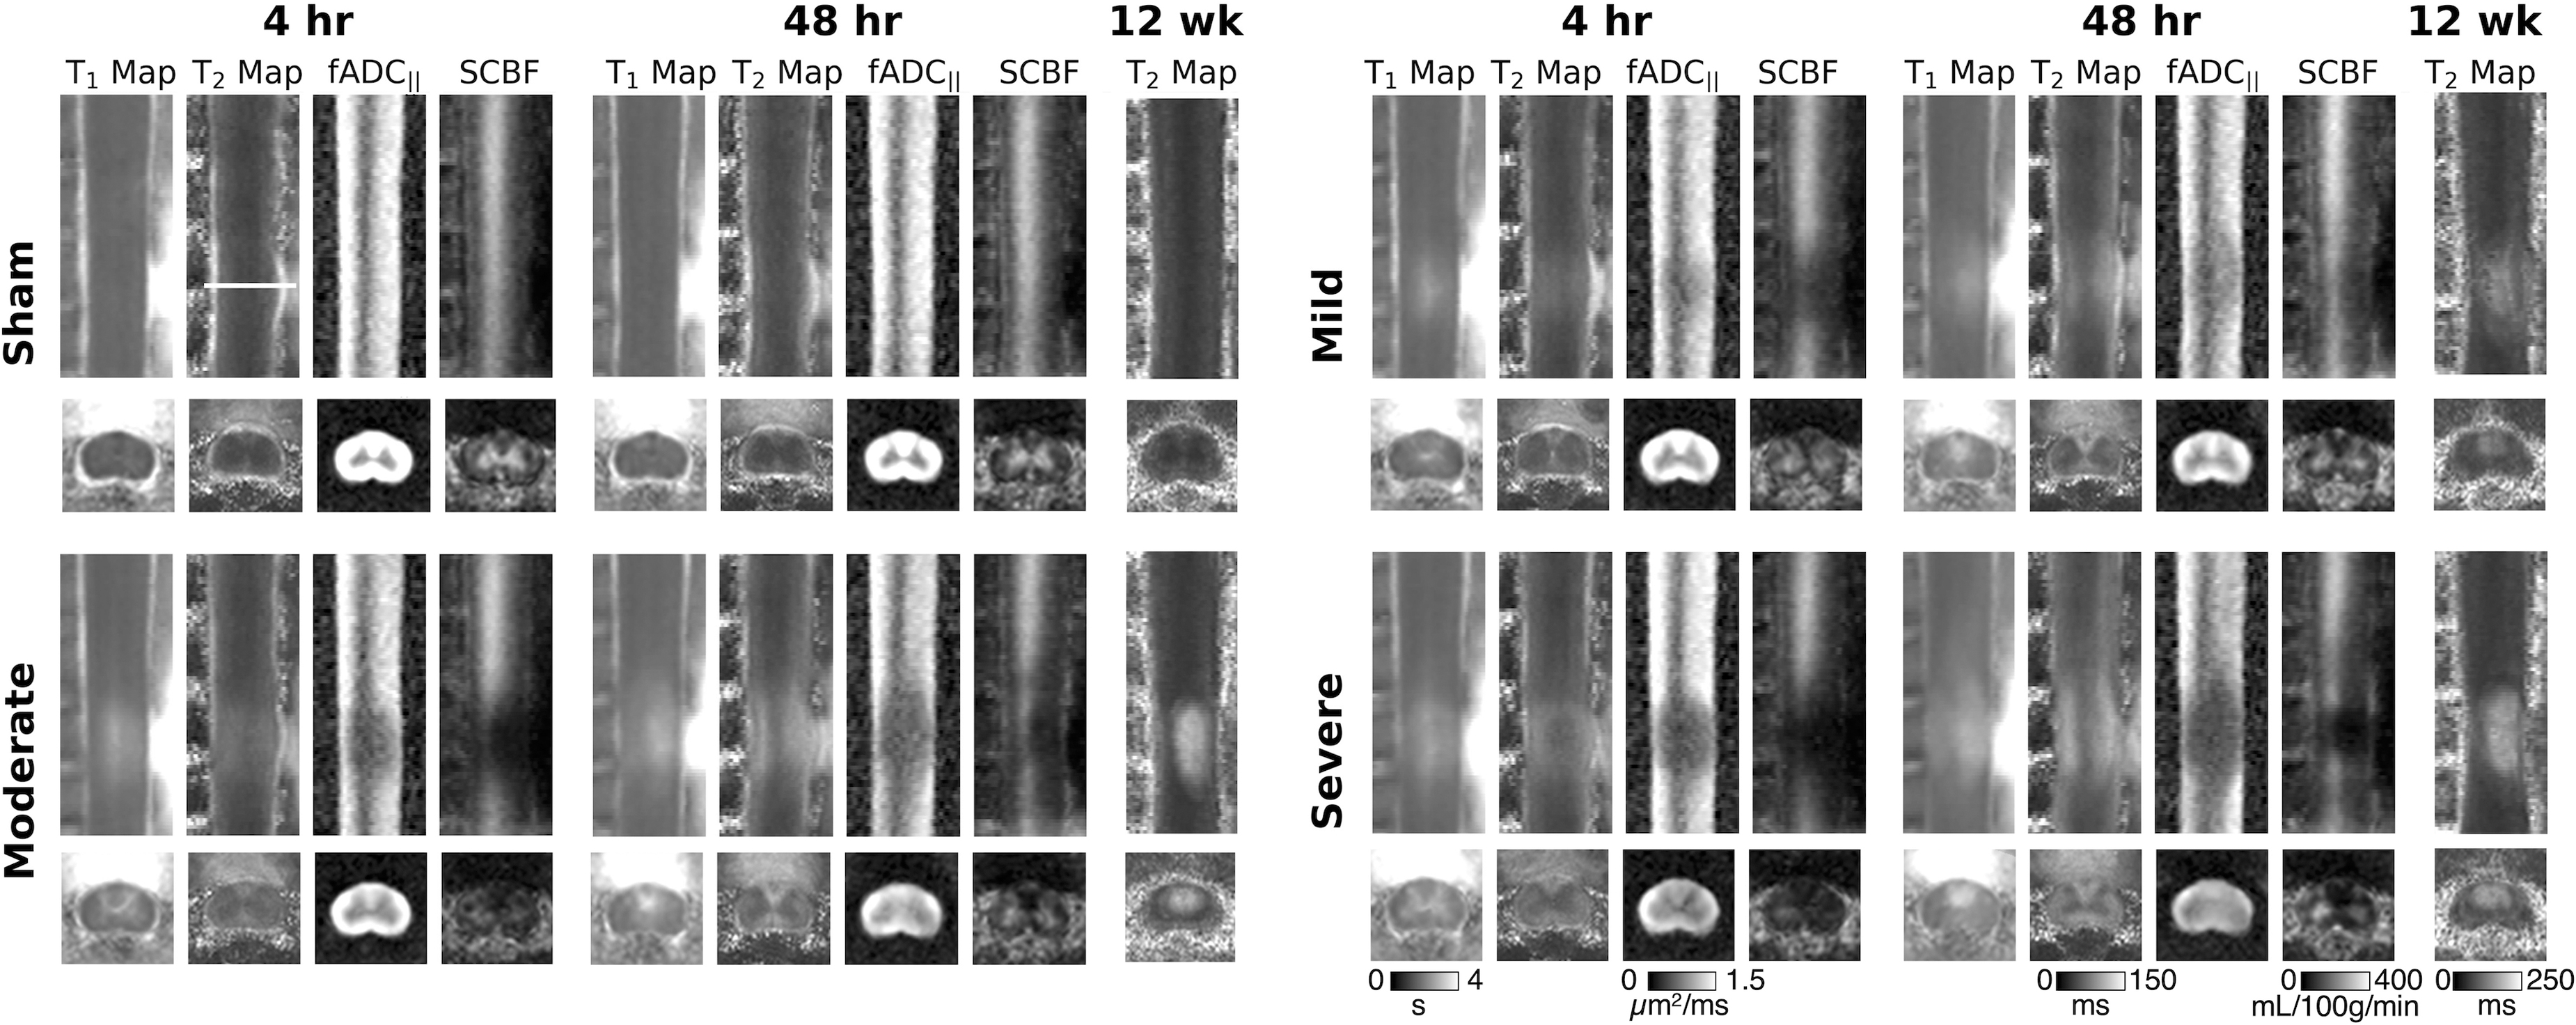
Quantitative maps of T1 and T2 maps, filtered apparent diffusion coefficient (fADC||), and spinal cord blood flow (SCBF). Images were spatially registered to a custom template. Averages of each group are displayed for both sagittal and axial acquisitions. Sagittal images are cropped to show the region from C3 to C6 and the longitudinal extent of the injury lesion. A single axial slice at the center of the injury site (C5) is indicated by the white line on a sham 4-h T2 map. Sham (n = 9), mild (n = 10), moderate (n = 10), and severe (n = 10).
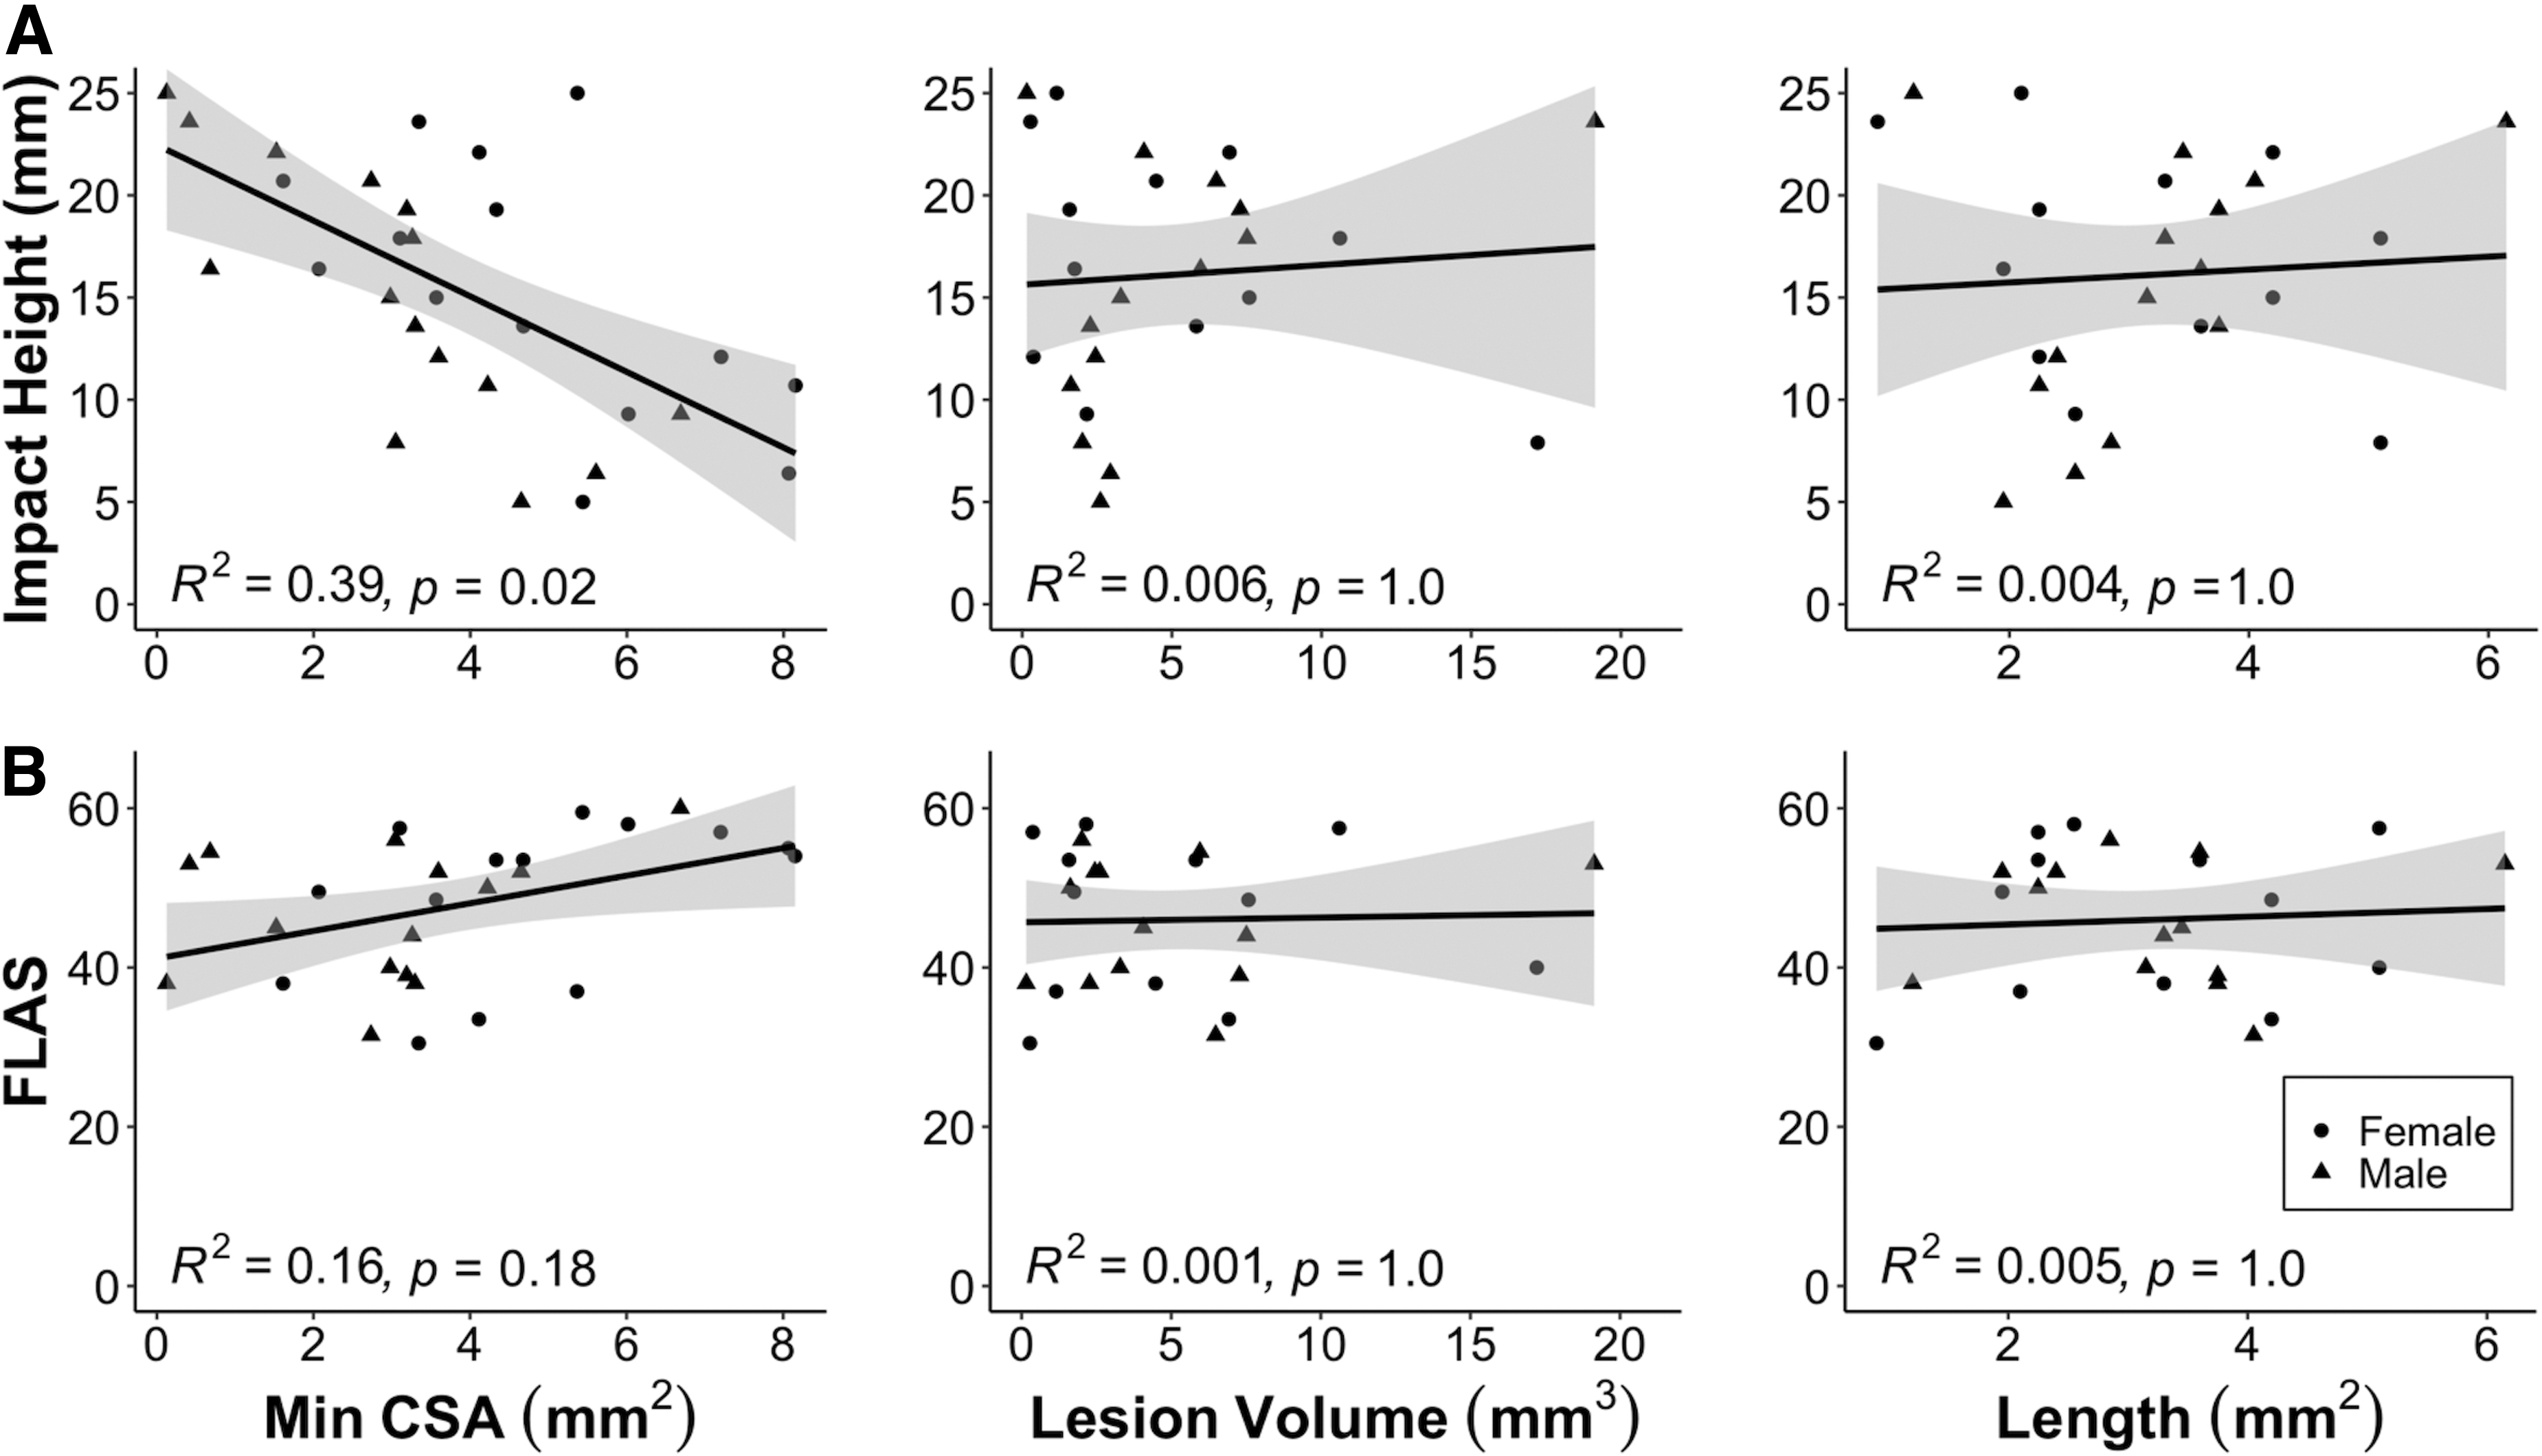
Chronic magnetic resonance imaging (MRI) metrics. Linear regression of 12-week MRI metrics (minimal cross-sectional area, lesion volume, and lesion length) and impact height
Group level comparisons for SCI and sham
To test the hypothesis that diffusion and perfusion MRI provide differential information following SCI, sham and SCI groups were compared with voxelwise t tests, covaried for injury severity. For each quantitative metric (T1 map, T2 map, SCFB, and fADC||) and time point (4 and 48 h), voxels that were significantly different between the SCI and sham groups were quantified (p < 0.05, adjusted for multiple comparisons). For sagittal images, significant volumes increased from the 4- to the 48-h time point for T1 (27.18–51.78 mm3), T2 (33.54–64.58 mm3), and fADC|| (51.48–85.61 mm3), whereas SCBF volume decreased (36.54–27.81 mm3). Comparing the spatial distribution of all significant voxels at 4 h, 35% of voxels had fADC|| changes only, 8% had SCBF changes only, and 57% had both fADC|| and SCBF changes. At 48 h, 68% had fADC|| changes only, 3% had SCBF changes only, and 29% had both fADC|| and SCBF changes. Axial T1 and T2 revealed similar patterns with increased volumes at the later time point for T1 (9.44–20.93 mm3) and T2 (24.56–37.20 mm3). However, fADC|| decreased (48.17–33.16 mm3) and SCBF increased (7.66–13.00 mm3) in volume. Changes in fADC|| were primarily localized to the white matter, and SCBF changes were primarily localized to the gray matter (Fig. 5). Comparing the spatial overlap of axial fADC|| and SCBF, significant volumes revealed an 11% overlap, 85% revealed fADC|| only, and 4% revealed SCBF only at 4 h and a 12% overlap, 68% revealed fADC|| only, and 20% revealed SCBF only at 48 h.
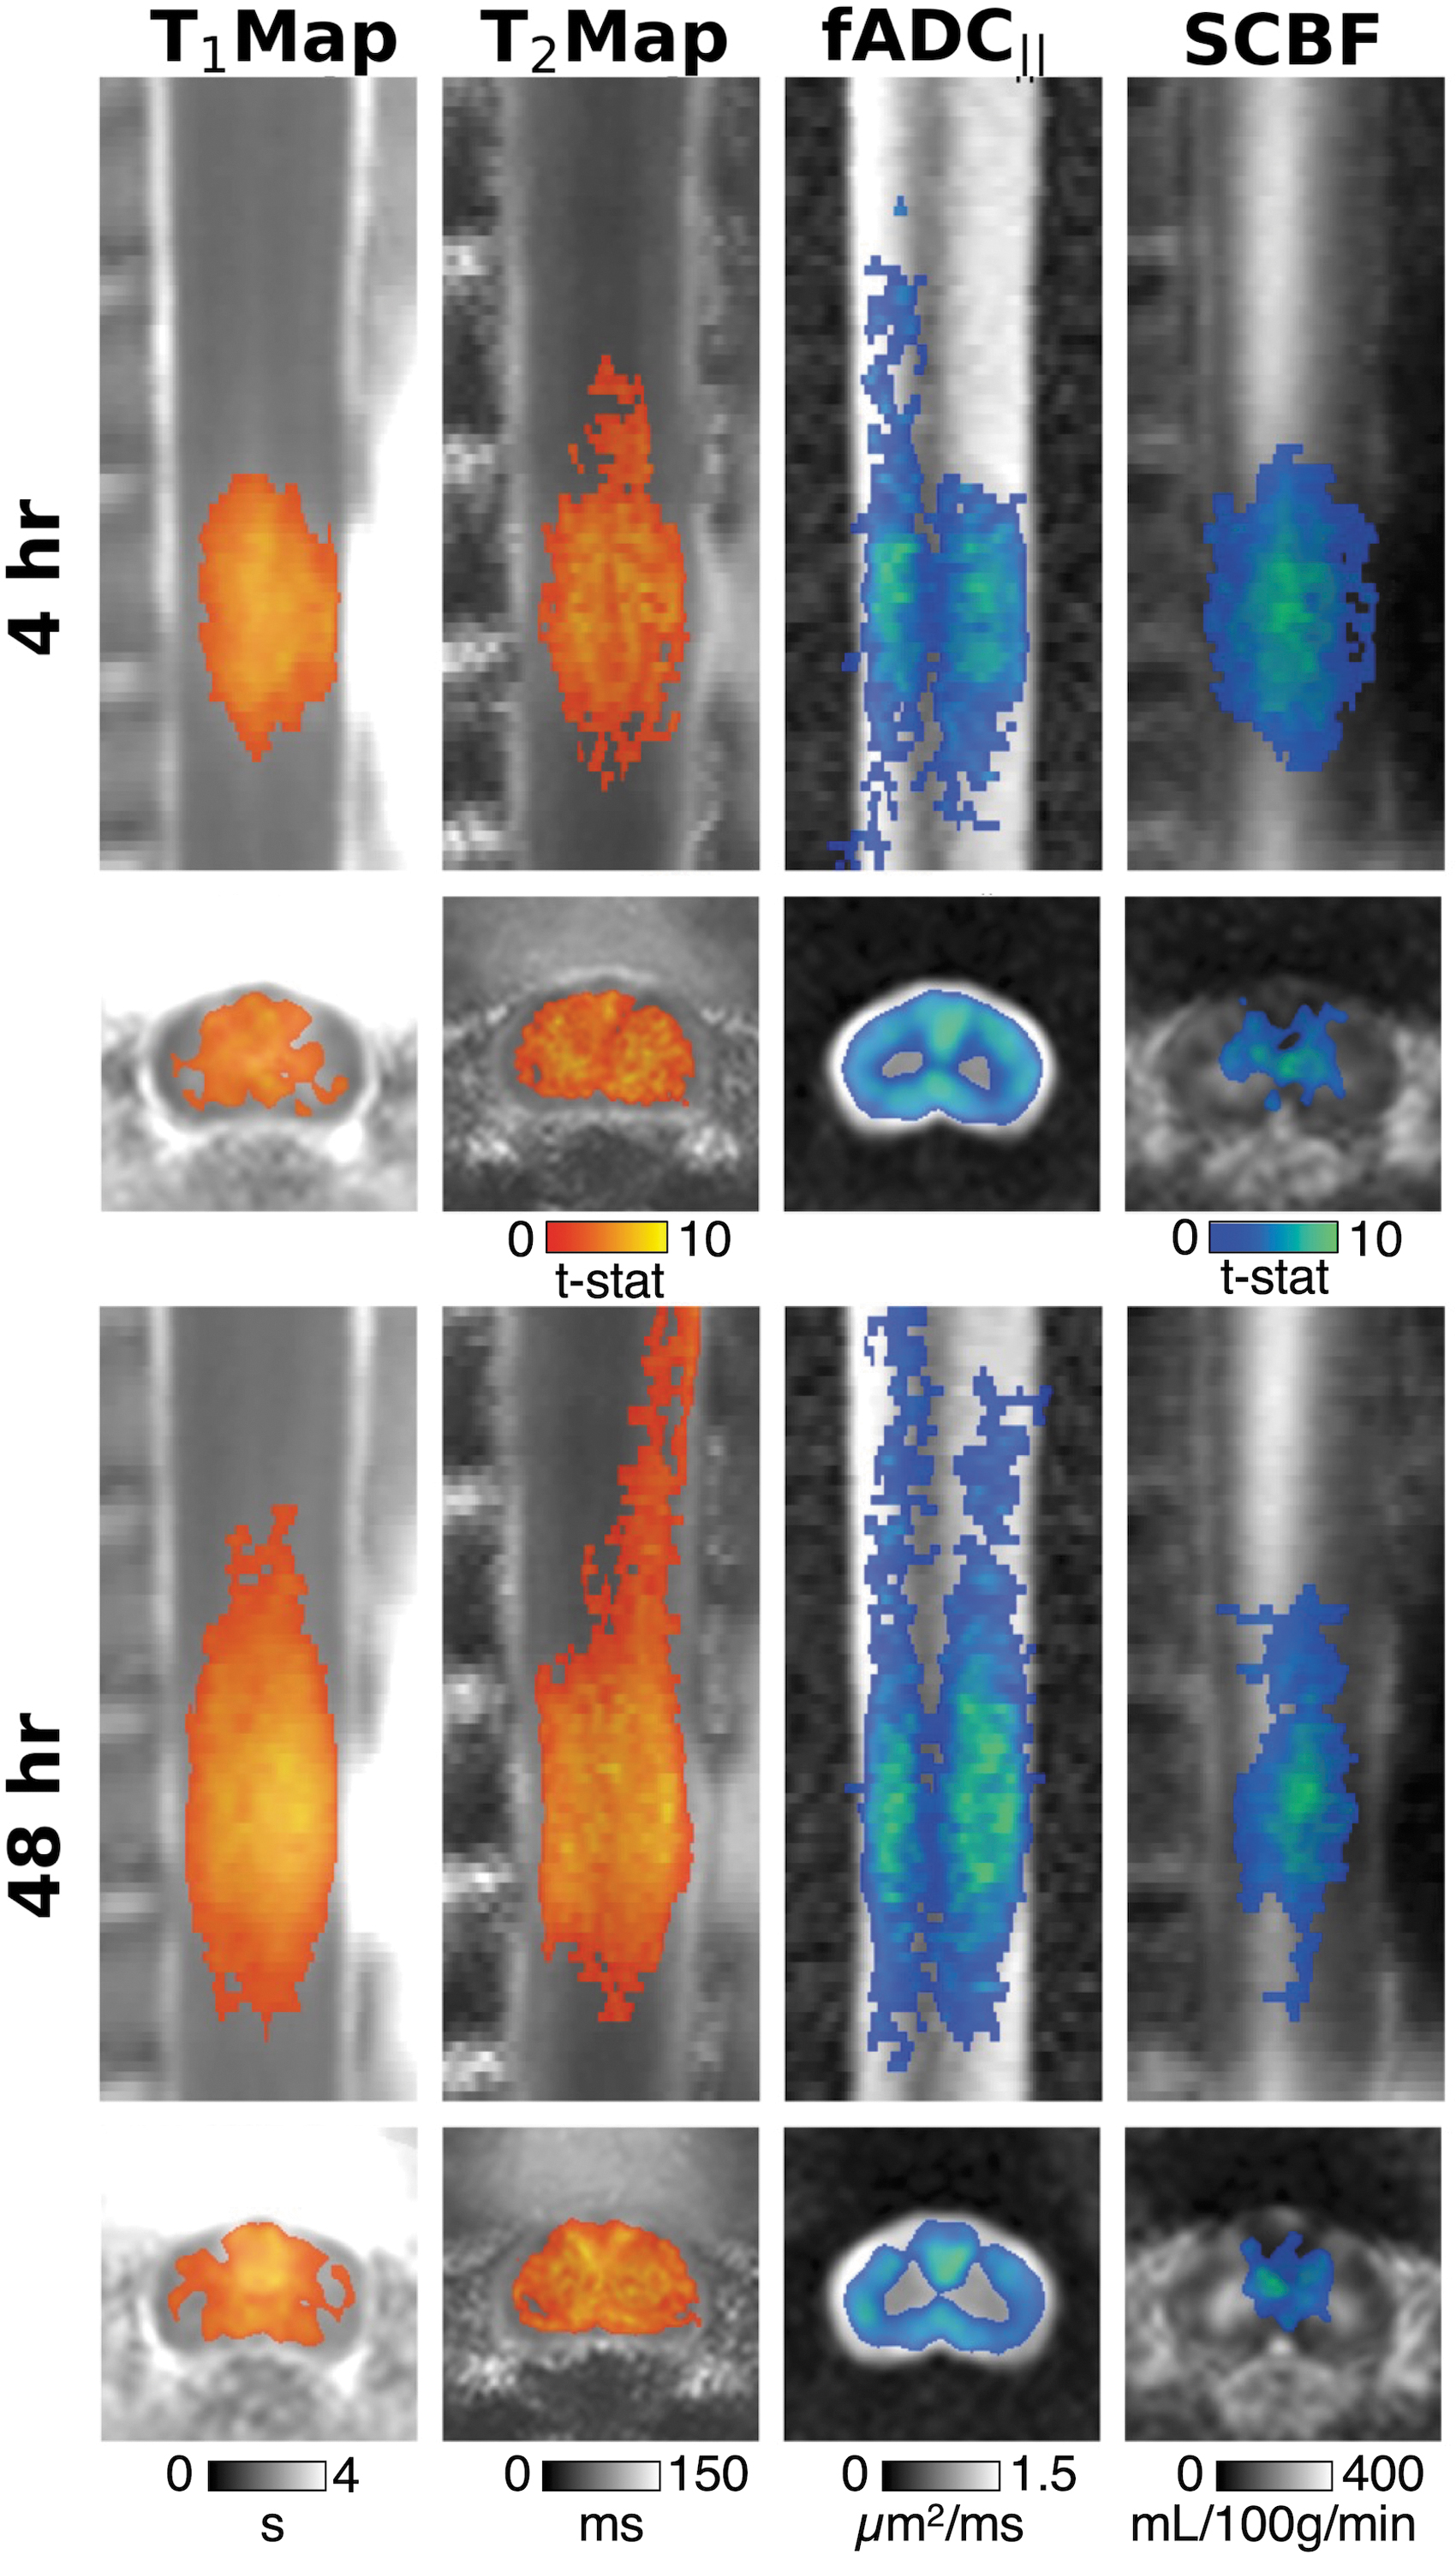
Group level comparisons. Voxelwise t test of T1,T2, filtered apparent diffusion coefficient (fADC||), and spinal cord blood flow (SCBF) at 4- and 48-h post-injury. T statistic maps are overlayed over averaged images for each metric (n = 10) on both sagittal (top) and axial (bottom) images. A single axial slice at the center of the injury site (C5) is shown. Orange color maps show regions that were significantly increased after spinal cord injury (SCI) compared with sham, and blue color maps show regions that were significantly decreased (p < 0.05, adjusted for familywise error rate).
Data-derived thresholds to define lesion masks
To simultaneously determine a threshold for acute MRI metrics that led to long-term tissue damage and to establish the sensitivity of acute MRI metrics to predict final tissue fate, a precision-recall analysis was performed using lesion borders defined on the 12-week T2 maps. All quantitative maps from the 4- and 48-h time points were converted to Z scores (Fig. 2). The AUC analysis (Fig. 6A) revealed that at the 4-h time point, T1 (0.47) was a better predictor of tissue fate than T2 (0.27), with similar values at the 48-h time point (T1: 0.48; T2: 0.28). At the same 4 h time point, fADC|| (AUC = 0.32) and SCBF (0.36) were intermediate predictors of tissue fate, and both diminished at the 4-h time point (fADC||: 0.25; SCBF: 0.31). The optimal threshold (Fig. 6B) was set as the Z score that yielded the greatest AUC across either of the time points (T1 = 3.06, T2 = 2.07, fADC|| = −2.03, SCBF = −2.23). Converting back to physical units yielded cutoff values of white matter (percent change relative to control values): T1 = 2460.55 ms (+44%), T2 = 77.98 ms (+42%), fADC|| = 0.73 μm2/ms (−39%), SCBF = 40.78 mL/100g/min (−74%); and gray matter: T1 = 2233.67 ms (+38%), T2 = 57.72 ms (+30%), fADC|| = 0.37 μm2/ms (−56%), SCBF = 111.32 mL/100g/min (−57%). The optimal thresholds were applied to individual Z score maps to obtain lesion masks, shown grouped by severity in Fig. 7. Lesion volumes for T1, T2, and fADC|| all increased from the 4- to the 48-h time points, whereas SCBF decreased (Fig. 7). AUC was higher for all metrics from sagittal acquisitions compared with the axial; therefore, only sagittal data were included for the remainder of the analysis.
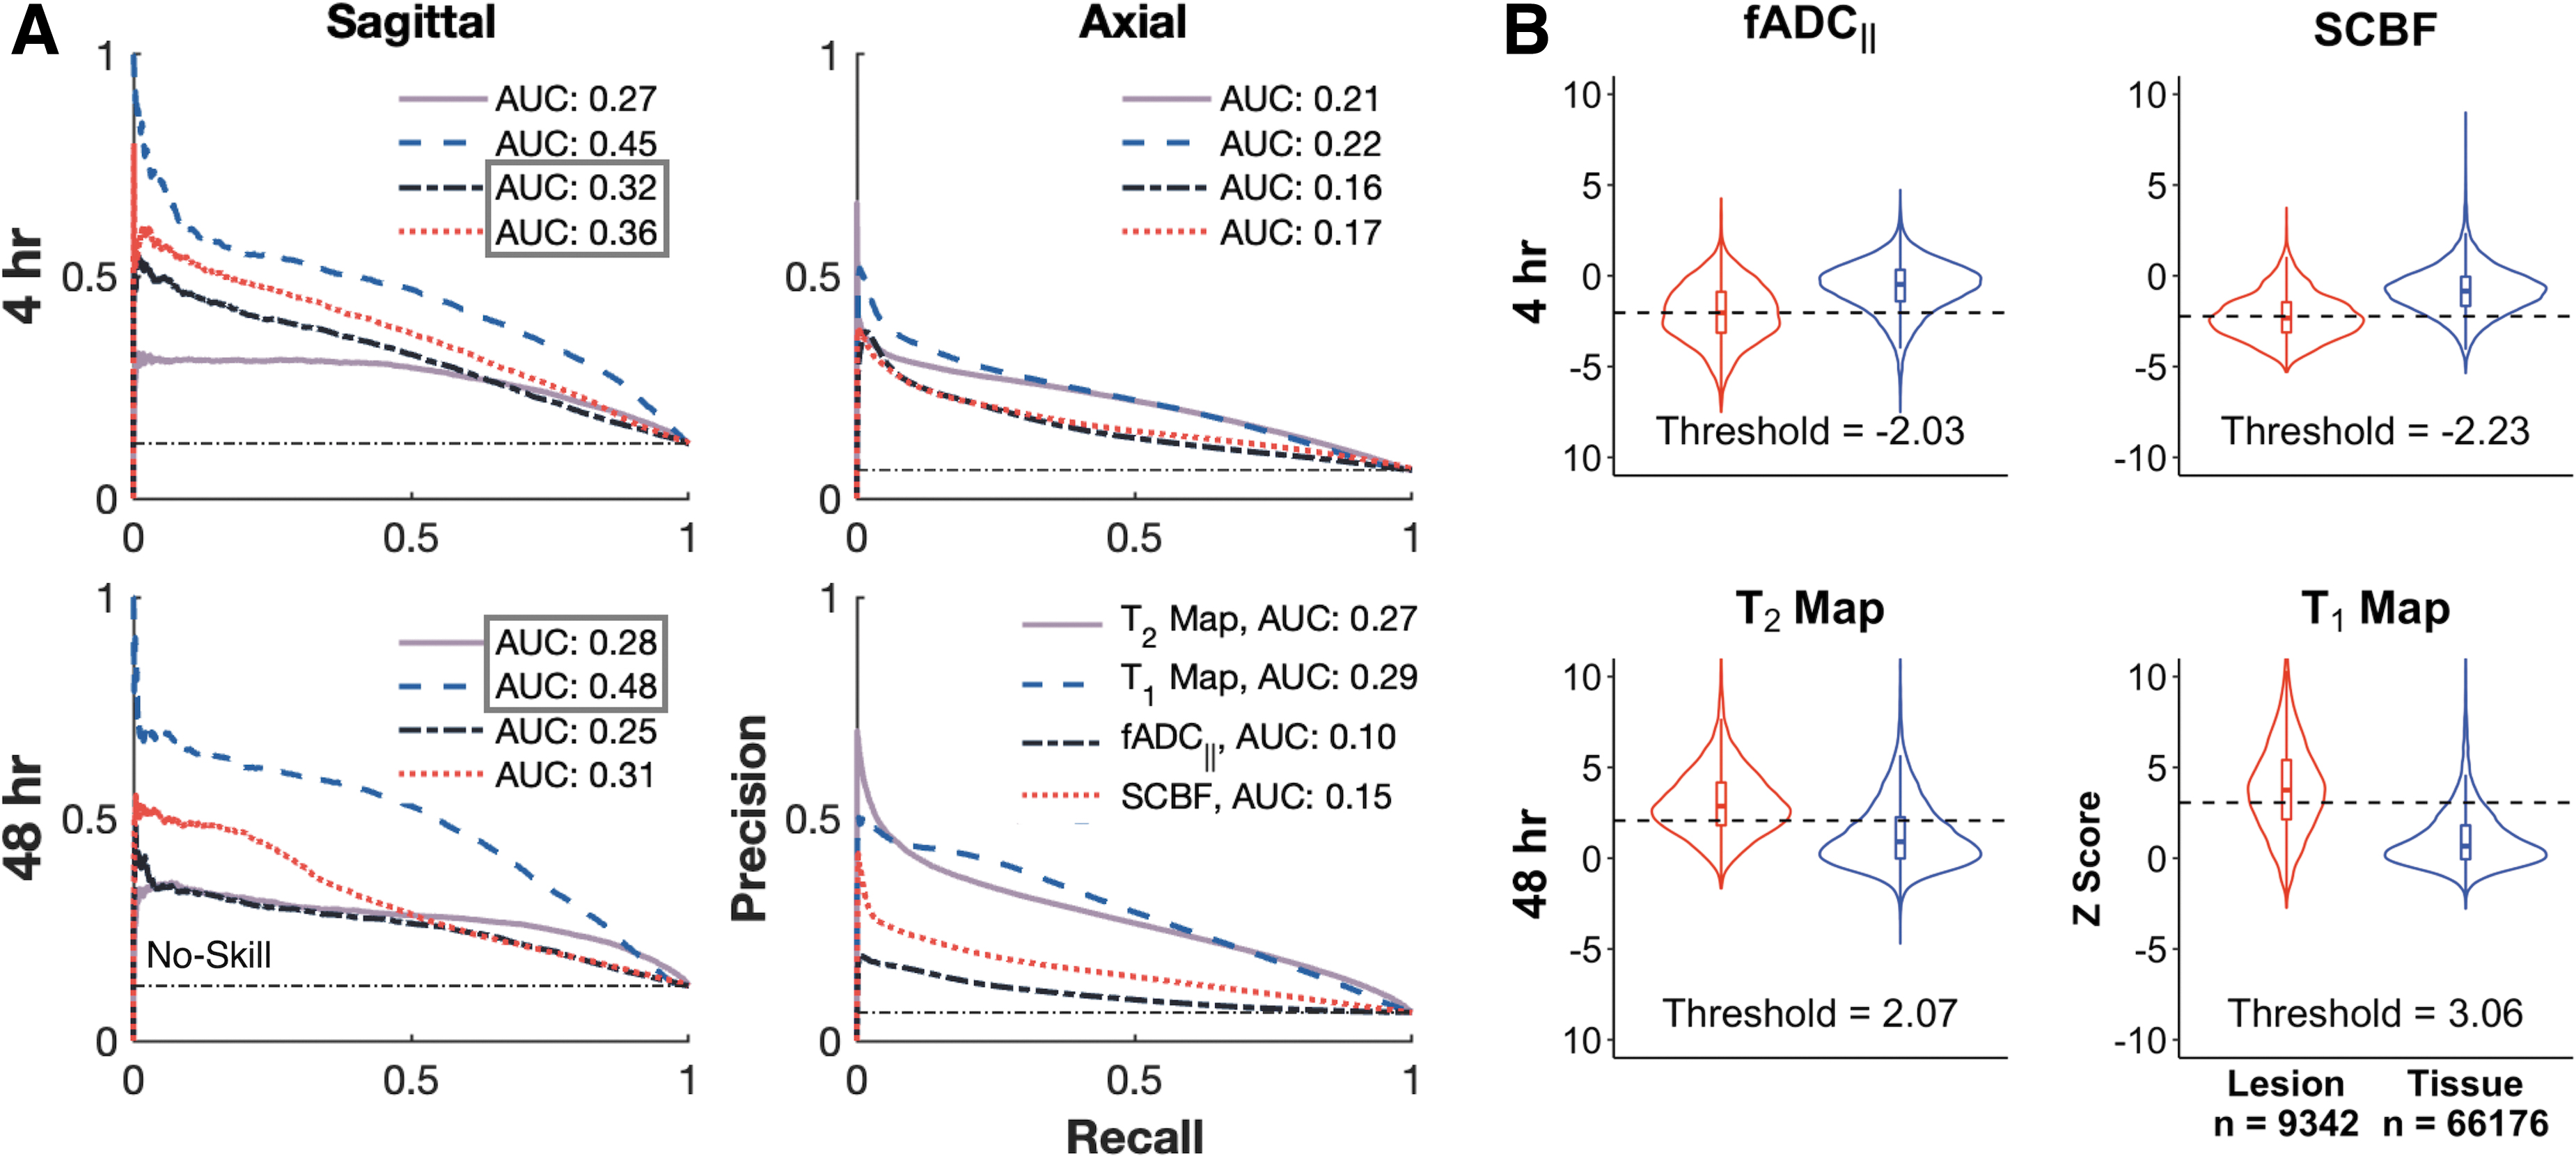
Precision-recall for optimal thresholds of acute metrics.
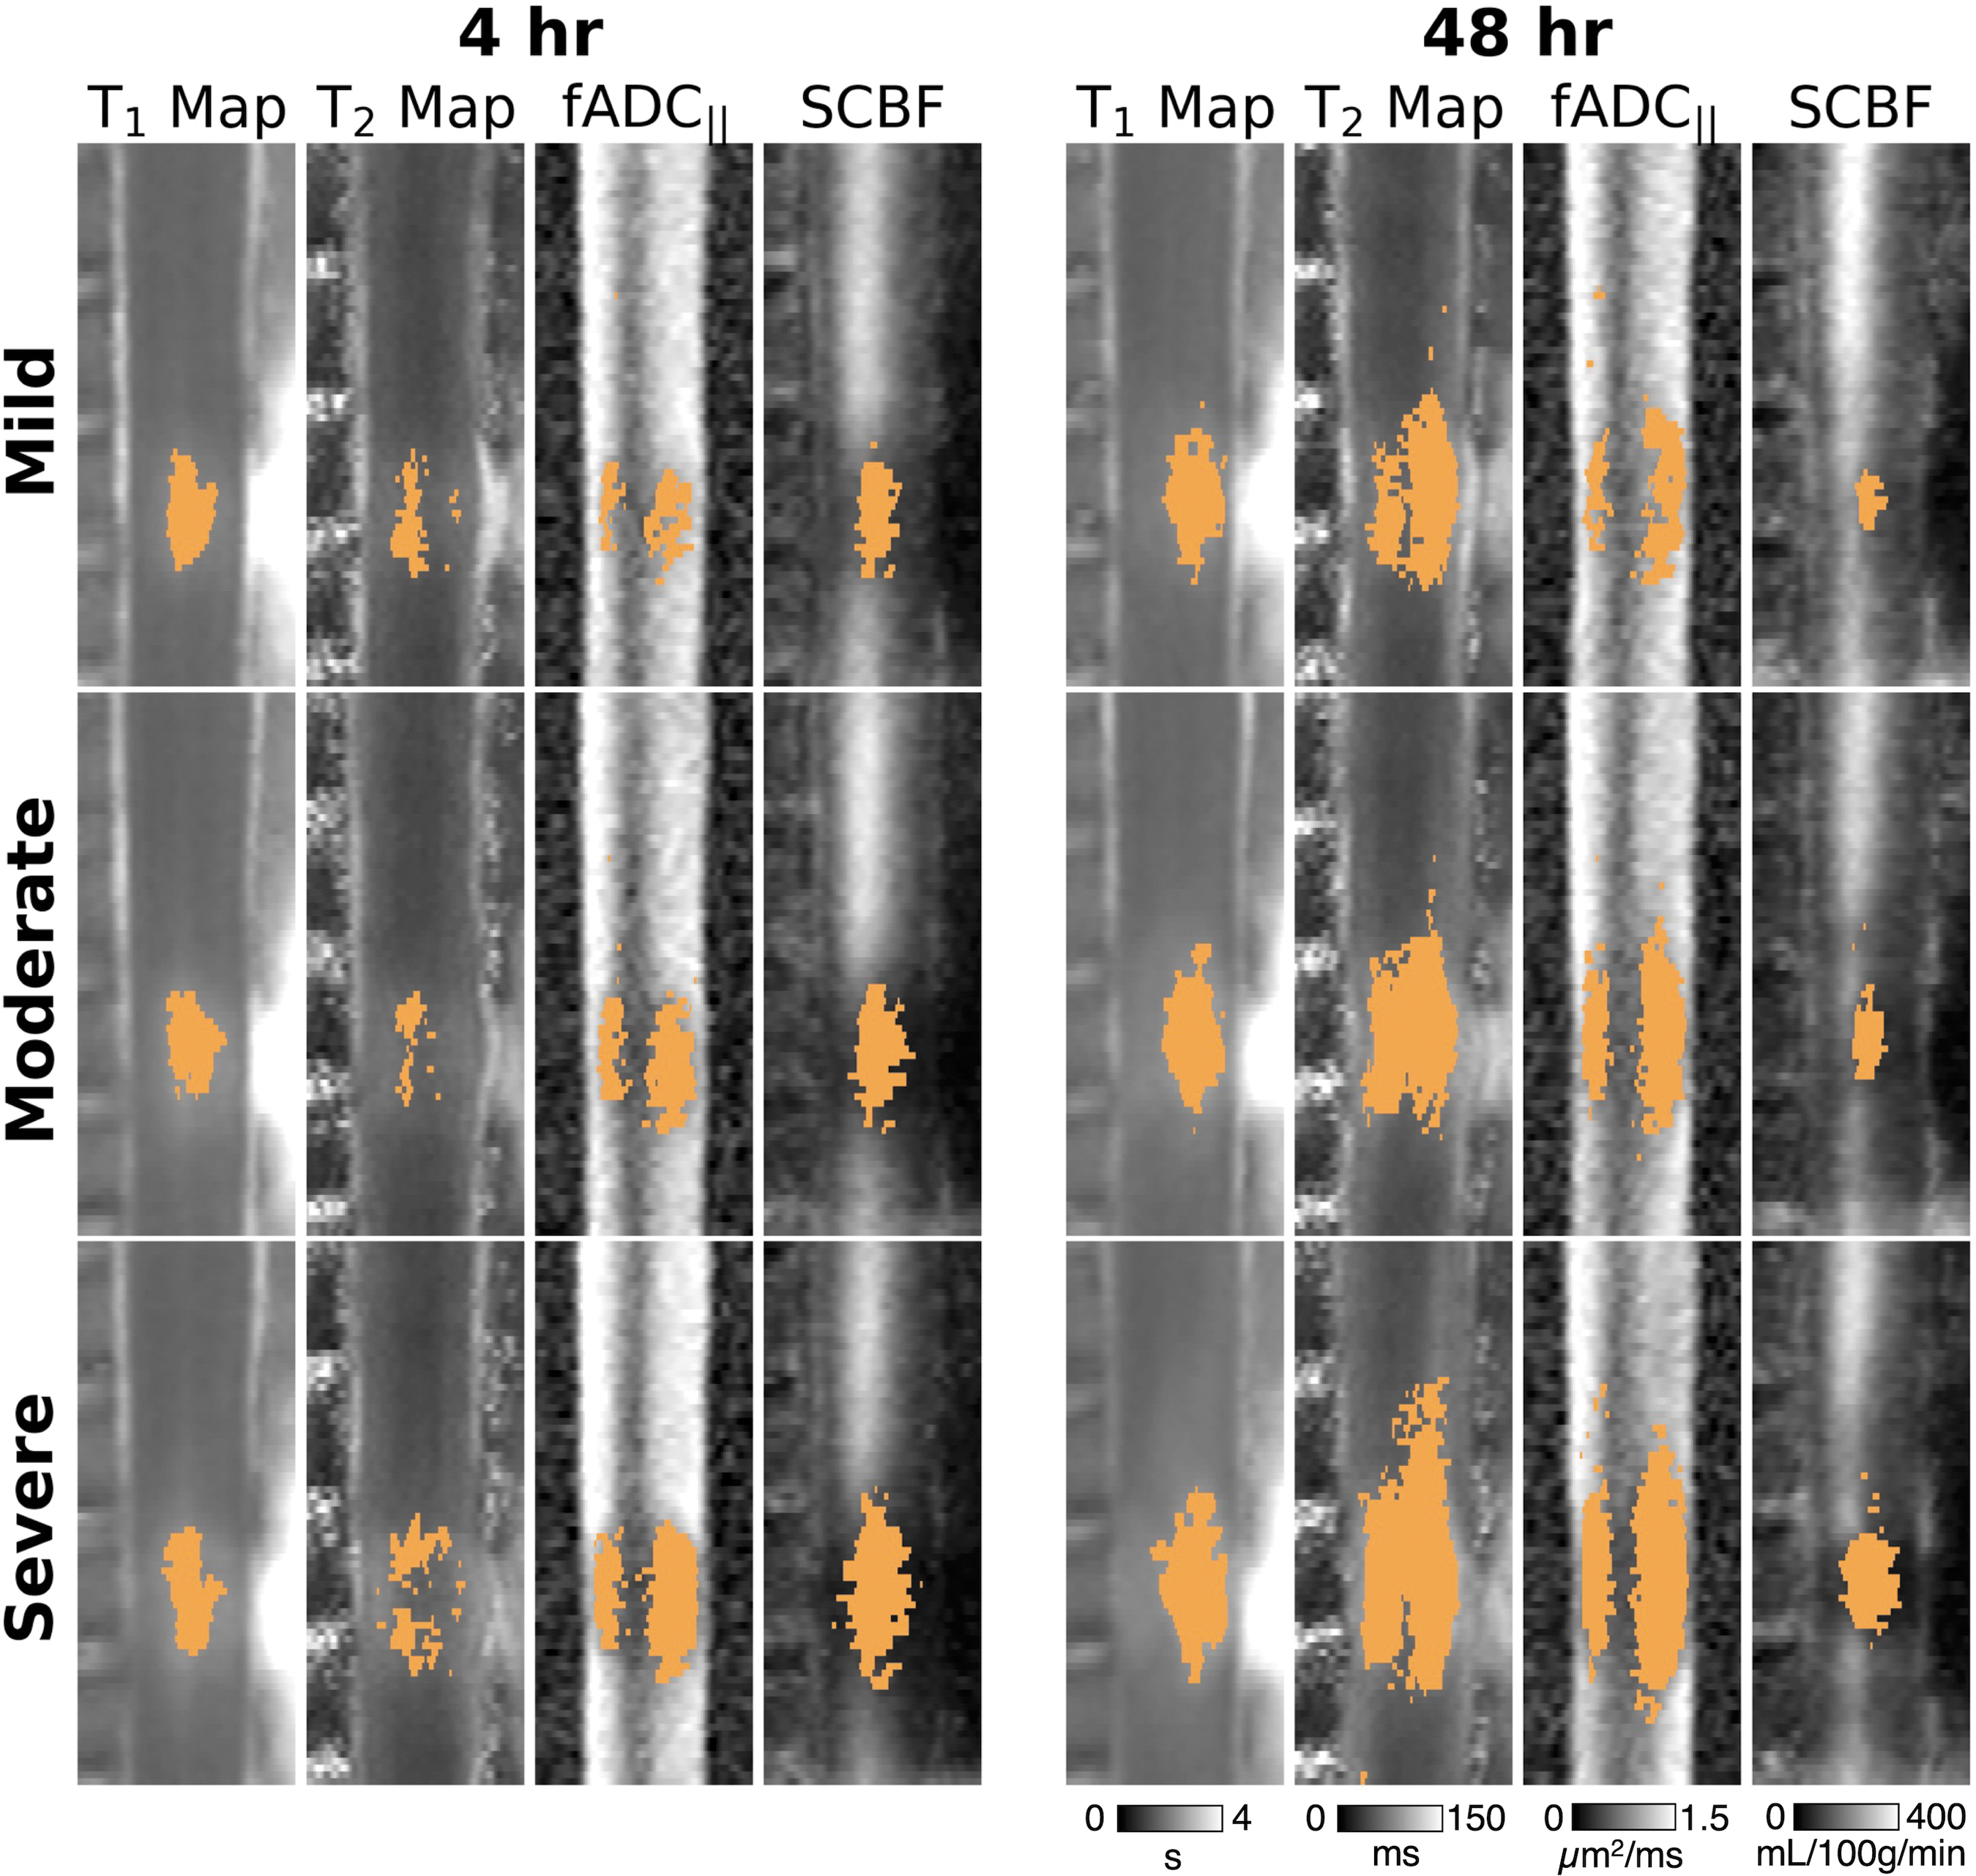
Lesion masks of each acute metric. Binary lesion masks defined by data-derived optimal thresholds are overlayed on registered quantitative metrics (T1 map, T2 map, filtered apparent diffusion coefficient [fADC||], and spinal cord blood flow [SCBF]) averaged for visualization purposes into sham (n = 9), mild (n = 10), moderate (n = 10), and severe (n = 10). At the 48-h time point, lesion volumes increased in size for the T1 map, T2 map, and fADC||, but decreased for SCBF.
Acute advanced MRI metrics predicted long-term functional outcome
To determine the degree to which each of the acute MRI metrics individually predicted long-term functional outcomes, data-derived acute lesion masks were related to the 12-week FLAS score, the behavioral test the most strongly associated with impact height (Fig. 8). At 4 h, the volume of the SCBF deficit (R 2 = 0.56, p adj < 0.01) was significantly correlated with long-term locomotor function, with T1 (R 2 = 0.27, p adj < 0.01), T2 (R 2 = 0.11, p adj < 0.01), and fADC|| (R 2 = 0.30, p adj < 0.01) being less predictive. At 48 h, SCBF (R 2 = 0.41, p adj < 0.01) and fADC|| (R 2 = 0.42, p adj < 0.01) became less associated with outcome, whereas T1 (R 2 = 0.39, p adj < 0.01) and T2 (R 2 = 0.41, p adj < 0.01) defined lesions became more closely related to functional outcome.
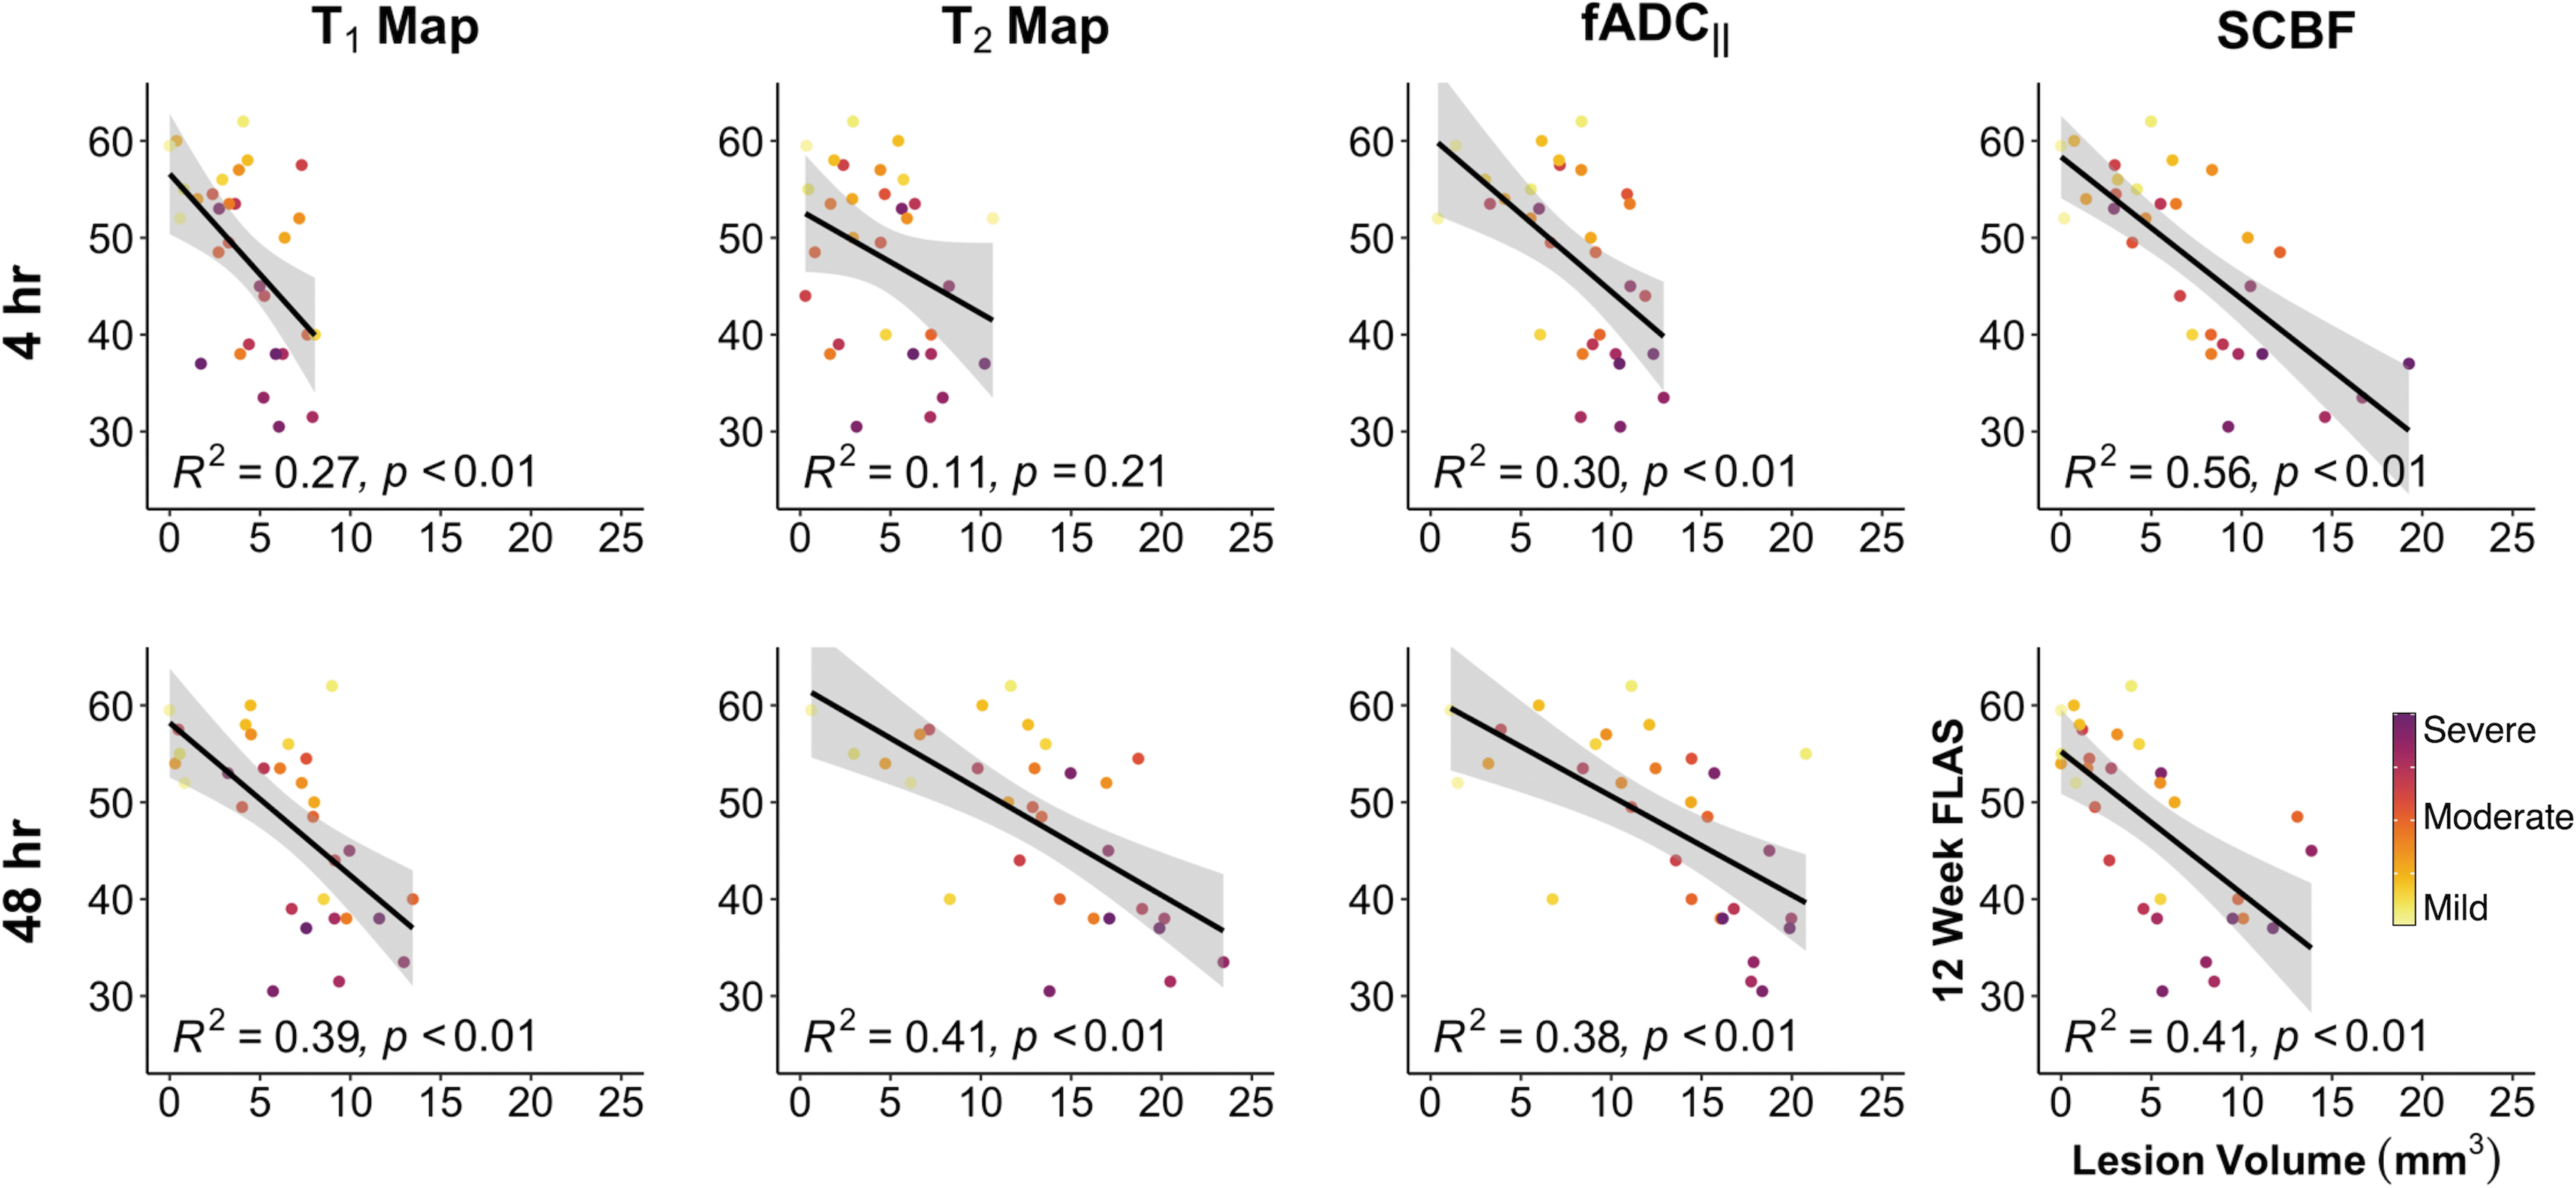
Acute magnetic resonance imaging (MRI) predicts long-term functional outcome. Simple linear regressions for each time point and acute quantitative metric model the relationship between 12-week forelimb locomotor assessment scale (FLAS) scores – a measure of long-term functional outcome – and the lesion volume from the data-derived lesion masks. T1 and T2 maps and filtered apparent diffusion coefficient (fADC||) lesion volumes are better predictors at the 48-h time point, whereas spinal cord blood flow (SCBF) is the most predictive at the 4-h time point.
Discussion
Conventional MRI is central to the diagnosis of SCI, and quantitative metrics have been advocated to improve prognosis and the understanding of pathological changes. The work presented builds on technical advancements in perfusion and diffusion MRI in a rodent cervical spinal cord contusion model to provide unique information about the physiological and structural injury characteristics in the acute and subacute settings. Importantly, both perfusion and diffusion were predictive of long-term functional outcome, yet provided unique spatial and temporal information.
Current clinical guidelines advocate for blood pressure management in the acute SCI phase with the explicit notion that hypoperfusion will reduce blood flow and perfusion in the damaged spinal cord. 1,29,30 Decreased spinal cord perfusion pressure is associated with decreased tissue oxygenation 31 and worse outcomes; 32,33 however, it is challenging to disentangle the effects of injury severity and pathophysiological changes in observational human studies. Moreover, perfusion of the spinal cord is still difficult to monitor given the lack of non-invasive or even minimally invasive methods capable of direct measurements of perfusion in the spinal cord itself. In our study, SCBF was decreased at 4 h, and, unlike diffusion or T1 and T2, it partially recovered by 48 h. The mechanism of recovery could be related to many different factors, including reduction of swelling or resolution of neurogenic shock. Although angiogenesis occurs after SCI, it is most dynamic between 3 and 7 days, 34 –36 and is unlikely to be responsible for the changes at 48 h. T1 and T2 maps were better predictors of functional outcome at 48 h than at 4 h. At the later time point, the area of hyperintensity had increased in both contrasts, most likely because of expansion of edema.
A diffusion metric sensitive to axonal injury (fADC||) had the largest volume at 4 h and increased in volume at 48 h. Unlike diffusion tensor imaging (DTI), fADC|| is sensitized to focal varicosities (i.e., beading) that emerge on acutely injured axons 37 because the confounding edema is minimized. 7,38 The changes in fADC|| are consistent with the hypothesis that axonal damage expands in the acute period after SCI 39 and with prior data predicting neurological outcomes in animals. 9 In human studies, 40 fADC|| demonstrated unique contrast and information in acute SCI compared with DTI, and it remains to be seen if it predicts neurological outcomes in patients.
The concept of the penumbra—a region of hypoperfused tissue at risk for ischemic damage but that is still salvageable if reperfused—is well established in cerebral ischemia 41 –43 and has been discussed in the spinal cord literature. 44,45 The advanced diffusion and perfusion MRI in this study was well suited to demonstrate a penumbra in SCI, but irrefutable evidence of a penumbra could not be ascertained. The greater sensitivity of diffusion and perfusion MRI to white and gray matter injury, respectively, complicated a direct comparison between the two contrasts. At both time points, the fDWI lesions were more extensive than those of SCBF, but the two contrasts had high overlap at 4 h. Despite those differences, SCBF was still a better predictor of long-term functional outcome, emphasizing the importance of perfusion abnormalities in the early acute phase of SCI.
Several limitations should be addressed. The pattern of perfusion deficits evident in these results from a dorsal contusion injury model may differ from other injury models. Further, the contusion model used here inherently includes a laminectomy, which likely alleviates cord compression to an extent. Sustained compression of the spinal cord is an important consideration in human SCI, and early decompression aims to relieve intraspinal pressure and cord perfusion caused by mechanical compression. 46 Experiments in a compression pig model have shown that spinal cord blood flow is decreased during the compressed state. 47 Further application of spinal cord perfusion MRI in other injury models may be insightful. Additionally, the binary classification of 12-week T2 maps, although amenable to the precision-recall analysis and determination of optimal predictive thresholds, is limited in its ability to discriminate between healthy tissue and non-lesioned tissue that may not be functionally intact. This structure-function relationship cannot be elucidated from the available data.
Another limitation of this work – and of many perfusion MRI studies in the rodent – is the effect of anesthetics. Isoflurane is a potent vasodilator that increases the measured perfusion values in spinal cord gray matter to between 140 and 270 mL/100g/min compared with the basal values of ∼50 mL/100g/min without anesthesia, and disrupts autoregulation. 48 –50 A near complete loss of perfusion at the epicenter of injury in these results is likely the result of overt vascular damage, as shown by vascular casting studies. 51 Therefore, it appears that the vasodilatory effects of isoflurane do not restore perfusion in the directly contused tissue. Reduced perfusion is also evident adjacent to the central injury, which is because of the likely combination of vasoactive responses, swelling, and edema that impair flow. Perfusion within these regions may be increased by isoflurane, leading to an overestimation of SCBF and underestimation in the extent of the SCBF deficit. There is evidence of neuroprotective effects of isoflurane in brain-injured rats, 52 which are hypothesized to be multi-factorial, but which include attenuation of hypoperfusion. In this work, isoflurane exposure was maintained across all injury severities and sham groups. Ultimately, because SCBF was the most predicative acute metric of long-term functional outcome, the findings are encouraging for further investigation of perfusion MRI for SCI and as a tool to evaluate interventions that promote restoration of spinal cord perfusion. Choice of anesthetic will be an important consideration when designing future experiments involving interventions that rely on intact autoregulation or aim to alter perfusion in the spinal cord.
These results are foundational for future studies characterizing imaging biomarkers that move beyond diagnosis and prognosis and are capable of guiding clinical action. The non-invasive nature and clinical availability of MRI make the techniques presented here well suited for clinical translation; however, systematic optimization in human subjects will be required to address labeling strategies, magnetic field inhomogeneities, and motion artifacts.
Conclusion
This is the first study directly comparing perfusion MRI (pCASL) with other imaging metrics including T1, T2, and fDWI following traumatic SCI. These results confirm the unique spatiotemporal dynamics of spinal cord perfusion compared with measures of edema and axonal damage and are supportive of multi-model MRI for biomarkers that represent differing physiological and structural abnormalities following SCI. Future analysis will continue to interrogate the value of these advanced MRI contrasts in predicting functional outcomes, as well as their ability to guide and monitor interventions in this pre-clinical model.
Footnotes
Acknowledgments
We thank Matt Runquist and Qian Yin for MRI assistance; Chloe Koeppen, Austin Dotson, and William Eastham for assistance with experiments; and Drs. Kathleen Schmainda, Andrew Nencka, and Guillaume Duhamel for their insights.
Authors' Contributions
B.P.M. was responsible for conceptualization, methodology, software, validation, investigating, formal analysis, writing – original draft, and visualization. S.Y.L. was responsible for conceptualization, methodology, and writing – review and editing. S.N.K. was responsible for conceptualization, writing – review and editing, and supervision. M.D.B. was responsible for conceptualization, methodology, software, writing – review and editing, supervision, and funding acquisition.
Transparency,Rigor,and Reproducibility Summary
The study design and analysis plan were pre-registered with the Open Science Framework Preregister (
Funding Information
This work is supported by grants from the National Institute of Neurological Disorders and Stroke (R01NS109090) and the Office of the Assistant Secretary of Defense for Health Affairs through the Spinal Cord Injury Research Program (W81XWH-20-1-0413) to M.D.B. The content is solely the responsibility of the authors and does not necessarily represent the official views of the National Institutes of Health. Opinions, interpretations, conclusions, and recommendations are those of the authors and are not necessarily endorsed by the Department of Defense.
Author Disclosure Statement
No competing financial interests exist.