
Abstract
Concussions can impact cognitive processes necessary for driving. Young adults, a group who are more likely to engage in risky behaviors, have limited driving experience and a higher rate of motor vehicle collisions; they may be at higher risk for driving impairment after concussion. There are no clear guidelines for return-to-driving following a concussion. We sought to examine the simulated driving performance of young drivers after receiving medical care following a concussion, compared with a similar control population, to examine the association of driving performance with performance on neuropsychological tests. We evaluated 47 drivers, 16- to 25-year-old, within 3 weeks of sustaining a concussion and 50 drivers with similar characteristics who had not sustained concussions. Participants completed demographic questionnaires, the Sport Concussion Assessment Tool-5 (SCAT-5), and a brief set of neurocognitive tests, including the National Institutes of Health (NIH) Toolbox Cognition Battery and the Trail Making Test, and a simulated driving assessment. At various times during simulated driving, participants were asked to respond to tactile stimuli using the tactile detection response task (TDRT), a validated method of testing cognitive load during simulated driving. The concussion group reported significantly higher symptoms on the SCAT-5 than the comparison group. Performance on crystallized neurocognitive skills was similar between groups. Performance on fluid neurocognitive skills was significantly lower in the concussion than comparison group, although scores were in the normal range for both groups. Simulated driving was similar between groups, although there was a small but significant difference in variation in speed as well as TDRT miss rate, with worse performance by the concussion group. Symptom report on the SCAT-5 was significantly associated with TDRT miss rate. In addition, neurocognitive test scores significantly predicted TDRT reaction time and miss count with medium to large effect sizes. Results suggest that neurocognitive screening may be a useful tool for predicting capacity to return to drive. However, further research is needed to determine guidelines for how neuropsychological tests can be used to make return to driving recommendations and to evaluate effects of concussion on real world driving.
Introduction
Concussion may influence cognitive processes necessary for safe driving, including processing speed, attention, concentration, memory, executive function, balance, cognitive integration, and hazard perception. 1 –4 The neurocognitive impact of injury is likely greater for young drivers, who have the highest age-adjusted risk of motor vehicle crashes and fatalities per mile traveled. 5 Driving is a learned process with cognitive and environmental risk modifiers. The deleterious impact of concussion on attention and cognitive processing needed to perform many driving tasks may be compounded for young drivers who depend on cognitive control for tasks that have become automatic for the experienced driver. Young drivers, therefore, are uniquely sensitive to cognitive load. Most crashes are preventable through the reduction of known risk factors such as distraction, impairment, aggressive driving, restrictions on passengers, and decisions about driving in risky environmental conditions (e.g., nighttime driving). 6 Adolescent and young adult drivers do not always engage in these risk-reducing behaviors due to their relative lack of driving experience and cognitive immaturity. 7
While the Centers for Disease Control and Prevention advocates that individuals should be assessed for their ability to drive after concussion and other traumatic brain injury (TBI), 8 there are no clear guidelines for conducting a driving assessment or practical tools to be used in a clinician's office 9 or regarding driving. 10 -12 Many healthcare providers do not address driving after TBI 11,13,14 and young drivers often return to driving even when they are still experiencing symptoms and are not cleared to return to sports or other activities. 15 -17 There is a need for valid guidelines and tools to support post-injury screening and patient consultations related to driving post-injury.
We sought to examine the simulated driving performance of young drivers following a concussion, compared with a similar control population, to examine the association of driving performance with performance on neuropsychological tests. We hypothesized: Simulated driving performance will be poorer for individuals with a concussion compared with control participants. Simulated driving performance will be more impaired when undertaking driving tasks with greater cognitive load. The decrement in simulated driving performance will be associated with lower neuropsychological function.
Methods
The study was approved by the University of Washington Institutional Review Board. All participants provided informed consent, and parents provided consent for the participants under the age of 18 years. Participants received $25 for completing baseline surveys and $75 for completing the driving simulation.
Drivers with concussion
Participants were eligible if they were 16 to 25 years of age, had a valid driver's license, had regular access to a passenger vehicle, regularly drove at least twice per week, and had been diagnosed with a concussion by a health care provider within 1 week of being contacted by study personnel. We enrolled participants who could read and write in English in order to complete the testing protocol and driving tasks. Individuals with TBI who had neurologic abnormalities on imaging, prior moderate-severe TBI, or other neurological disorders such as seizures were excluded. Concussed participants were recruited by screening emergency department logs at the three University of Washington hospitals (University of Washington Medical Center, Harborview Medical Center, and Valley Medical Center) and outpatient visits to concussion specialty clinics between November 14, 2019, and February 4, 2022. Potentially eligible patients were contacted by letter, phone and text, the study was explained to them, and consented participants were brought to the driving lab for assessment. The study coordinator explained the study and obtained informed consent. Participants were invited to the driving lab for assessment within 2-3 weeks of the concussion event.
Comparison participants
Participants were eligible for the comparison group if they were 16 to 25 years of age, had a valid driver's license, had a smart phone, had regular access to a passenger vehicle and regularly drove at least twice per week, and could read and write in English in order to complete test instruments and driving tasks. Comparison participants were recruited through word of mouth by patients with concussion and were also recruited through advertisements on the University of Washington campus. They were frequency matched to concussed participants on age, sex, and years of education.
Baseline surveys
Baseline demographics, socio-economic data, and health risk behaviors were collected for each participant at the baseline visit. We used neurocognitive measures from the Common Data Elements toolkit. 18 We also asked if they have ever been diagnosed with attention-deficit/hyperactivity disorder (ADHD), depression, or anxiety by a physician or psychologist, and whether they have ever taken medication for these conditions.
Core driving factors
We collected baseline measures from all participants to examine outcome measures and participant risk characteristics. Driving experience was measured by years since full licensure as well as number of miles driven per week in the week before injury, or the index date for the comparison group. Seat belt use was assessed using a standardized question from the Youth Risk Behavior Survey. 19
Neuropsychological assessment
Participants in both groups completed the following validated neuropsychological assessments:
NIH Toolbox Cognition Battery
The NIH Toolbox is a multi-dimensional set of brief, easy to administer measures for assessment of neurological and behavioral function of individuals 3-85 years of age. It has been normed and validated in a broad sample of the U.S. population and used in over 600 research studies, including studies on traumatic brain injury. 20 -22 Available measures include assessment of motor, emotional, sensory, and cognitive function. This study utilized the cognition battery, 23 which can be administered via tablet and requires minimal examiner training. The cognition battery consists of the following core subtests designed to assess executive function, memory, and language: 1) picture vocabulary; 2) oral reading recognition; 3) Flanker inhibitory control and attention; 4) dimensional change card sort; 5) list sorting working memory; 6) picture sequence memory; and 7) pattern comparison. Participants also completed the oral symbol digit test, which is a supplemental subtest designed to assess cognitive processing speed. The language tests, which make up a Crystallized Composite, 24 can be used as a proxy for educational attainment, intellectual functioning, and pre-morbid functioning. 23 The other subtests, which make up a Fluid Composite, assess executive function and memory, skills important for driving, 25 –28 which may be impacted in the acute phase following concussion. The NIH Toolbox Cognition Battery subtests have strong psychometric properties including test–retest reliability, convergent validity, and discriminant validity in children 29 and adults. 23
Trail Making Test (TMT)
The TMT is a measure of attention, processing speed, and mental flexibility. Part A assesses visual attention, scanning, numeric sequencing, and visual-motor speed. Part B assesses divided attention, mental flexibility, and ability to inhibit competing stimuli. TMT is highly sensitive to effects of brain injury. 30 It has been used extensively in the driving research with consistent relationships found between performance on TMT Part B and driving performance. 31
The Sport Concussion Assessment Tool-5 (SCAT-5)
The SCAT-5 is a standardized tool developed by the Concussion in Sport Group to assist in assessment of sports-related concussion. 32 The SCAT-5 concussion symptoms checklist is commonly administered in clinical settings as a self-report measure to patients by physicians and other healthcare professionals. It consists of 22 questions on symptoms such as headache, dizziness, and difficulty remembering; the severity of each symptom is scored on a scale from 1 (none) to 6 (severe).
Simulated driving assessment
We used a fixed-base driving simulator (National Advanced Driving Simulator - mMiniSim). This simulator has three 48″ monitors (Sony displays, 1920 × 1080 resolution) that were placed approximately 2 m from the driver's eye point. It consists of an actual vehicle steering wheel, brake pedals, and accelerator pedals. The steering wheel has a semi-active controller that is driven by a DC motor and microcontroller. The steering column has a functional turn signal indicator, and the accelerator pedal is a commercial drive-by-wire pedal identical to those used in on-road vehicles. The brake and the accelerator pedals are designed to provide a realistic feel. The accelerator pedal force is approximately linear to the displacement response. Similar to a normal pedal, the brake pedal force is non-linear to the displacement response. The simulator also has a 7″ touchscreen display mounted to the right of the steering wheel which was used for the secondary task.
Driving scenarios
Two drives were developed using the National Advanced Driving Simulator (NADS) Interactive Scenario Authoring Tool (ISAT). The first drive was based in an urban setting and the second drive based in a highway or rural setting. Using ISAT, the researchers could control the design and placement of the road scene, traffic, and weather environment and the structures and people in the environment (buildings, trees, pedestrians, bicyclists, road signs). The urban drive included a near-miss scenario towards the end of the drive. The near-miss included a second vehicle turning right at a crosswalk. The timing of this maneuver was adjusted to ensure a near-miss encounter between the vehicle and the simulator driver. In the highway/rural drive, the simulator driver was asked to follow a lead vehicle, without overtaking it at any point during the drive.
Simulated driving performance measures
We used simulator driving tasks developed by the investigators for use in prior studies for individuals with TBI. 33 –36 As above, the simulator tasks included urban and rural driving scenarios. In the urban scenario, we examined the driver's ability to steer and brake as needed during lane changing, braking, and turning. In the rural scenario, we tested the driver's ability to maintain lane position and maintain a reasonable distance from a leading vehicle. Both scenarios included the TDRT cognitive tasks described below.
Tactile Detection Response Task (TDRT)
A validated method in testing cognitive load during simulated driving is the tactile detection response task (TDRT). 37 This task refers to the detection of a small tactile stimulus. In our study, the tactile stimulus was vibratory, delivered from a device secured to the back of the participant's left hand. During the experiment, each participant was asked to press a button in response to a tactile vibration stimulus. Response times and miss rates were measured. A valid response refers to a single response that was initiated between 100 and 2500 msec from the onset of the stimulus. A miss refers to the invalid response or no response after the stimulus onset and miss rate is the ratio of the number of misses to the total number of stimuli for a data segment. One study found that TDRT testing may be most sensitive to the attentional effects on cognitive loads. 38 A 2015 study of simulated and on-road driving also found the TDRT to be a sensitive and reliable method of testing the effects of a secondary task on driver attention and cognitive load. 39
Texting-based secondary task
During the rural drive, participants were asked to engage in a texting-based secondary task alongside the driving and TDRT task. This task required each participant to type in a word that appeared on the touchscreen next to the steering wheel. The words appeared on the touchscreen with a “ping” sound and when the participant clicked on “Submit” the next word would appear. Between submitting the answer and appearance of the next word on the touch screen, there was a delay of between 1 to 2 sec.
Simulator and TDRT data processing
Each simulator drive generated a Data Acquisition File (DAQ), which contained the vehicle kinematics-related information. This file was generated by the NADS mMiniSim software and was converted into a comma separated time-series file format using Python 3.8. There were two DAQ files for each participant for the baseline visit, (s) processed into comma separated file format. Variables extracted from the DAQ files include: vehicle distance; accelerator pedal position; vehicle acceleration; brake pedal position; steering wheel angle; deviation from the center of the lane; following distance; vehicle position (x, y, and z coordinates); location of environment factors such as pedestrian and bicyclists; and collision with a vehicle during the drive. All variables were sampled at a rate of 60 Hz (60 times each sec) and included the timestamp. TDRT data was generated in comma separated file format and consisted of the timestamps for each click, each miss, and the calculated response time. TDRT data was merged with the simulated driving data, based on the timestamps.
Statistical analysis
Analyses were completed using SAS Software Version 9.4 (SAS Institute Inc., Cary, NC) and R (Foundation for Statistical Computing, Vienna, Australia).
Demographic characteristics, baseline symptoms and driving behaviors of concussed and comparison participants were described using means and frequencies. Neurocognitive test performance between drivers with concussion and comparison drivers was compared using independent samples t-tests.
To determine if concussed and comparison participants had different performance in simulating driving, regressions were separately examined for urban and rural drives. As shown in Table 1, age, gender, race, ethnicity, proportion working and/or in school, past history of motor vehicle collision, number and severity of concussion-related symptoms, and prior citations or warnings were compared to determine whether they significantly differed between concussion and comparison groups. History of driving citations was significantly different between groups and was therefore included as a covariate. No other variables were significantly different.
Characteristics of Study Participants
SD, standard deviation.
The outcomes of interest associated with the simulating driving performance included the corrected TDRT response time (linear regression) and the TDRT miss count (Poisson regression). These outcome measures reflect driving tasks under the greatest cognitive load. For those who missed a particular TDRT stimulus, the response time was set at 2500 msec, as is standard for missing response time with TDRT. For each set of analyses, we first ran a baseline model that included participant group (concussion or comparison) and driving citations. We ran a second model that included SCAT-5 Total score in addition to the baseline variables. Finally, we ran a model that added in the following neurocognitive variables: NIH Toolbox Fluid Composite uncorrected standard score, trail making test B raw score, and oral symbol digit test raw score. These tests were selected because they measure executive functions, which are skills that can be impacted by concussion and can be associated with driving performance. Log likelihood comparisons were run for each model step. The regressions were done separately for the urban and rural drives. Finally, we ran individual post-hoc correlations between individual neurocognitive variables and TDRT outcomes to examine which neurocognitive tests were most strongly associated with driving performance.
Results
During the study period, there were 51 participants with concussion recruited to the study (Fig. 1). Four concussed patients were not able to complete the driving simulator tasks because of motion sickness (three participants were not able to complete either drive, one was able to complete the urban but not the rural drive). Of 53 potentially eligible comparison participants, 51 were recruited. One was not able to complete the driving simulator tasks.
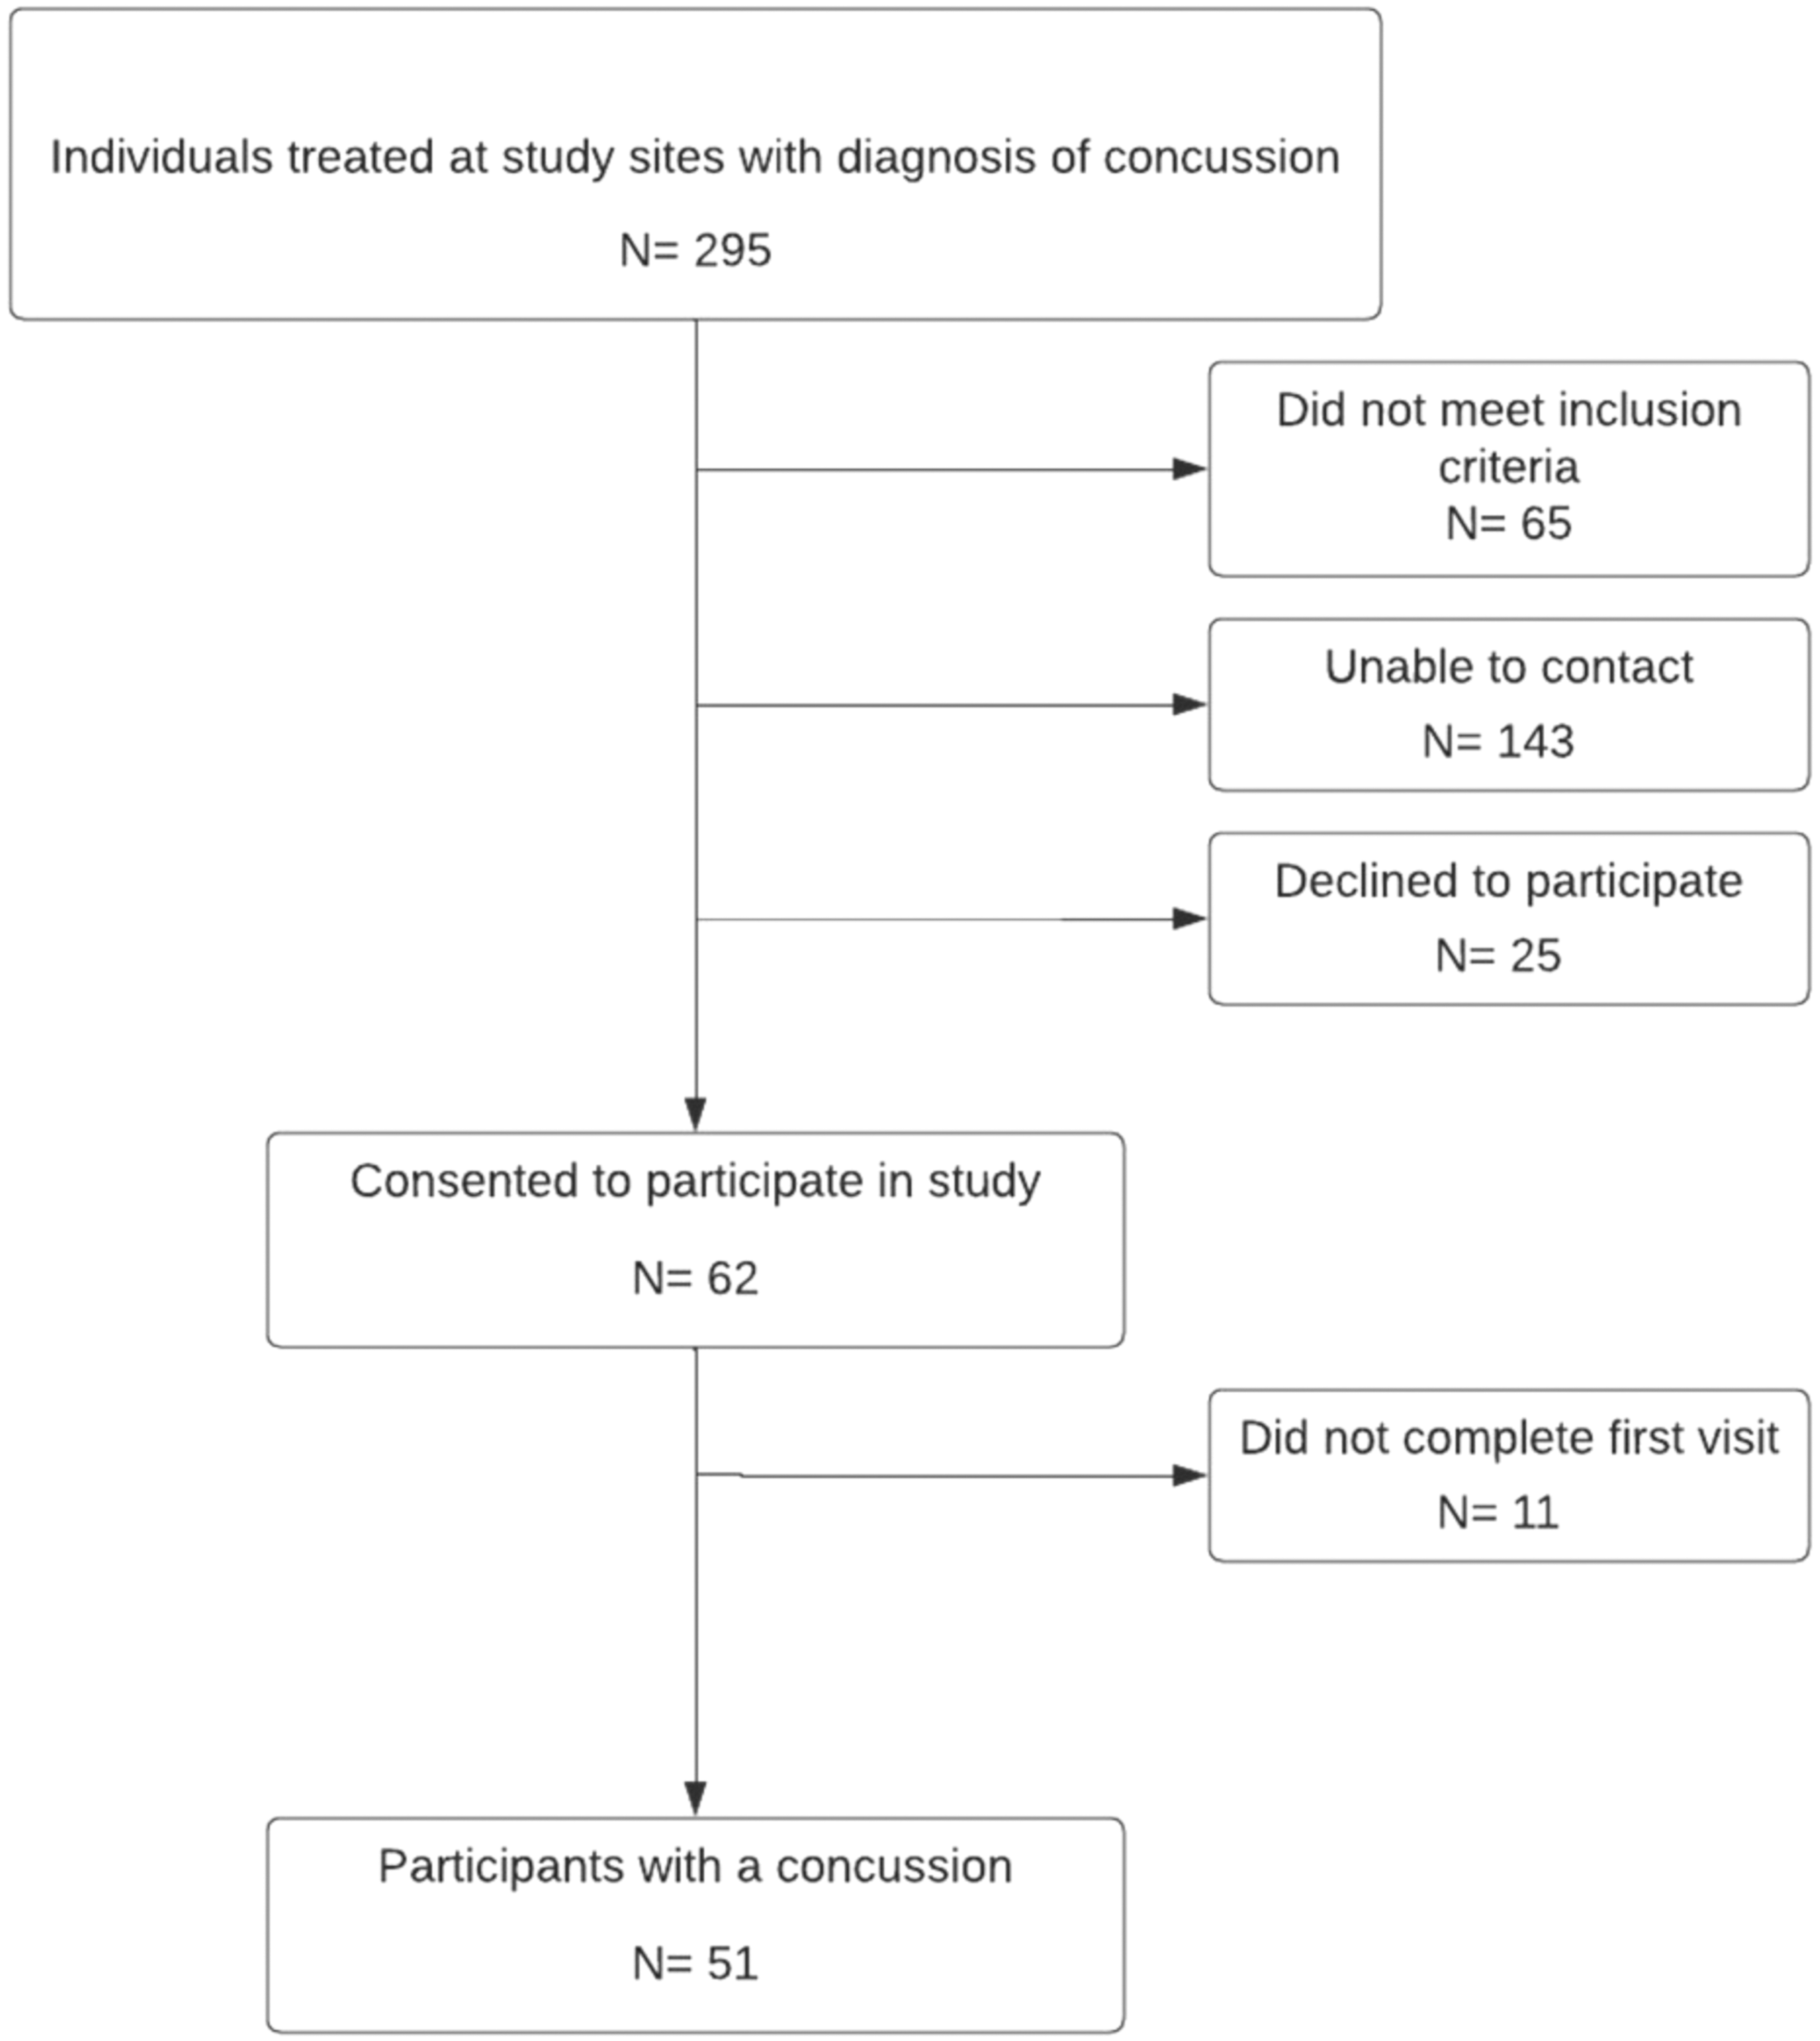
Flow diagram of study participants.
See Table 1 for participant characteristics. The majority of participants were female with a mean age of 22 years.
The concussed participants completed the surveys, NIH toolbox and driving simulation tasks a mean of 19.2 days (standard deviation [SD] 15.3 days) after injury. As expected, participants with concussion reported more symptoms (12.6 vs. 4.1; p < 0.0001) and had a higher symptom severity score (32.2 vs. 7.3; p < 0.0001) on the SCAT-5.
Concussion and comparison group performance on neurocognitive tests are shown in Table 2. Mean scores on neurocognitive tests were in the average to above average ranges for both the concussion and comparison groups. The NIH Toolbox Crystallized Composite and the two subtests that comprise it (Oral Reading and Picture Vocabulary) were very similar between groups. The Fluid Reasoning Composite was significantly lower for the concussed group than the comparison group by a mean of approximately 0.5 standard deviations. Scores on tests that comprised the Fluid Reasoning Composite were consistently lower for the concussion group than the comparison group. However, the differences were only statistically significant for the Flanker test and the dimensional change card sort test. Similarly, scores on the Toolbox Oral Symbol Digit Test and TMT B were lower for the concussed group but not significantly so.
Performance on Neurocognitive Testing
SD, standard deviation.
Simulated driving performance in both urban and rural scenarios was similar between the two groups (Table 3). There was a small but significantly greater variation in speed among concussed participants in both the urban and rural scenarios compared with controls. The TDRT miss count rate was higher in concussed participants compared with control drivers in both urban (24.2 vs. 21.9, p < 0.001) and rural scenarios (23.1 vs. 21.3, p = 0.02). There were no significant differences in variance in lane position nor in the TDRT reaction time.
Select Driving Simulator Results
Three participants were unable to complete the simulated drive
Missing TDRT data for one participant
Adjusted for baseline driving citations
Added 2500ms reaction time for the missed TDRT
Accounted for the total number of TDRT cues
Four participants were unable to complete the simulated drive.
One participant was unable to complete the simulated drive.
Adjusted for baseline driving citations.
Added 2500 msec reaction time for the missed TDRT.
Accounted for the total number of TDRT cues.
SDLP, standard deviation of lane position; SD, standard deviation; TDRT, tactile detection response task.
In the base model for TDRT reaction time and miss rate, which controlled for baseline citations, the concussed group had a significantly higher miss count than the comparison group in both city and rural settings, but corrected response times were similar for both groups (Table 4). Model 2, which included SCAT-5 total score, was a significantly better fit for miss count but not for corrected response time in both city and rural settings. Adding performance on neurocognitive tests (NIH Toolbox Fluid Composite, TMT, and Oral Symbol Digit) provided a significantly better fit for predicting TDRT reaction time and miss counts for both rural and city drives. The effect size was medium for TDRT miss counts and large for TDRT reaction times. As shown in Table 5, most of the individual neurocognitive tests were associated with TDRT performance and the strength of the relationships was similar across most tests. However, the Picture Sequence Memory test was not significantly associated with TDRT performance.
Factors Associated With Simulator Driving Performance
p values are based on likelihood ratio test.
Relative risk (RR) accounted for the total number of TDRT cues.
Coeff., coefficient; CI, confidence interval; SCAT-5, Sport Concussion Assessment Tool-5.
Associations Between Individual Neurocognitive Tests and TDRT Performance
TMT, Trail Making Test.
Discussion
In this study of youth with concussion compared with peers without concussion, there were small differences in driving skills as assessed in a driving simulator a mean of 19 days after concussion compared with controls. There were also differences between groups on neurocognitive performance on measures from the NIH toolbox and the TMT. Drivers who had sustained a concussion were more likely to miss responding to the TRDT stimulus than their peers. Higher symptom severity in concussed participants as measured by the SCAT-5 was associated with a higher miss rate. Neurocognitive test scores added additional predictive value for miss rate. There were large effect sizes for the relationship between neurocognitive test scores and drivers' reaction times when responding to the TDRT in both rural and city settings.
Simulators have been used to assess driving skills after TBI. 40 Our study did not find any significant differences in reaction time between concussion and non-concussed participants, while prior studies have found slower reaction time in simulators by drivers after concussion, but these did not correlate with computerized neuropsychological tests 16 (SD 10) days after concussion. 41 Other studies have found some association with lane control and concussion, differences not found in our study. 42 Other studies found no association of concussion with hazard perception reaction time. 43 In contrast, drivers with more severe TBI do have deficits on performance 17 and alter the amount and type of driving they undertake. 44
Participants in the concussion group reported substantial symptoms on the SCAT-5 compared with non-concussed participants, though the median time since concussion was 19 days. Significantly poorer performance on neurocognitive measures of executive function in the context of similar performance on measures of crystallized skills may suggest that concussed participants were continuing to experience injury-related cognitive symptoms. Of note, despite this evidence that cognitive skills as shown in the neuropsychological tests may have been a decline from their pre-concussed baseline, mean scores were still in the average to high average range and therefore did not suggest clear neurocognitive impairment.
SCAT-5 symptom severity was associated with some aspects of driving performance, suggesting the importance of screening for subjective symptoms. In addition, objective neurocognitive skills on standardized testing were predictive of both driving indicators. Neurocognitive test performance predicted greater number of TDRT misses and slower reaction time, suggesting an association between neuropsychological functioning and cognitively demanding driving performance. Effect sizes were medium to large, meaning neurocognitive screening may be a useful tool in addition to subjective report for informing recommendations for return to driving and other activities in the acute phase following a concussion. The SCAT-5 is a readily accessible and frequently used tool in the assessment of concussion. The NIH Toolbox is a brief and easy to administer measure that could likely be used in a primary care in addition to the assessment tools already used. Our findings suggest that there is not a single neurocognitive test that is particularly useful for informing return to drive. Instead, screening is best done with a brief battery of tests and examination of composite scores related to skills associated with concussion, such as processing speed, inhibition, and other measures of executive function.
Limitations
Generalizability of findings may be limited by the high level of functioning of this sample. Mean performance on neurocognitive tests was above expectations based on normative data for both groups. The patients were not able to be evaluated until a mean of 19 days after injury. Our assessment may not reflect cognitive difficulties that might have been present within the first week after injury. However, drivers were still reporting many symptoms of concussion, with a mean overall score of 33.1 on the SCAT-5. Some participants with concussion were unable to complete the driving tasks because they developed simulator-sickness in the simulator. We do not know if these individuals might have had worse performance, but simulator sickness is a not uncommon problem in simulator studies. 45 Although we found an association between neurocognitive measures and simulated driving performance, it is unclear whether this association is clinically meaningful. Further, clinical utility has yet to be investigated. Future research should investigate whether neurocognitive test performance can be interpreted via cutoff scores to inform recommendations to limit driving.
Conclusion
We did not find large differences in driving skills of concussed young adults after injury or large differences in neurocognitive functioning compared with young adults who did not have a concussion. Symptom report on the SCAT-5 and neurocognitive test performance were predictive of simulated driving, but clinical utility of these measures is unclear. Future work will examine the association of concussion with on the road driving performance and rates of crashes post-injury.
Footnotes
Authors' Contributions
Dr. Rivara: Conceptualization (co-lead); writing—original draft (co-lead); review and editing (equal).
Dr. Ebel: Conceptualization (co-lead); review and editing (equal).
Ms. Binjolkar: Methodology (co-lead); writing and reviewing (equal).
Dr. Wang: Data analysis (lead); methodology (supporting).
Ms. Hanron: Methodology (supporting).
Dr. Kroshus: Writing and reviewing (equal); methodology (supporting).
Dr. Boyle: Conceptualization(co-lead); methodology (co-lead); writing and reviewing (equal).
Dr. Patrick: Writing original draft (co-lead); conceptualization (co-lead).
Funding Information
Funded by 5R01NS107459 from the National Institute of Neurological diseases and Stroke.
Author Disclosure Statement
No competing financial interests exist.