
Abstract
Abstract
Cardiovascular disease, obesity, and type 2 diabetes are conditions characterized by low-grade systemic inflammation, strongly influenced by lifestyle, but the mechanisms that link these characteristics are poorly understood. Our first objective was to investigate if a normocaloric diet with a calorically balanced macronutrient composition influenced immunological gene expression. Findings regarding the suitability of blood as biological material in nutrigenomics and gene expression profiling have been inconclusive. Our second objective was to compare blood and adipose tissue sample quality in terms of adequacy for DNA-microarray analyses, and to determine tissue-specific gene expression patterns. Blood and adipose tissue samples were collected for gene expression profiling from three obese men before, during, and after a 28-day normocaloric diet intervention where each meal contained an approximately equal caloric load of macronutrients. Time series analyses of blood gene expression revealed a cluster of downregulated genes involved in immunological processes. Blood RNA quality and yield were satisfactory, and DNA-microarray analysis reproducibility was similar in blood and adipose tissue. Gene expression correlation between blood and adipose tissue varied according to gene function, and was especially low for genes involved in immunological and metabolic processes. This suggests that diet composition is of importance in inflammatory processes in blood cells. The findings also suggest that a systems biology approach, in which tissues are studied in parallel, should be employed to fully understand the impact of dietary challenges on the human body.
Background
Obesity is associated with a higher energy intake than energy expenditure, often as a result of large serving sizes (Greenwood and Stanford, 2008). Observations of eating patterns among the obese have shown that obese individuals consume significantly fewer meals and larger meal servings than nonobese individuals (Berg et al., 2009). Interestingly, the Berg et al. study did not find any differences in the daily energy intake between the obese and nonobese.
Postprandial blood glucose increases trigger inflammatory processes in blood cells in a dose-dependent manner (Dickinson et al., 2008). Meal composition, and especially the type and amount of carbohydrates, are decisive in determining the magnitude of the postprandial blood glucose peak (Galgani et al., 2006). However, excessive meal servings will cause substantial postprandial blood glucose peaks, even if the meal has an optimal macronutrient composition (O'Keefe et al., 2008).
Food quality and quantity are shown to be important regulators of the immunological processes (Egger and Dixon, 2009a) that are key factors in the progression of lifestyle diseases (Hotamisligil, 2006). Caloric restriction and carbohydrate modification have been shown to induce changes in the postprandial and long-term immunological gene expression in both blood cells (Crujeiras et al., 2008; van Erk et al., 2006) and in adipose tissue (Clement et al., 2004; Kallio et al., 2007; Mangravite et al., 2007).
Blood is an easily available tissue, making it a tempting and interesting source of sample material for nutrigenomics research. The use of blood cells as a source for microarray analysis, however, has been greatly debated. It has been shown that blood cell gene expression patterns vary strongly depending on RNA isolation and stabilization methods (Debey et al., 2004). Furthermore, gene expression profiles may be obscured by highly abundant globin transcripts (Wright et al., 2008). Introduction of RNA stabilizing blood collecting tubes and globin reduction techniques have reduced the impact of these difficulties (Liu et al., 2006; Shou et al., 2005). Nevertheless, gene expression in blood has been characterized as more variable than gene expression in any other tissues (Fan and Hegde, 2005). However, several studies have shown that the gene expression within individuals over time is stable (Eady et al., 2005; Karlovich et al., 2009; Radich et al., 2004; Whitney et al., 2003). This suggests that blood can be used to study gene expression responses of dietary interventions, provided multiple samples are taken over time from a single individual. The majority of genes expressed in blood have also been shown to be expressed (coexpressed) in tissues such as the brain, colon, and heart, among others (Liew et al., 2006). Moreover, because all living cells are in contact with blood, there is an open question as to whether changes in homeostatic conditions in a given tissue are reflected in blood gene expression.
Gene expression responses to diet interventions have frequently been studied in subcutaneous adipose tissue (Capel et al., 2008; Clement et al., 2004; Dahlman et al., 2005; Kallio et al., 2007; Mangravite et al., 2007). Even so, fundamental features of adipose tissue, such as intra- and interindividual gene expression variation, have not been discussed at the same level of detail as for blood. One exception is a study showing considerable interindividual gene expression variation (van Beek et al., 2007), suggesting that biological variation is a challenge in adipose tissue profiling.
The current study was designed as a pilot preceding a more comprehensive main study (Arbo et al., unpublished results, 2010), which is the reason for the small sample size. Although this study was undertaken with only three subjects, the time course study design with six subsequent samples from each subject can be seen as compensating for the sample size to some extent. Because of these study size limitations, we have chosen to base our analyses on groups of genes. Thus, our hypotheses, and suggested conclusions are not drawn based on data concerning any single gene.
The objective of the present work is twofold. First, we wanted to examine gene expression in blood in a study group of obese men who have shifted from their accustomed (prestudy) diet to a strictly defined diet characterized by a fixed number of meals, serving sizes, and macronutrient composition [30:30:40 energy percent (E%) from carbohydrates, proteins, and fat, respectively]. The change from the prestudy diet to the diet intervention suggests an immediate and persistent downregulation of genes in blood cells involved in immunological processes. Second, we compared blood and adipose tissue gene expression and detected low correlation among genes regulating immunological processes and metabolism, suggesting that studying a single tissue is not enough to fully understand how dietary changes affect humans as a complex biological system.
Methods
Subjects
Five obese, but otherwise healthy males were recruited to participate in the dietary intervention, through an advertisement in the main local newspaper for Trondheim, in mid-Norway. We included individuals aged 30 to 65, body mass index (BMI) >30 kg/m2 and with no known chronic diseases or need of medical treatment. Fasting serum glucose, CRP, and leukocyte count were determined at baseline along with anthropometric data. One of the study subjects was excluded because of problems in complying with the project menus. Based on RNA quality, we selected samples from three of the remaining four subjects for the microarray analysis (Fig. 1). After a thorough introduction to the study, all participants gave their written informed consent to participate. The study was approved by the Regional Committee for Medical and Health Research Ethics (4.2005.2187), Central Norway, and is registered at ClinicalTrials.gov (NCT00592397).
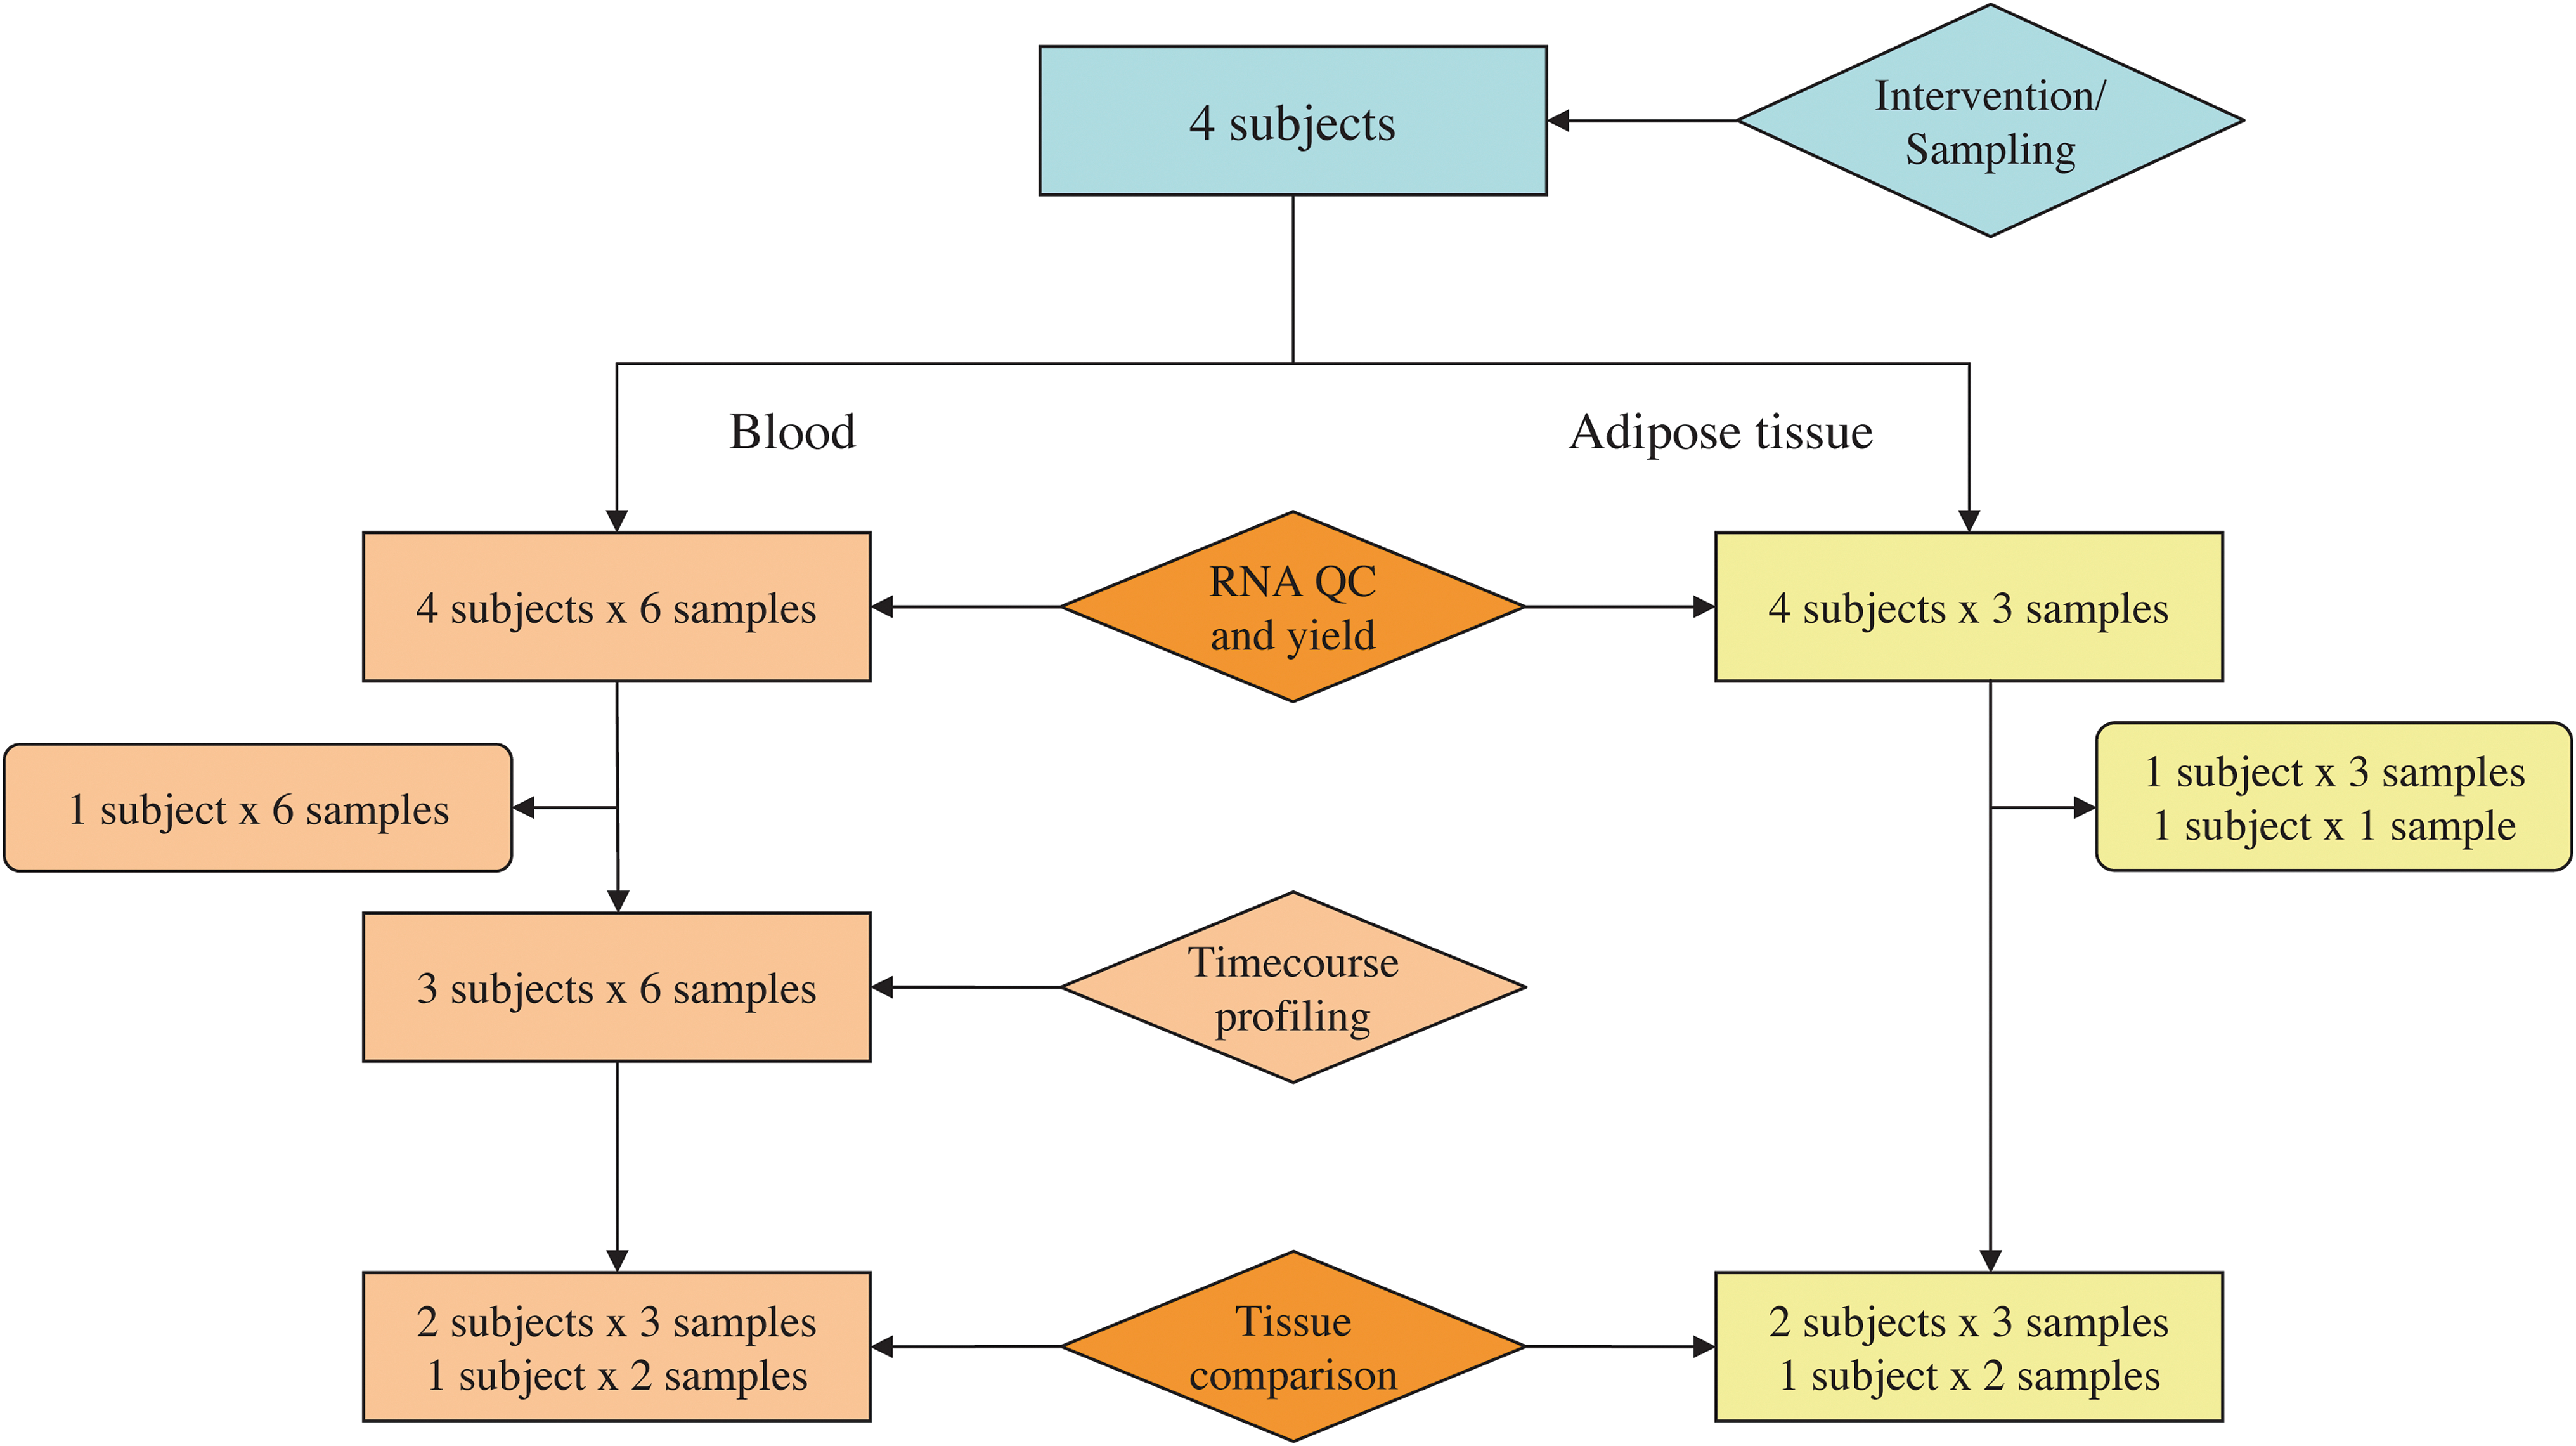
Flowchart. A flowchart showing the number and type of samples taken from subjects during the study. QC, quality control.
Study design
Prior to the start of the study, a 4-day dietary record (3 work days and 1 weekend day) was recorded, to map each individual's prestudy meal pattern and the macronutrient content of the meals. The individual normocaloric need was estimated with the Harris-Benedict equation for resting energy expenditure (REE) (Harris and Benedict, 1918) multiplied by an individual physical activity level (PAL) (Brooks et al., 2004).
Energy content and relative macronutrient energy composition were calculated for every meal to be consumed. The basic principle was a constant ratio of 30 E% carbohydrates, 30 E% proteins, and 40 E% fat in each meal. All subjects were provided a set of nutritionally calculated menus to choose from, with recipes for food and drinks (see Additional file 1: “Sample menu”).
The subjects were instructed to prepare and eat four main meals (each containing 20% of daily energy needs) and two in-between meals (each containing 10% of daily energy needs) each day. All subjects were provided diet scales and had to complete a dietary record reporting their choice of menus and the time of the day at which each meal was consumed. Subjects provided regular, most often daily, feedback to the project coordinator via e-mail or phone regarding their well-being, compliance, and health status.
Anthropometric data and fasting blood samples were collected at the onset (day 0, baseline), on days 1, 2, 7, 14, and at the end of the diet intervention (day 28). Fasting subcutaneous adipose tissue biopsies were collected on days 0, 7, and 28.
RNA extraction
Blood samples were drawn in Tempus blood RNA tubes (Applied Biosystems, Foster City, CA, USA) and frozen at −20°C until RNA isolation. RNA was isolated using a vacuum-based elution method (ABI PRISM™ 6100 Nucleic Acid PrepStation, Applied Biosystems), followed by GLOBINclear™ (Ambion, Austin, TX, USA) treatment.
Subcutaneous adipose tissue biopsies from the periumbilical region were sampled under local anesthesia (Emla® cream, AstraZeneca AB, Södertälje, Sweden) using a Tru-Core® III Automatic Biopsy Instrument (Inter-V, PBN Medicals, Stenløse, Denmark). Biopsies were washed with sterile saline, and transferred to RNAlater (Sigma-Aldrich, St. Louis, MO, USA) before freezing at −20°C. The biopsies were homogenized in QIAzol Lysis Reagent (Qiagen, Hilden, Germany) using a Polytron rotor-stator (PT-DA 3007/12EC, Brinkmann, Westbury, NY, USA). RNA was isolated using E.Z.N.A.® Total RNA Kit II (Omega Bio-Tek, Doraville, GA, USA), concentrated (Savant Speedvac, Thermo Quest, Engelsbach, Germany), and rinsed using MinElut kit (Qiagen).
The RNA quality and integrity were assessed using Agilent 2100 Bioanalyzer (Agilent Technologies, Santa Clara, CA, USA) using the RNA 6000 Nano LabChip® Kit. RNA was quantified and the optical density (OD) 260/280 ratios and OD 260/230 ratios were determined using NanoDrop® ND-1000 (NanoDrop Technologies, Wilmington, DE).
Microarray hybridization and image analysis
Gene expression analyses were performed at the Norwegian Microarray Consortium (NMC, University of Bergen, Norway) using NanoAmp RT-IVT Labeling kit, protocol rev A (Applied Biosystems), and Applied Biosystems Human Genome Survey Arrays (V1.0 with 24799 gene probes for blood, and V2.0 with 26857 gene probes for adipose tissue). Scanning and image analyses were performed using Applied Biosystems 1700 Chemiluminescent Microarray Analyzer according to the manufacturer's instructions.
ArrayExpress accession number: E-MEXP-2779.
Microarray data analysis
Microarray data analyses were performed in R (www.r-project.org/) and J-Express (Dysvik and Jonassen, 2001). Spots with low signal-to-noise ratios (s_n < 3) and bad quality spots (Flags > 8191) were removed according to the respective manufacturer's recommendations (NMC and MolMine AS; www.molmine.com). Subsets of microarray data used in separate analyses were quantile–quantile normalized. Spots with luminescence signals above the detection level, and that were not removed in the preprocessing, are considered to represent genes, and are from this point forward referred to as expressed genes. The signal intensity (level) will be referred to as gene expression (level). Gene expression in blood refers to the sum of transcripts from all types of blood cells represented by gene probes on the microarray, with the exception of the expressed globin genes, which are removed by GLOBINclear™ (Ambion). Similarly, gene expression in adipose tissue refers to the sum of transcripts from the complete set of cells in subcutaneous adipose tissue represented by gene probes on the microarray.
The gene expression time profile analysis involved six blood samples from each of the three subjects (Fig. 1). Only the 16,568 genes expressed in all time points of at least one of the subjects were considered. Log2 ratios were calculated for day 1, 2, 7, 14, and 28 signals, relative to day 0 signals. A k-means clustering algorithm (Initialization method: Forgy, Distance measure: Squared Euclidian) was used for clustering analysis of blood gene expression time profiles.
Tissue gene expression comparison analyses included RNA from blood and adipose tissue samples from day 0 and day 28 from three of the subjects, and from day 7 from two of these subjects (Fig. 1). Only the 10,937 genes expressed at all these time points, for all subjects, in both blood and adipose tissue, were included in the analyses.
Annotation of genes to functional ontology terms were performed using the PANTHER (version 6.1) classification system, and the PANTHER/X ontology (Thomas et al., 2003). PANTHER is also a system for classifying and predicting the functions of newly discovered proteins in the context of sequence-level relationships (Mi et al., 2007). A binominal test was applied to identify significantly enriched PANTHER/X terms among the set of diet responsive genes, using the complete Human AB1700 gene database as a reference set. The Wilcoxon rank-sum test was applied to explore the gene expression level distribution in blood and adipose tissue among genes annotated to the same PANTHER/X term, compared to the overall gene expression level distribution. The significance level for PANTHER test results was calculated as Bonferroni corrected p-values (q), adjusted for multiple testing. For further details about the statistical tests, see Thomas et al. (2006).
Additional annotation of genes to functional Gene Ontology (GO) terms (Ashburner et al., 2000) was performed in GeneTools (Beisvag et al., 2006). Fisher's exact test, which allows the user to compare gene sets without overlapping genes, was applied to identify significantly enriched GO terms within genes expressed exclusively in blood or exclusively in adipose tissue. The Benjamini-Hochberg step-up procedure was applied to adjust for multiple testing, calculating a false discovery rate (FDR, q). For further details about the statistical tests, see Beisvag et al. (2006).
Statistical analyses
Differences between means for prestudy and during the diet intervention meal pattern and energy measurements were assessed by performing paired samples t-tests using SPSS 17.0 (SPSS Inc., Chicago, IL, USA). Differences between calculated energy needs (kcal/24 h) and measured daily energy consumption during prestudy and diet intervention were assessed by performing repeated measures one-way ANOVA with Dunnett's post hoc test using GraphPad Prism version 4.0 for Windows (GraphPad Software, San Diego, CA, USA).
Intra- and interindividual gene expression correlation were assessed by applying the intraclass correlation coefficient (ICC) function (Type: consistency, two-way random effects model) from the psy package in R (http://www.r-project.org) over the 10,937 genes expressed in both blood and adipose tissue. The ICC was calculated over the three blood samples from subject 1, across the three blood samples from subject 2, and across the two blood samples from subject 3, separately. Intraindividual correlation for blood was calculated as the average of these ICC values. To calculate the intraindividual correlation for adipose tissue, the same procedure was repeated for the adipose tissue samples. Similarly, the ICC was calculated over the three blood samples collected at day 0, across the two blood samples collected at day 7, and across the three blood samples collected at day 28. Interindividual correlation for blood was calculated as the average of these three ICC values. The same procedure was followed to calculate interindividual correlation for adipose tissue.
Gene expression correlations between blood and adipose tissue across different gene sets were assessed by applying the Pearson correlation coefficient (r), calculated in R (www.r-project.org/). Average gene expression values over the eight blood samples and over the eight adipose tissue samples separately were used. The Pearson correlation coefficient of the eight pairs of blood and corresponding adipose tissue observations (the same subject at the same time point), across the same gene sets were also calculated, but did not provide any additional information (results not shown).
Results
Characterization of diets
Baseline characteristics of the four subjects included in the study are shown in Table 1. A 4-day dietary record showed that the overall prestudy diet was composed of 41 E% carbohydrates, 19 E% proteins, and 40% fat (Table 2). In the shift from the prestudy diet to the intervention diet, there was an overall 11% statistically significant decrease in energy from carbohydrates to 30 E%, and an overall 11% nonsignificant increase in energy from proteins to 30 E%. The energy from fat was the same in both diets. The daily average energy consumption had a small, and not significant decrease from 2756 kcal/day to 2700 kcal/day (p = 0.873), where two individuals increased their consumption, and two individuals decreased their consumption (one of the latter was not included in the microarray analysis). Overall, we conclude that the diet intervention was normocaloric. The prestudy diet was characterized by a more irregular dietary pattern with a broader range in number of meals a day, and daily energy consumption ranging from 2,223 kcal/day to 3,293 kcal/day (Table 2, see Additional file 2: “Individual meal pattern and energy intake measurements prestudy and during diet intervention” for individual records). Other characteristics were irregular distribution of meals during the day, and irregular macronutrient composition and energy content in the single meals (results not shown). All participants reported that they felt satiated and more energetic during the diet intervention period. Body mass decreased significantly by 3.8% (individual weight loss: 4.8, 6.3, 2.3, and 2.2%) throughout the diet intervention, but waist/hip ratio was constant (see Additional file 3: “Body mass, BMI and waisthip” for trends and individual numbers).
n = 4; SD, standard deviation.
n = 4; SD, standard deviation; REE, resting energy expenditure; PAL, physical activity level.
Meal pattern prestudy, 4-day dietary record.
Meal pattern during diet intervention, 28-day dietary record.
p-Values for differences between mean of prestudy and during diet intervention values (paired t-test),
p-Values for differences between prestudy and during study mean measured daily energy consumption, and calculated energy need (kcal/24 h) (one-way repeated-measures ANOVA).
Time profiling of gene expression in blood
To study the impact of the diet intervention, gene expression time profiling was performed on blood samples from three of the subjects, at days 0, 1, 2, 7, 14, and 28 of the intervention. The complete preprocessed and filtered data set contained six expression level measurements of 16,568 genes. Data from the three subjects were averaged for each gene and used as input to a k-means clustering algorithm. The gene expression time profiles were divided into three clusters termed A, B, and C. Cluster A consisted of 3,528 genes with strictly negative mean log2 ratios, and Cluster B consisted of 3,793 genes with strictly positive mean log2 ratios (Fig. 2). The increased or decreased gene expression was evident already by day 1 of the diet intervention, and remained at the new expression level throughout the diet period of 28 days. Cluster C consisted of 9,247 genes with mean log2 ratios close to zero, and were thus defined to contain only nonresponsive genes. To be defined as a diet responsive gene, a log2 ratio expression value > |0.20| in samples from at least two subjects, at least four time points, from each was required. This criterion resulted in 734 downregulated genes in Cluster A, and 299 upregulated genes in cluster B. To ensure that the classification of diet responsive genes was the result of an even response in all subjects, we calculated the percentage of diet responsive genes with log2ratio > |0.02| for each subject at each time point. The results ranged from 53 to 90%, suggesting that all subjects responded to the diet intervention.
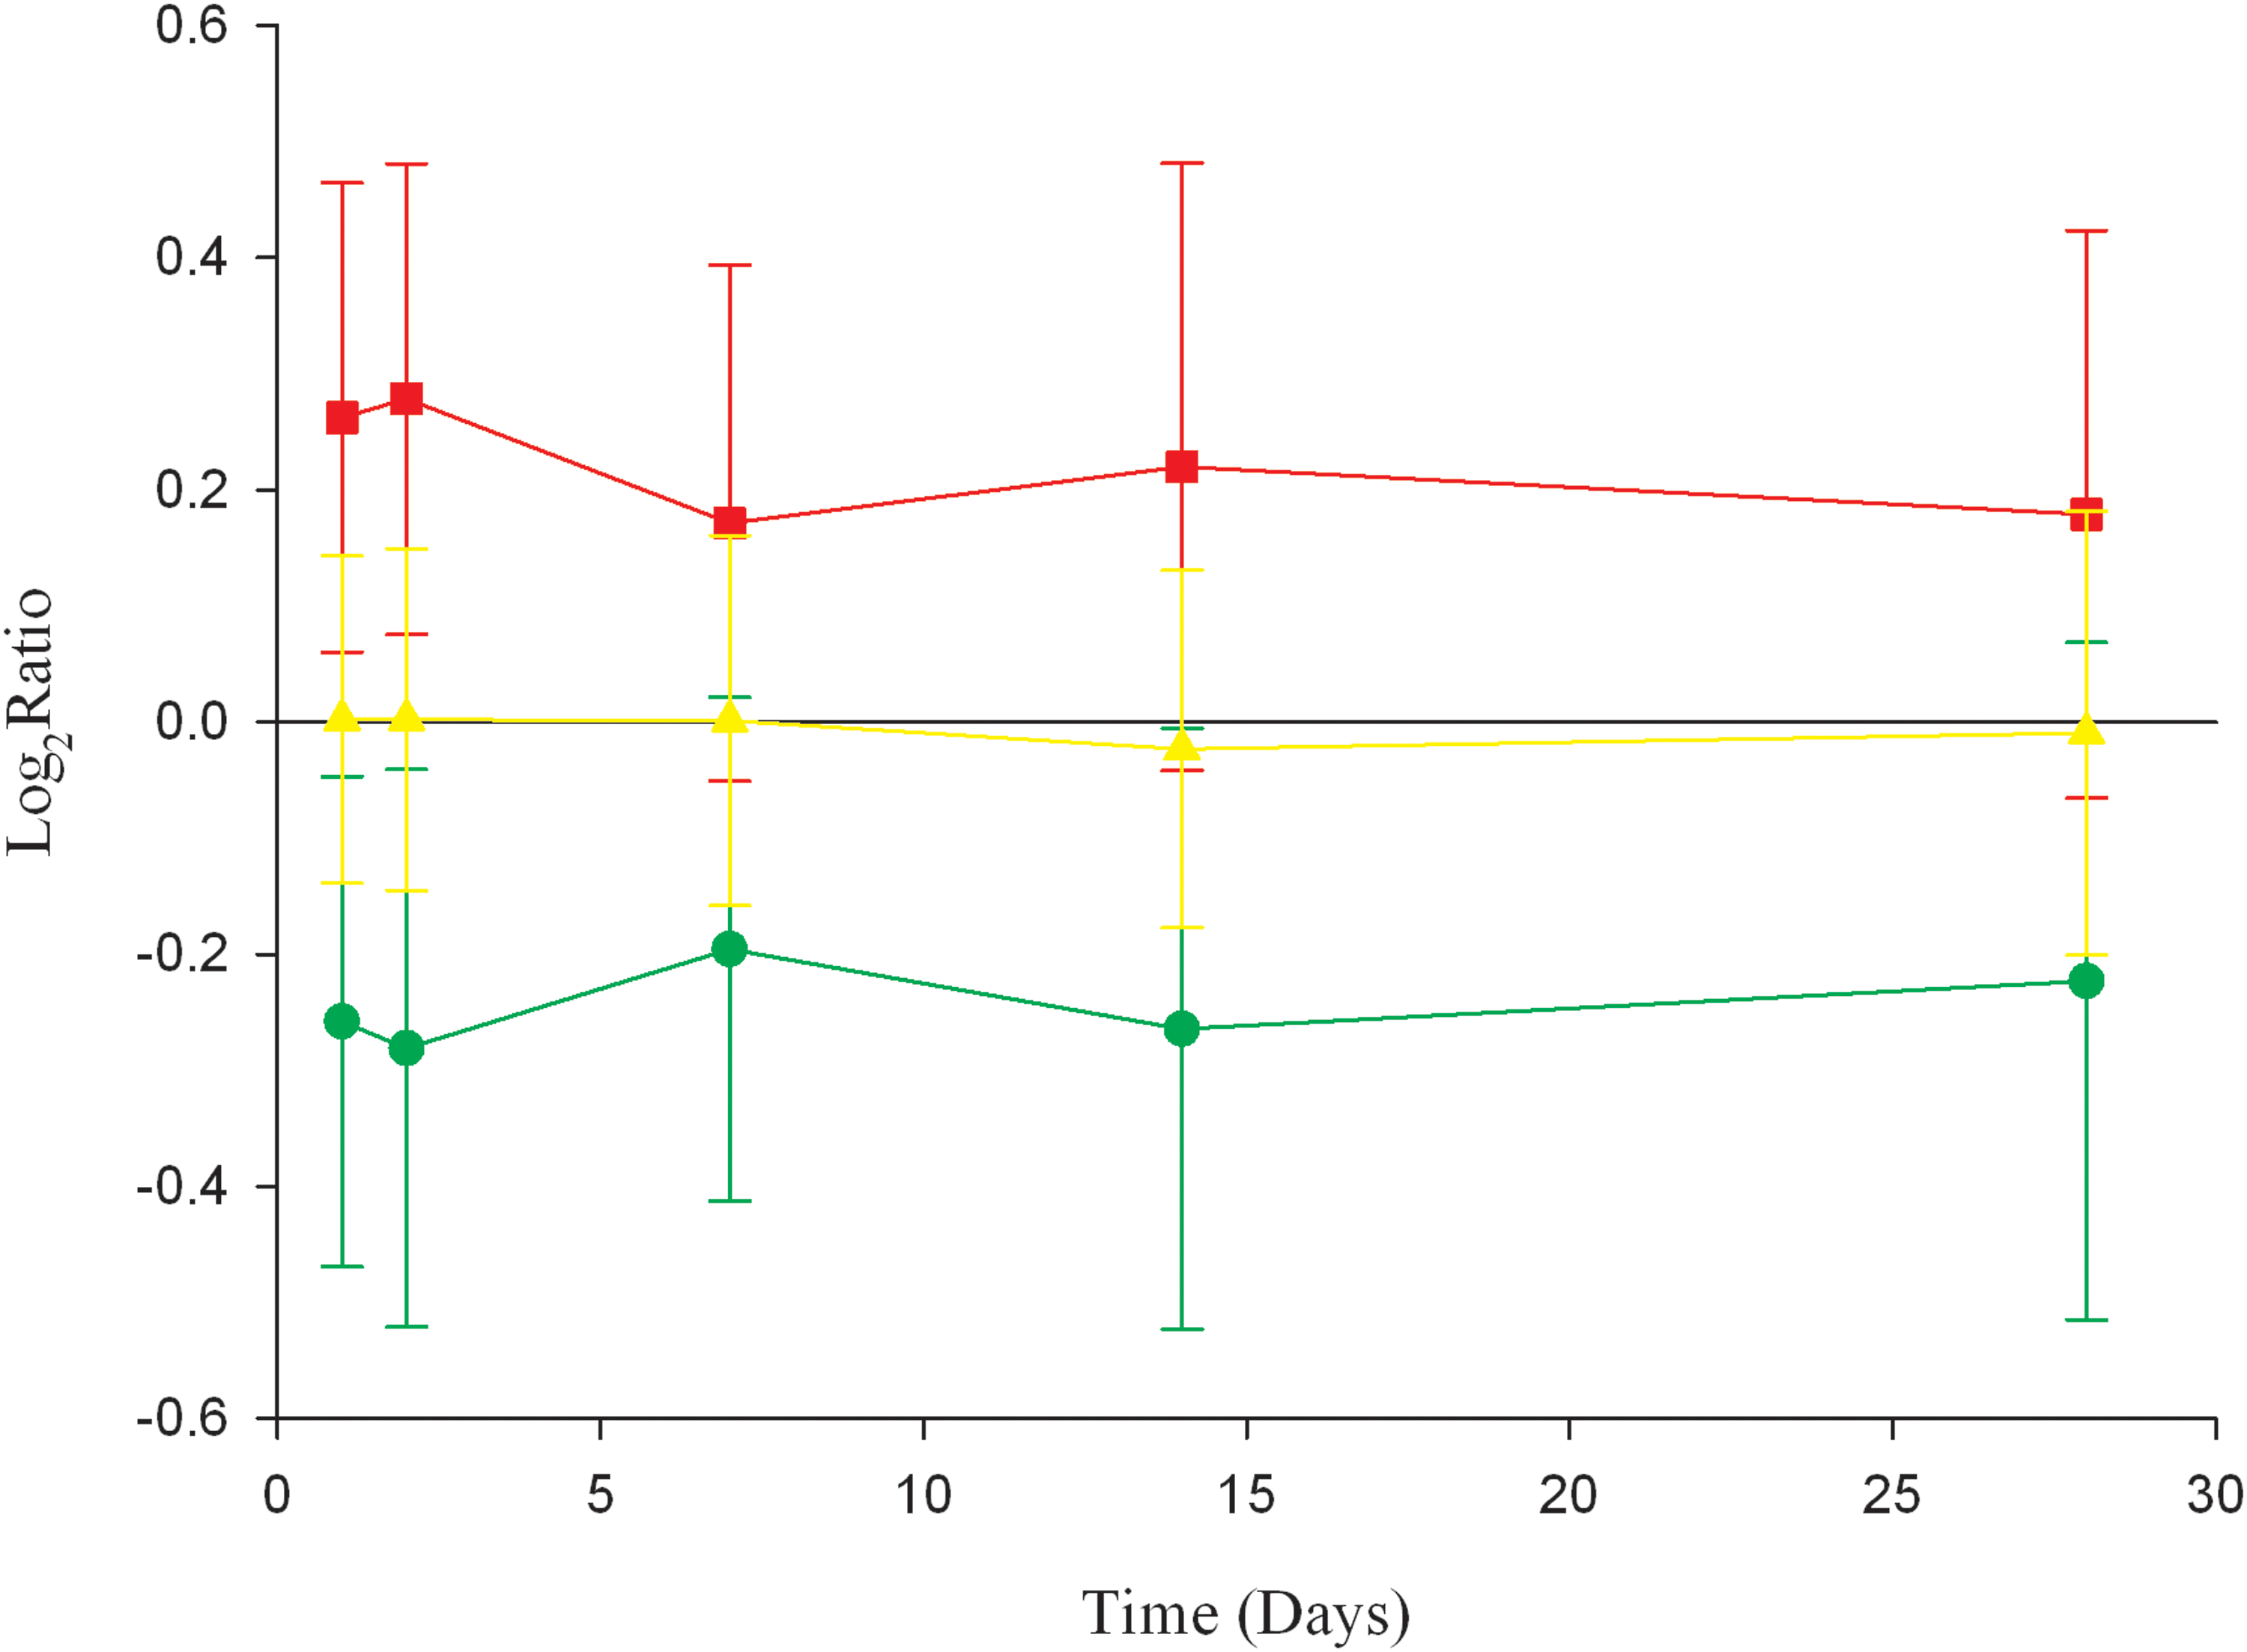
Gene expression time profiles. Gene expression time profiles for Cluster A (3528 genes), Cluster B (3793 genes), and Cluster C (9247 genes). The plot shows the mean log2ratio value for each cluster at each time point. Error bars represent the standard deviation.
Biological function of diet responsive genes
To explore the biological function of the diet responsive genes, the binominal test in PANTHER was applied to the gene annotation data from the set of 734 downregulated genes, the set of 299 upregulated genes, and to the complete set of genes on the microarray. Official PANTHER/X and GO terms representing a specific category of genes are from this point written in italic. The set of downregulated genes was enriched by genes involved in processes protecting the body against foreign substances or diseases, and especially processes relying on B-lymphocyte activation (Immunity and defense, q < 0.001; B cell mediated immunity, q < 0.001). The set of upregulated genes was enriched by genes associated with metabolic processes involving protein modification and biosynthesis (Protein metabolism and modification, q < 0.001; Protein biosynthesis, q < 0.008). Similar explorative analyses, with additional tools and ontologies, were conducted using the complete set of genes from Cluster A and Cluster B, separately. Similar results were reproduced, but with additional information. Pathway analysis in IPA, for instance, showed that several cytokine driven pathways and NF-κB signaling pathways were enriched by genes from Cluster A (Ingenuity® Systems, www.ingenuity.com). Complete results can be seen in Additional file 4: “Binominal PANTHER test,” Additional file 5: “Master-target test— GeneTools,” and Additional file 6: “Pathway analysis—IPA.”
Comparison of blood and adipose tissue samples
Parallel samples from both blood and adipose tissue give us the unique opportunity to compare tissue-specific features of different aspects of gene expression profiling. First, we compared quality and yield of isolated RNA. Second, we compared intra- and interindividual gene expression variation. Third, we compared gene expression patterns.
RNA quality and yield
Yield, purity, and integrity are important qualities of the RNA isolation process. Mean values from nine blood and nine adipose tissue samples prepared for the microarray analysis are available in Additional file 7: “RNA features.” The results show that one single invasive operation gave significantly better RNA yield from blood than from adipose tissue. Blood RNA was significantly less contaminated by organic solvents from reagents, and significantly more contaminated by proteins than adipose tissue RNA. The integrity of blood RNA molecules was significantly better than adipose tissue RNA molecules. During cRNA synthesis, the adipose tissue sample from day 7 from one of the subjects did not yield sufficient RNA for microarray hybridization. Together with generally low yield in most samples, this emphasizes the challenge of performing invasive adipose tissue biopsies.
Because the RNA yield in one of the adipose tissue samples was insufficient for microarray hybridization, all further comparisons of blood and adipose tissue samples collected at day 7 were performed on data from two subjects only (Fig. 1).
Intra- and interindividual gene expression correlation
To compare intra- and interindividual gene expression correlation separately for blood and adipose tissue, the ICC of the 10,937 genes expressed in both blood and adipose tissue was calculated for different sets of samples (Table 3). The blood intraindividual correlation was higher than the adipose tissue intraindividual correlation (average ICC = 0.978 and average ICC = 0.961, respectively). Similarly, the blood interindividual correlation was higher than the adipose tissue interindividual correlation (average ICC = 0.974 and average ICC = 0.958, respectively). These results cast doubt on the general perception that the reproducibility of gene expression microarray analyses of blood is low.
Adipose tissue and blood gene expression similarities and differences
The gene expression patterns in blood and adipose tissue were examined to estimate the gene expression concordance of the two tissues. A comparison showed that 86% of the genes expressed in blood cells were also expressed in adipose tissue. The gene expression correlation pattern of blood and adipose tissue was indicated by a Pearson correlation coefficient of r = 0.787. Coexpression and correlation numbers suggest gene expression pattern similarities between the two tissues.
Despite a large proportion of coexpressed genes in blood and adipose tissue, we wanted to explore the biological function of the classes of genes that were not coexpressed at the onset of the diet intervention. A Fisher's exact test in GeneTools (Beisvag et al., 2006) was applied to gene annotation data from a set of 745 genes exclusively expressed in blood, and to a set of 1,116 genes exclusively expressed in adipose tissue. The set of genes expressed in blood was significantly enriched by genes annotated with GO terms associated with apoptosis, and immunological processes (Apoptosis, q = 0.001; Immune System Process, q < 0.001; Leukocyte Activation, q < 0.001). The set of genes expressed in adipose tissue was significantly enriched by genes annotated with GO terms associated with organismal and anatomical structure development, and cell adhesion (Multicellular Organismal Development, q < 0.001; Anatomical Structure Development, q < 0.001; Cell Adhesion, q = 0.001) (Table 4). This suggests that genes not coexpressed have potential to be important regulators of biological processes under study, and that genes involved in immunological processes seem to be better displayed in blood than in adipose tissue.
Summary of biological processes significantly enriched (q<0.050) by genes expressed in one, and only one of the two tissues, blood, or adipose tissue, according to the mutually exclusive target–target test performed in GeneTools. The findings are sorted by increasing q-values of the parent terms. Hyphens illustrate child term of the above-named parent term.
B, there are more genes involved in the current process expressed in blood than in adipose tissue.
A, there are more genes involved in the current process expressed in adipose tissue than in blood.
To further explore the similarities and differences in gene expression patterns between blood and adipose tissue, we wanted to examine the gene expression level differences and gene expression correlation for groups of genes with functional similarities. We had eight pairs of adipose tissue and blood observations, from which we calculated a mean log2ratio (blood expression level:adipose tissue expression level) for each gene. Applying the Wilcoxon rank-sum test in PANTHER to these data revealed biological processes where the expression level among the annotated genes differed significantly. The correlation between blood and adipose tissue expression for the same subsets of genes was calculated as well (Table 5). In general, genes associated with immunological processes were expressed at a relatively higher level in blood than in adipose tissue, and compared to the correlation across all genes (r = 0.787), these genes were characterized by low gene expression correlation between the tissues (Immunity and Defense, q < 0.001, r = 0.610; B Cell- and antibody-mediated immunity, q < 0.001, r = 0.438; Granulocyte-mediated Immunity, q = 0.003, r = 0.101; Cytokine- and Chemokine-Mediated Signaling Pathway, q < 0.001, r = 0.445). One exception regarding correlation were the genes annotated to T-Cell-Mediated Immunity, where a contradictory high correlation was measured (p < 0.001, r = 0.748). Genes involved in metabolism were expressed at a relatively higher level in adipose tissue than in blood, and were also characterized by a low correlation coefficient (Lipid, Fatty Acid, and Steroid Metabolism, p < 0.001, r = 0.630; Coenzyme and Prosthetic Group Metabolism, p < 0.001, r = 408). Some groups of genes show significant differences in expression level, but high expression correlation (Chromatin Packaging and remodeling, p < 0.001, r = 0.845; Electron Transport, p < 0.001; r = 0.858; Oxidative Phosphorylation, p < 0.001, r = 0.905). Important groups of genes, such as genes involved in immunological processes, were expressed in a highly different manner in blood and adipose tissue, showing the considerable complexity of the human organism.
Summary of biological processes where genes are expressed at significantly different level (q<0.050), according to the Wilcoxon rank-sum tests performed in PANTHER. The Pearson correlation coefficient (r) across genes in the given biological process, between mean gene expression levels in blood and in adipose tissue, is given. The findings are sorted by increasing q-values of the parent terms. Hyphens illustrate child term of the above-named parent term.
A, genes involved in the current process are expressed at a higher level in adipose tissue than in blood.
B, genes involved in the current process are expressed at a higher level in blood than in adipose tissue.
r, Pearson correlation coefficient.
Discussion
The shift from the pre-study diets to the normocaloric intervention diet involved a decrease in dietary carbohydrates from 41 E% to 30 E%, and an increase in dietary proteins from 19 E% to 30 E%. The prestudy eating pattern was characterized by a large variation in the number and energy content of main and in-between meals per day, and a meal macronutrient imbalance compared to the diet intervention. Our results showed that the diet intervention induced gene expression changes in blood cells. The most significant characteristic of the gene expression changes was a downregulation of genes involved in immunological processes. We found that the majority of genes on the microarray were coexpressed in blood and adipose tissue, and that across those genes the expression levels correlated quite well between the two tissues. However, both coexpression and expression levels of correlation varied between groups of functionally related genes, and were at the lowest for genes involved in immunological processes and metabolism. Blood and adipose tissue samples were of satisfactory quality for microarray hybridization, but RNA accessibility was significantly higher in blood. The reproducibility of gene expression analyses was about the same in blood as in adipose tissue.
The diet intervention and low-grade systemic inflammation
Globally, cardiovascular disease (CVD) is the most common cause of mortality, whereas the incidence of T2D is rapidly increasing, and the prevalence of obesity has reached epidemic proportions (WHO, 2006, 2009a, 2009b). These lifestyle diseases share a common characteristic of low-grade systemic inflammation. Food quality and quantity have a direct and indirect impact on the immune system (Egger and Dixon, 2009a). More specifically, caloric restriction (Clement et al., 2004; Crujeiras et al., 2008) and reduction of dietary glycemic index (Dickinson et al., 2008; Kallio et al., 2007) have shown to be dietary strategies that induce the downregulation of immunological genes. In the current study we have shown that a diet with a decreased energy percentage from carbohydrates, and an increased energy percent from proteins induced a gene expression response that was similar to responses linked to caloric restriction and reduction of glycemic indices. One common effect of improving carbohydrate quality while decreasing carbohydrate quantity is improved glycemic and insulinemic control. This is also true with caloric restriction. The addition of dietary amino acids and substituting dietary proteins for carbohydrates have also been shown to affect insulinemic responses (Madsen et al., 2008; Nilsson et al., 2007), making it reasonable to examine whether the immunological gene profile in blood is partly regulated by glycemic or insulin levels.
An examination of the eating pattern of obese men reveals that they often skip some meals and compensate by eating larger portions at other meals to justify for the lost calories (Berg et al., 2009). This habit of skipping meals and eating larger servings was also seen in the prestudy eating patterns of our subjects, as well as a propensity to eat a diet with an unbalanced macronutrient composition, where meals were dominated by one or two macronutrients. This leads to speculation as to whether the prestudy diet is characterized by increased postprandial glucose excursions that in turn lead to large blood glucose fluctuations. Because both hypoglycemia (Razavi Nematollahi et al., 2009) and hyperglycemia (Dickinson et al., 2008) activate proinflammatory mediators, the prestudy diet appears to be unhealthy in terms of reinforcing low-grade systemic inflammation. This effect is supported by the gene expression changes that occurred during the diet intervention.
The diet intervention and weight loss
The effect of weight loss on gene expression has been described previously. Weight loss of 6.5, 9.5, and 7.5% in 4, 8, and 10 weeks, respectively (Clement et al., 2004; Crujeiras et al., 2008; Dahlman et al., 2005), has been shown to induce gene expression changes in obese subjects. In our study we saw a 3.8% weight loss in 4 weeks, despite a normocaloric intake compared to the prestudy diet. Low and very low carbohydrate diets have been shown to induce immediate weight loss because of glycogen depletion and subsequent water loss (Bergstrom et al., 1967; Kreitzman et al., 1992). Higher protein diets are associated with fat loss. However, this loss is mostly related to increased satiety and a reduced ad libitum energy intake, not to normocaloric diet interventions (Westerterp-Plantenga, 2008). The diet intervention in the current study reduced the energy percent from carbohydrates and correspondingly increased the energy percent from proteins. The weight loss we observed is unlikely to be explained by fat loss alone, at least not abdominal fat, because the waist/hip ratio of our subjects did not change significantly. We may therefore assume that at least a significant part of the observed weight loss may be due to reduced body water. Moreover, the diet-induced change in gene expression was immediate, whereas a reduction in body fat mass would not have been. However, more research has to be done to determine whether or not the observed gene expression changes may be explained by weight loss.
The impact of macronutrient composition on gene expression
There have been relatively few investigations of the impact of macronutrient composition as an isolated variable in terms of its effect on gene expression in humans. Some studies have examined diet macronutrient composition in combination with caloric restriction (Capel et al., 2008; Dahlman et al., 2005; Mangravite et al., 2007). In these studies the effect of caloric restriction seems to overshadow the effect of macronutrient alteration, and the latter is interpreted as unimportant. The macronutrient composition could play a more important role if the data were to be interpreted differently (Dahlman et al., 2005), or if the sample size in the microarray analysis were increased (Mangravite et al., 2007).Our study shows that an intervention with a moderate shift in diet macronutrient composition induces gene expression changes, although these changes were subtle. Because caloric restriction and macronutrient composition do not seem to have any additional effect, or because caloric restriction may overshadow the effect of macronutrient composition, these effects should be studied independently.
Blood and microarray analysis
In 2006, van Erk et al. (2006) published the first genome-wide expression analysis in a study of dietary impact on human blood cells. A few others have followed (Bakker et al., 2010; Bouwens et al., 2009a; Bouwens et al., 2009b; Crujeiras et al., 2008), but most of the work has been performed using adipose tissue or muscle. One reason for this might be the perception that gene expression in blood can be quite variable (Fan and Hegde, 2005), which in turn can blur the actual, sometimes subtle, dietary effect on gene expression. Some work has been undertaken to validate gene expression profiling in blood (Eady et al., 2005; Karlovich et al., 2009; Radich et al., 2004; Whitney et al., 2003), which, together with van Erk et al. (2006), showed that the intraindividual variation was low. Van Beek et al. (2007) calculated both intra- and interindividual variation in subcutaneous adipose tissue, and found good intraindividual correlation, but large interindividual gene expression differences. In our study, the intraindividual variation occurred at the same level as in van Beek et al. (2007), but the interindividual variation was somehow lower. This could be explained by the larger BMI range among van Beek et al.'s study subjects. Even more important, reproducibility as measured by ICC was at a higher level in blood than in adipose tissue, though the difference was small. Our study has also shown that the yield and quality of RNA from blood is higher than from adipose tissue.
Blood gene expression profile as a surrogate marker of other tissues
Blood reaches every living cell in the body, and ∼85% of the genes expressed in various tissues, such as the brain, colon, kidney, and spleen, are coexpressed in blood (Liew et al., 2006). We showed in a similar comparison that 86% of the genes expressed in blood are coexpressed in adipose tissue, and that the gene expression correlation across these genes was quite high (r = 0.787). These results, combined with the satisfactory quality of the RNA from blood samples, raises a question that has also been posed by Liew et al. (2006): Could a gene expression pattern in blood be used as a surrogate marker to reflect conditions elsewhere in the human body? If so, this would open new opportunities in nutrigenomics research, because blood is more easily collected than tissue biopsies. Blood sampling poses far less discomfort for research subjects than tissue biopsies, and allows for less invasive procedures to obtain the biological material needed. Hermsdorff et al. (2010) recently published the first successful attempt to identify surrogate markers in blood. Nevertheless, we have concerns about any overinterpretation of gene expression in blood. Subcutaneous adipose tissue is considered a multifunctional and important endocrine organ (Trayhurn and Wood, 2004), with far different functions compared to blood. This is reflected in the gene expression analysis performed in our study, which showed that the immunological and metabolic gene profiles differed between blood and subcutaneous adipose tissue. This suggests that our basic understanding of how nutrition affects a certain tissue has to be studied in the actual tissue. More importantly, a systems biology approach, in which tissues are studied in parallel, should be employed to fully understand the impact of a dietary challenge on the human body.
T-cell-mediated immunity gene expression in blood and adipose tissue
Higher levels of obesity are associated with low-grade systemic inflammation and invasion of macrophages (Weisberg et al., 2003) in adipose tissue. Recent research has shown that T cells can also be recruited in adipose tissue invasion (Wu et al., 2007). The subjects in this study were men with an average BMI of 36 kg/m2, and their subcutaneous adipose tissues were likely to be invaded by both macrophages and T cells. This could be an explanation for the high correlation between expressed genes involved in T-Cell-Mediated Immunity in blood and adipose tissue, in contrast to the other groups of genes involved in immunological processes (Table 5).
Limitations
The current study is subject to several limitations. The gene expression data used in the k-means clustering algorithm (Fig. 2), or genes defined as responsive to diet, were not a subset of significantly differentially expressed genes, in the traditional manner of microarray analysis. The study's lack of statistical power means that we were unable to interpret the results from single genes.
A comparison of the effects of dietary change on blood and adipose tissue would have been of great interest. However, our small number of adipose tissue samples, along with just three sample points, and one lost sample because of insufficient yield, limited our ability to conduct this comparison.
Our subjects were followed closely by the study coordinator, and every meal and its contents were reported. However, due to the nature of the study (a free-living setting) the actual intake of calories and nutrients could not be entirely controlled. Subjects reported that they had particular difficulty in complying with the diet from day 14 to day 28, because there were fewer meetings between the subjects and the study coordinator.
Both blood and adipose tissue are mixtures of different cell types, which ideally should be analyzed separately. Nucleated blood cells consist of reticulocytes, and of a number of different leukocytes with different tasks and obviously different distinct gene expression patterns (Palmer et al., 2006). In this study, we did not perform differential leukocyte counts to determine the fraction of leukocyte subtypes. This carries the risk that the changes we interpreted as diet-responsive genes were instead due to a diet-related change in leukocyte distribution.
A similar limitation may apply to our subcutaneous adipose tissue samples. Adipose tissue consists of adipocytes, preadipocytes, fibroblasts, mastocytes, and endothelial cells (Avram et al., 2005; Clement et al., 2004), and the tissue in obese individuals will be invaded by macrophages (Weisberg et al., 2003) and T cells (Wu et al., 2007). Adipose tissue biopsies are also vulnerable to blood cell contamination. We did not attempt to determine the magnitude to which leukocytes had invaded adipose tissue, which means that we do not know how much gene expression is affected by leukocytes.
Our finding that the diet intervention downregulated genes involved in immunological processes and cytokine-mediated pathways is limited to our study of obese men. These individuals are likely to have average serum levels of CRP that are presumably higher than in leaner individuals. Therefore, our results may not be generalized to the population as a whole. However, our work is an important addition to the growing documentation of the importance of eating patterns and diet macronutrient composition on lifestyle disease development, and should encourage more research on the topic.
Conclusions
We performed a normocaloric diet intervention with 30 E%, 40 E%, and 30 E% compared to a prestudy diet with 41 E%, 40 E%, and 19 E% from carbohydrates, fats, and proteins, respectively. The changes in our subjects' eating patterns during the diet intervention were characterized by an increase in the number of regular meals per day and a more even distribution of energy consumption. We have shown that in obese, but otherwise healthy men, the diet intervention induced changes in blood gene expression. Two oppositely regulated clusters of diet responsive genes were found, and were discernable from a cluster of diet nonresponsive genes. We identified a significant and high number of genes that regulate immunological processes among the downregulated genes that responded to the diet intervention. This suggests that the shift from the prestudy diet and eating pattern to the diet intervention has the potential to reduce low-grade systemic inflammation.
Blood is a suitable and easy accessible source for gene expression profiling using existing techniques, yielding RNA of high reproducibility and quality. Gene expression differences between blood and adipose tissue suggest that studying a single tissue is not sufficient to fully understand how dietary changes affect humans as a complex biological system. However, due to the limited sample size, our results should be confirmed in a study with more subjects.
Footnotes
Acknowledgments
This work was partly funded by the Norwegian University of Science and Technology, Central Norway Regional Health Authority, and the Research Council of Norway (FUGE). We thank Professor Martin Kuiper for helpful guidance in writing the manuscript.
Author Disclosure Statement
No competing financial interests exist.
References
Supplementary Material
Please find the following supplemental material available below.
For Open Access articles published under a Creative Commons License, all supplemental material carries the same license as the article it is associated with.
For non-Open Access articles published, all supplemental material carries a non-exclusive license, and permission requests for re-use of supplemental material or any part of supplemental material shall be sent directly to the copyright owner as specified in the copyright notice associated with the article.