
Abstract
Abstract
Multi-omics data-driven scientific discovery crucially rests on high-throughput technologies and data sharing. Currently, data are scattered across single omics repositories, stored in varying raw and processed formats, and are often accompanied by limited or no metadata. The Multi-Omics Profiling Expression Database (MOPED, http://moped.proteinspire.org) version 2.5 is a freely accessible multi-omics expression database. Continual improvement and expansion of MOPED is driven by feedback from the Life Sciences Community. In order to meet the emergent need for an integrated multi-omics data resource, MOPED 2.5 now includes gene relative expression data in addition to protein absolute and relative expression data from over 250 large-scale experiments. To facilitate accurate integration of experiments and increase reproducibility, MOPED provides extensive metadata through the Data-Enabled Life Sciences Alliance (DELSA Global, http://delsaglobal.org) metadata checklist. MOPED 2.5 has greatly increased the number of proteomics absolute and relative expression records to over 500,000, in addition to adding more than four million transcriptomics relative expression records. MOPED has an intuitive user interface with tabs for querying different types of omics expression data and new tools for data visualization. Summary information including expression data, pathway mappings, and direct connection between proteins and genes can be viewed on Protein and Gene Details pages. These connections in MOPED provide a context for multi-omics expression data exploration. Researchers are encouraged to submit omics data which will be consistently processed into expression summaries. MOPED as a multi-omics data resource is a pivotal public database, interdisciplinary knowledge resource, and platform for multi-omics understanding.
Introduction
D
The Multi-Omics Profiling Expression Database (MOPED, http://moped.proteinspire.org) was created to meet the pressing needs and demands of life sciences researchers for a freely available public domain database of preprocessed expression information to complement already available data resources (Higdon et al., 2014; Kolker et al., 2012a). MOPED version 2.5 is a multi-omics resource that includes consistently processed proteomics and transcriptomics expression information. With each release, MOPED has provided more data, more visualization tools, and further improvements to the user interface. MOPED encourages researchers to submit raw or processed omics (e.g., transcriptomics, proteomics, metabolomics, etc.) data. The MOPED team will process the raw data and make it available to the user either in public or private MOPED. As such, MOPED provides a platform for data exploration by researchers, collaborators, or reviewers, helps to fulfill publication data submission requirements, and facilitates data sharing with the scientific community.
Launched initially as a proteomics database, MOPED 2.5 has now added gene expression data. As a proteomics resource, MOPED's users were from over 90 countries in 2013. The multi-omics collection of data will allow researchers to capitalize on the strengths across omics to enable more powerful analyses and complex hypothesis testing. With the addition of more than 150 gene relative expression experiments, MOPED is a paradigm shift away from isolated research silos toward community-wide, data-driven biological discovery. Building on the best practices used in different fields, MOPED integrates heterogeneous data into a unified public resource. The integration of multi-omics data can be essential for scientific discovery (Efron and Tibshirani, 2007; Huang, 2014; Huang et al., 2014; Olex et al., 2014), thus by providing a platform for multi-omics data, MOPED can act as a launching point for scientific discoveries.
Data Sources
MOPED 2.5 encompasses approximately 5 million transcriptomic and proteomic expression records from over 250 experiments covering four organisms: human, mouse, worm, and yeast. These expression records come from almost 200 tissues and include nearly 390 conditions.
MOPED added transcriptomics relative expression data that compares the expression of mRNAs in different conditions or tissues. The gene expression data comes from preprocessed Gene Expression Omnibus (GEO) data (Barrett et al., 2012; Edgar et al., 2002). The GEO microarray experiments were downloaded, reviewed, and analyzed using LIMMA package in R (Smyth, 2005). Results were filtered to only include gene expression for the primary organism.
Along with MOPED's expansion into a multi-omics database, the original proteomics data has continued to grow. This latest release increases the number of proteomics records to more than 500,000, a 2.5-fold increase. MOPED's protein expression sources include PeptideAtlas, PRIDE, ProteomicsDB, and collaborators (Desiere, 2006; Vizcaíno et al., 2013, https://www.proteomicsdb.org).
To provide robust and standardized analysis of proteomics data, protein identification and expression analysis are carried out using SPIRE, a proteomics analysis pipeline that integrates search engines X!Tandem and OMSSA with peptide identification models, IPM (Integrated Protein Model) and relative expression analysis (Craig et al., 2004; Geer et al., 2004; Hather et al., 2010; Higdon et al., 2008, 2011; Kolker et al., 2011, 2012b). SPIRE can directly generate protein absolute and relative expression data in a format that can be uploaded to MOPED. The absolute expression table displays concentrations, based on spectral counts and known tissue protein concentrations, in ppm, ng/mL, and nM. MOPED uniquely calculates the protein concentration dependent on the source tissue, allowing for more accurate comparisons (Higdon et al., 2014).
Protein relative expression experiments are also displayed in MOPED. These allow users to examine expression differences within comparative experiments, such as comparisons of disease state and nondisease state samples. MOPED reports expression ratios, p-values, and false discovery rates that are calculated based on pair-wise comparisons made using SPIRE (Higdon et al., 2014; Kolker et al., 2011, 2012b). Comparisons within an experiment can be more accurate because of consistent experimental design and therefore provide further insight into complex biological functions. Differences in protein expression may reveal the protein(s) involved in cellular responses to the condition being examined.
Using these consistent analysis methods, MOPED can also process raw omics (transcriptomics, proteomics, metabolomics, etc.) data submitted by researchers. Expression data will then be presented in a summarized form within the MOPED data interface. Researchers can choose to keep data private, which allows collaborators or reviewers to explore the data, or make the data public.
For transcriptomics and proteomics data, the MOPED team reviews experimental design, analysis methods, and results. The experiments are reviewed through metadata provided at source sites and published articles about the datasets. The DELSA proposed metadata checklist helps facilitate checking of data sources, analyses, and results (Ioannidis and Khoury, 2011; Kolker, 2013; Kolker et al., 2012c; Ozdemir et al., 2011a; 2013a, 2013b). This manual curation process increases the data quality in MOPED.
MOPED Data Interface
The data can be accessed through three “tabs” in MOPED: Protein Absolute Expression, Protein Relative Expression, and Gene Relative Expression. The Protein Absolute Expression tab enables the user to examine protein concentrations within and across experiments. Users can explore ratios of protein or transcript concentrations in comparative experiments within the Protein Relative Expression and Gene Relative Expression tabs.
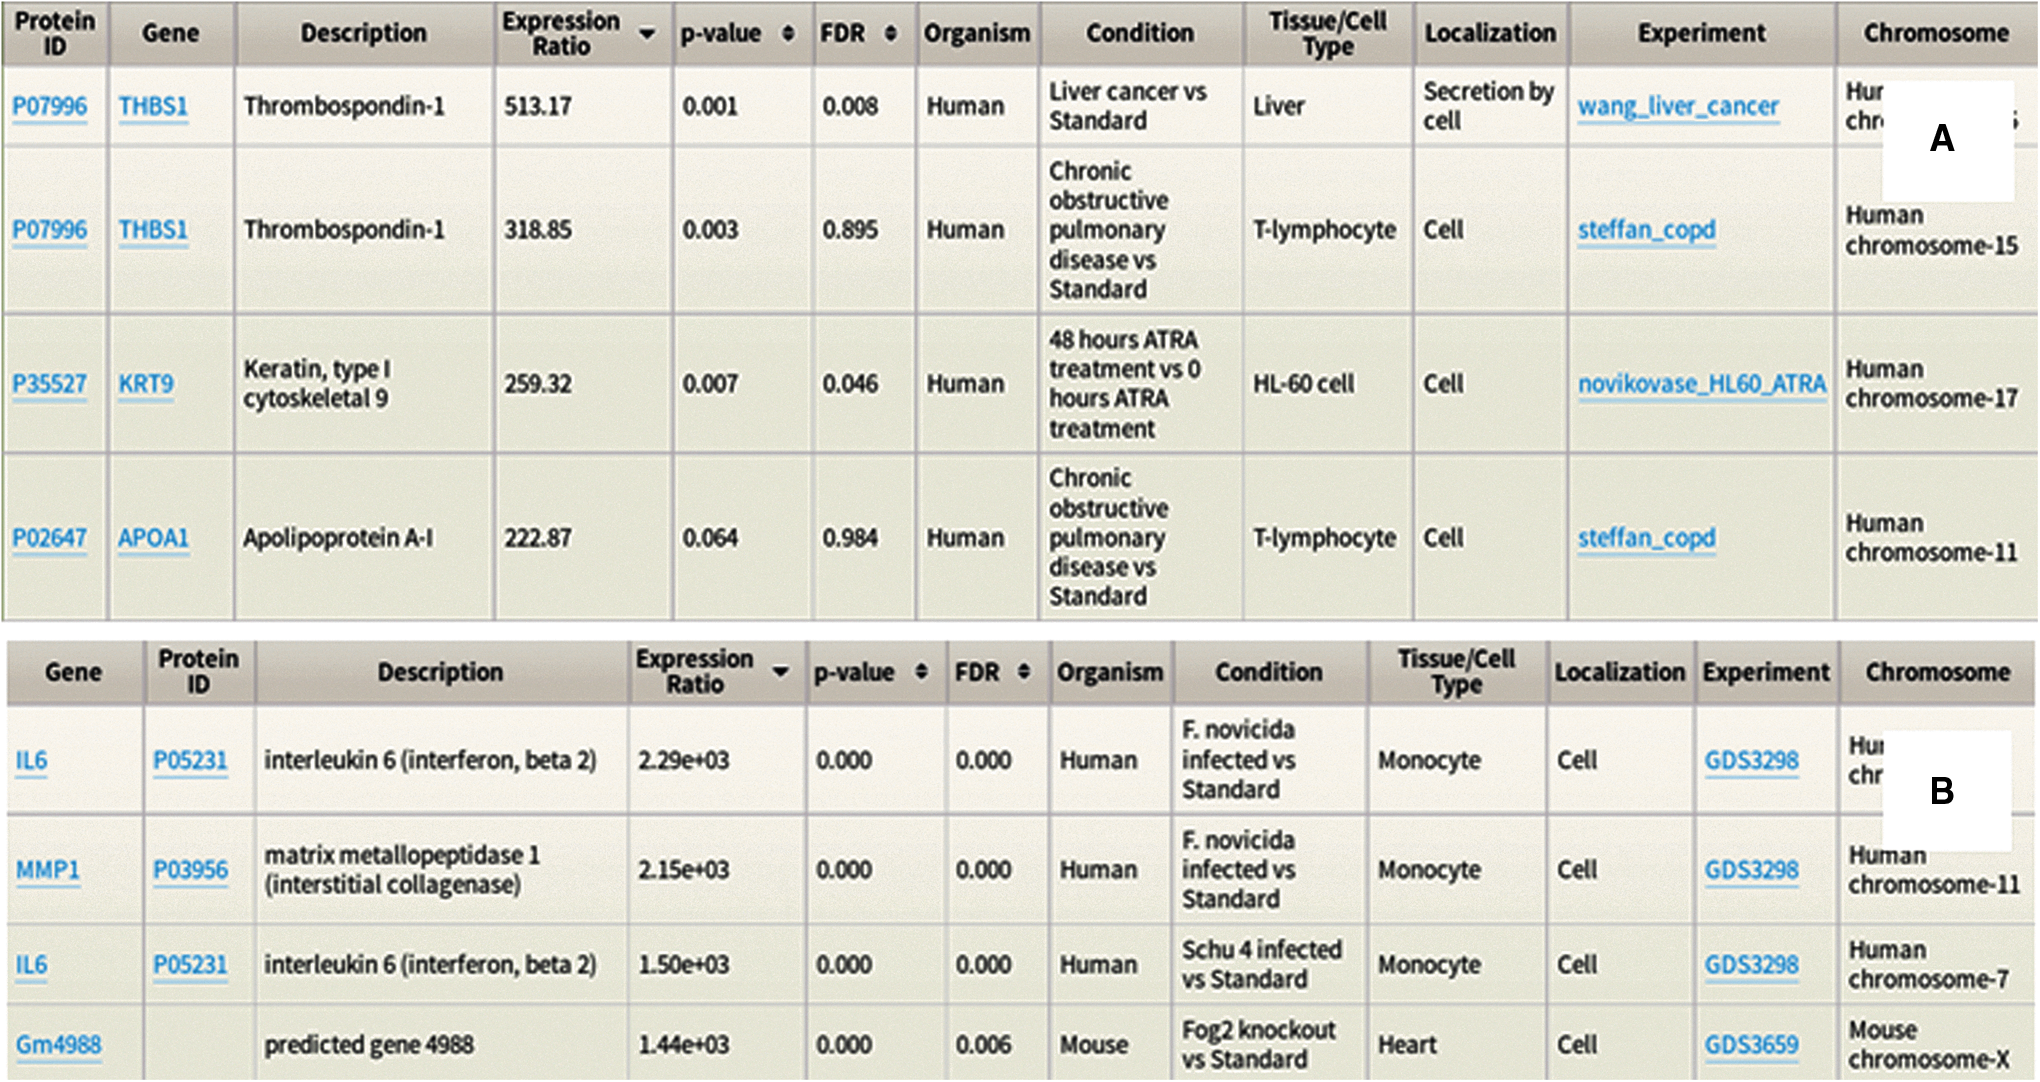
In each of the three tabs, users can search expression data by gene symbol, UniProt protein ID, localization, condition, tissue, experiment, or keyword (Fig. 1). Terms can also be combined and filters set for more advanced searches. An example of the Gene Relative Expression Results table's content is found in Figure 1. For efficient searching, MOPED utilizes Lucene for full text indexing and AspectJ for tracking and optimization (Apache Foundation, http://lucene.apache.org/; Eclipse Foundation, http://eclipse.org/aspectj/).
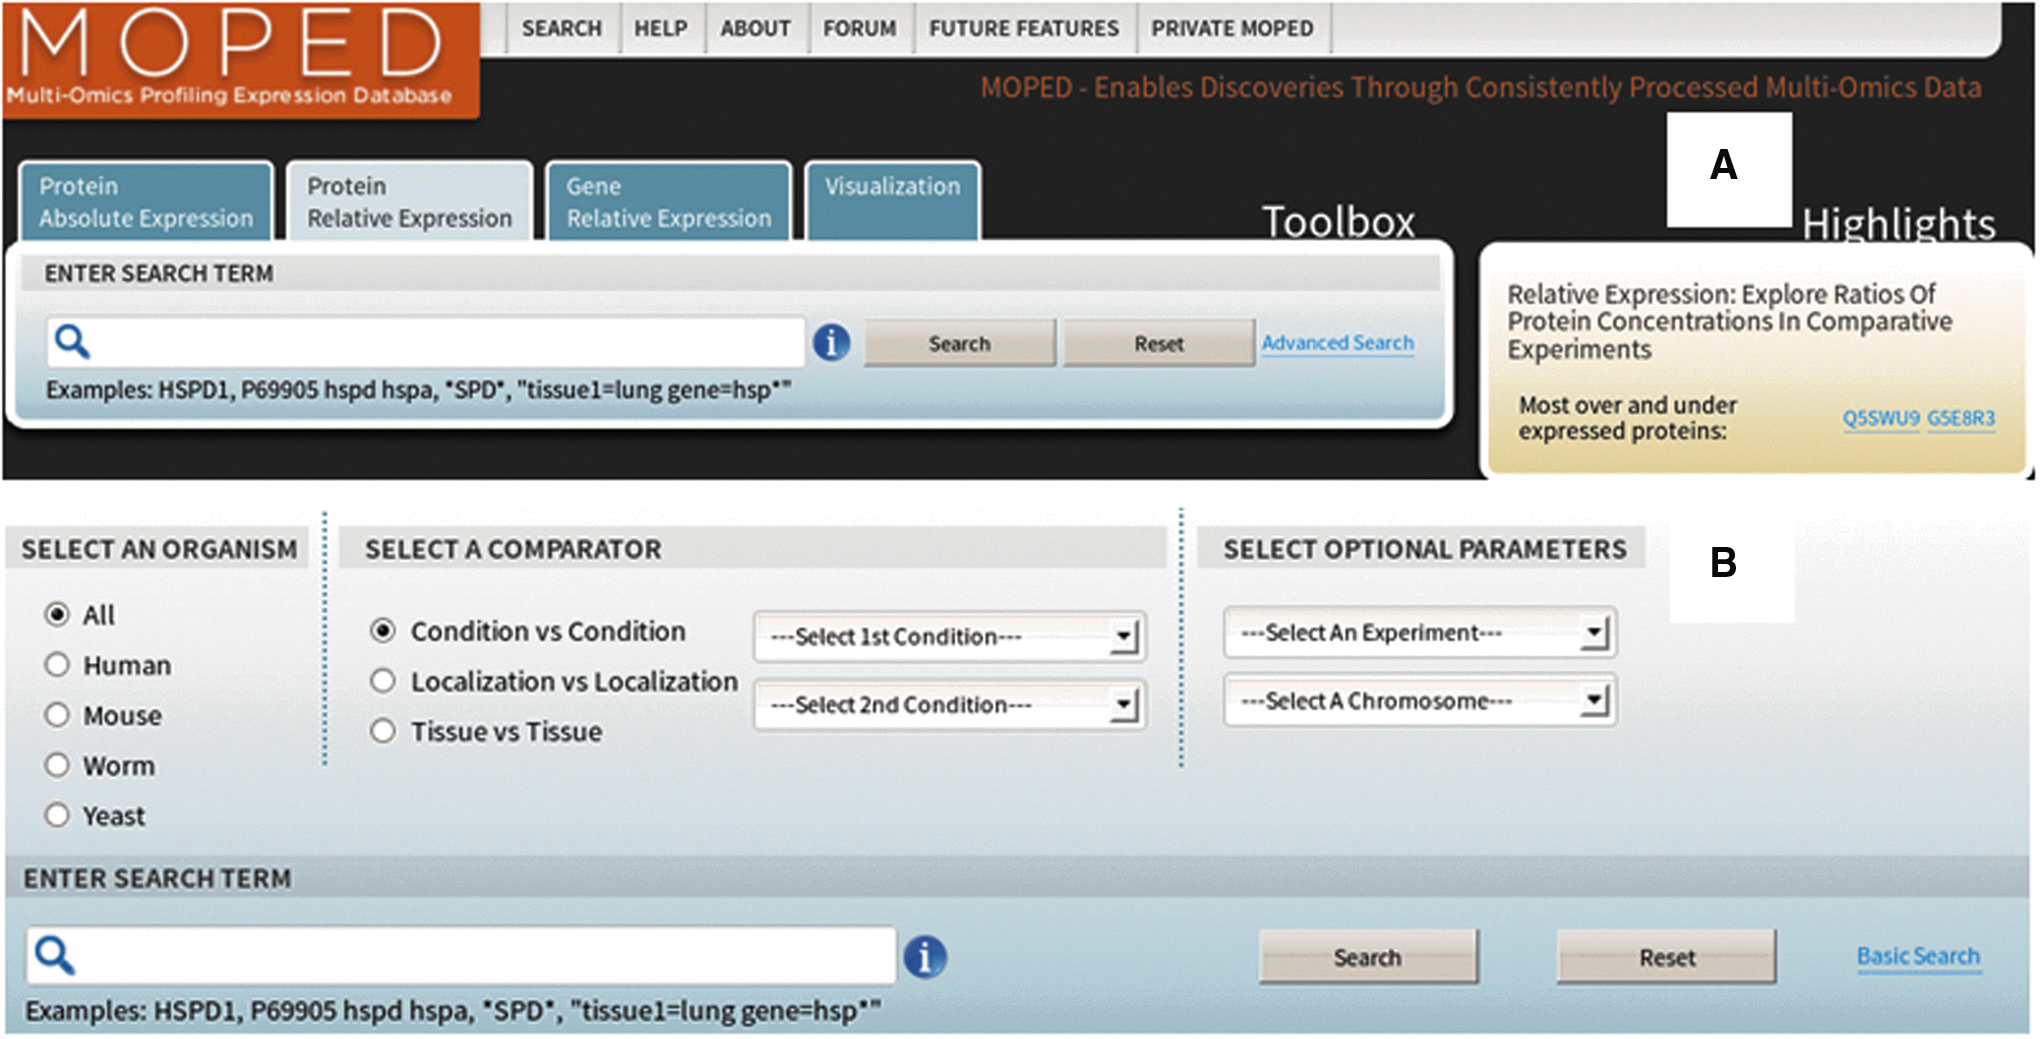
Search options for Relative Expression tab. Both basic
Concise background information on specific proteins and genes can be found on the Protein and Gene Summary pages with corresponding proteins and genes linked, allowing exploration of multi-omics expression. The pages display information such as annotation, chromosome location, expression information, links to pathways from Reactome, PANTHER, and BioCyc, and external links such as GeneCards, NCBI Entrez, and the Protein Data Bank (Ashburner et al., 2000; Benson et al., 2013; Berman et al., 2000; Bult et al., 2007; Caspi et al., 2010, 2014; Cherry et al., 2012; Croft et al., 2014; Donna Maglott et al., 2013; Flicek et al., 2014; Gray et al., 2013; Kanehisa and Goto, 2000; Kanehisa et al., 2014; Mi et al., 2013; Milacic et al., 2012; Pruitt et al., 2014; Rebhan et al., 1997; Stelzer et al., 2011; The UniProt Consortium, 2014; Yook et al., 2012).
Researchers can explore protein and gene expression data in MOPED, along with complementary information about chromosome, pathway, and annotation. Data-driven science tends to begin with data exploration in order to generate hypotheses (Ozdemir et al., 2011b). By providing consistently processed expression data, MOPED becomes a platform for data exploration and can accelerate hypothesis generation. As a resource, MOPED can be used for data validation and exploration (Chen and Penning, 2014; Staneva et al., 2013; Starkey and Tilton, 2012; Williams et al., 2014). Whether starting from a protein or gene ID, an experimental condition, or just a hunch, MOPED offers a way to explore data, share knowledge and find answers.
Protein expression data
Searches within the Protein Absolute Expression tab and Protein Relative Expression tab return both expression data and experiment summaries. For Protein Absolute Expression, the default result expression table includes gene, protein name, concentration (ppm), organism, condition, tissue, and experiment. The extended view has additional fields including concentration (ng/mL, nM), false discovery rate, spectral counts, unique peptides, sequence coverage, and chromosome.
Protein Relative Expression Summary pages display concentration ratios in comparative experiments. This enables users to explore differences in expression across a wide range of condition pairs (e.g., trauma vs. standard, cystic fibrosis vs. standard, HIV positive vs. HIV resistant, and so on). The default view for relative expression summaries includes expression ratios with the corresponding p-value and the false discovery rate available under the extended view (Fig. 2A) (Higdon et al., 2014).
Search results for Protein
Protein Details pages can be accessed by clicking on protein IDs in MOPED. The built-in visualizations for concentrations and relative expression ratios allows for at-a-glance comparisons. Visualizations for that specific protein can also be accessed through the Protein Details page. Absolute and Relative bar charts and matrices display protein expression across tissues, conditions, localization, and experiments (Fig. 3B). MOPED also links to a number of external resources such as GeneCards for additional information (Ashburner et al., 2000; Benson et al., 2013; Berman et al., 2000; Bult et al., 2007; Caspi et al., 2010, 2014; Cherry et al., 2012; Croft et al., 2014; Donna Maglott et al., 2013; Flicek et al., 2014; Gray et al., 2013; Kanehisa et al., 2014; Kanehisa and Goto, 2000; Mi et al., 2013; Milacic et al., 2012; Pruitt et al., 2014; Rebhan et al., 1997; Stelzer et al., 2011; The UniProt Consortium, 2014; Yook et al., 2012). As a complementary resource, GeneCards offers in-depth gene information. GeneCards integrates MOPED's absolute protein expression data to create their own protein expression figure that can be accessed through a link on the MOPED Protein Details page (Rebhan et al., 1997; Stelzer et al., 2011).
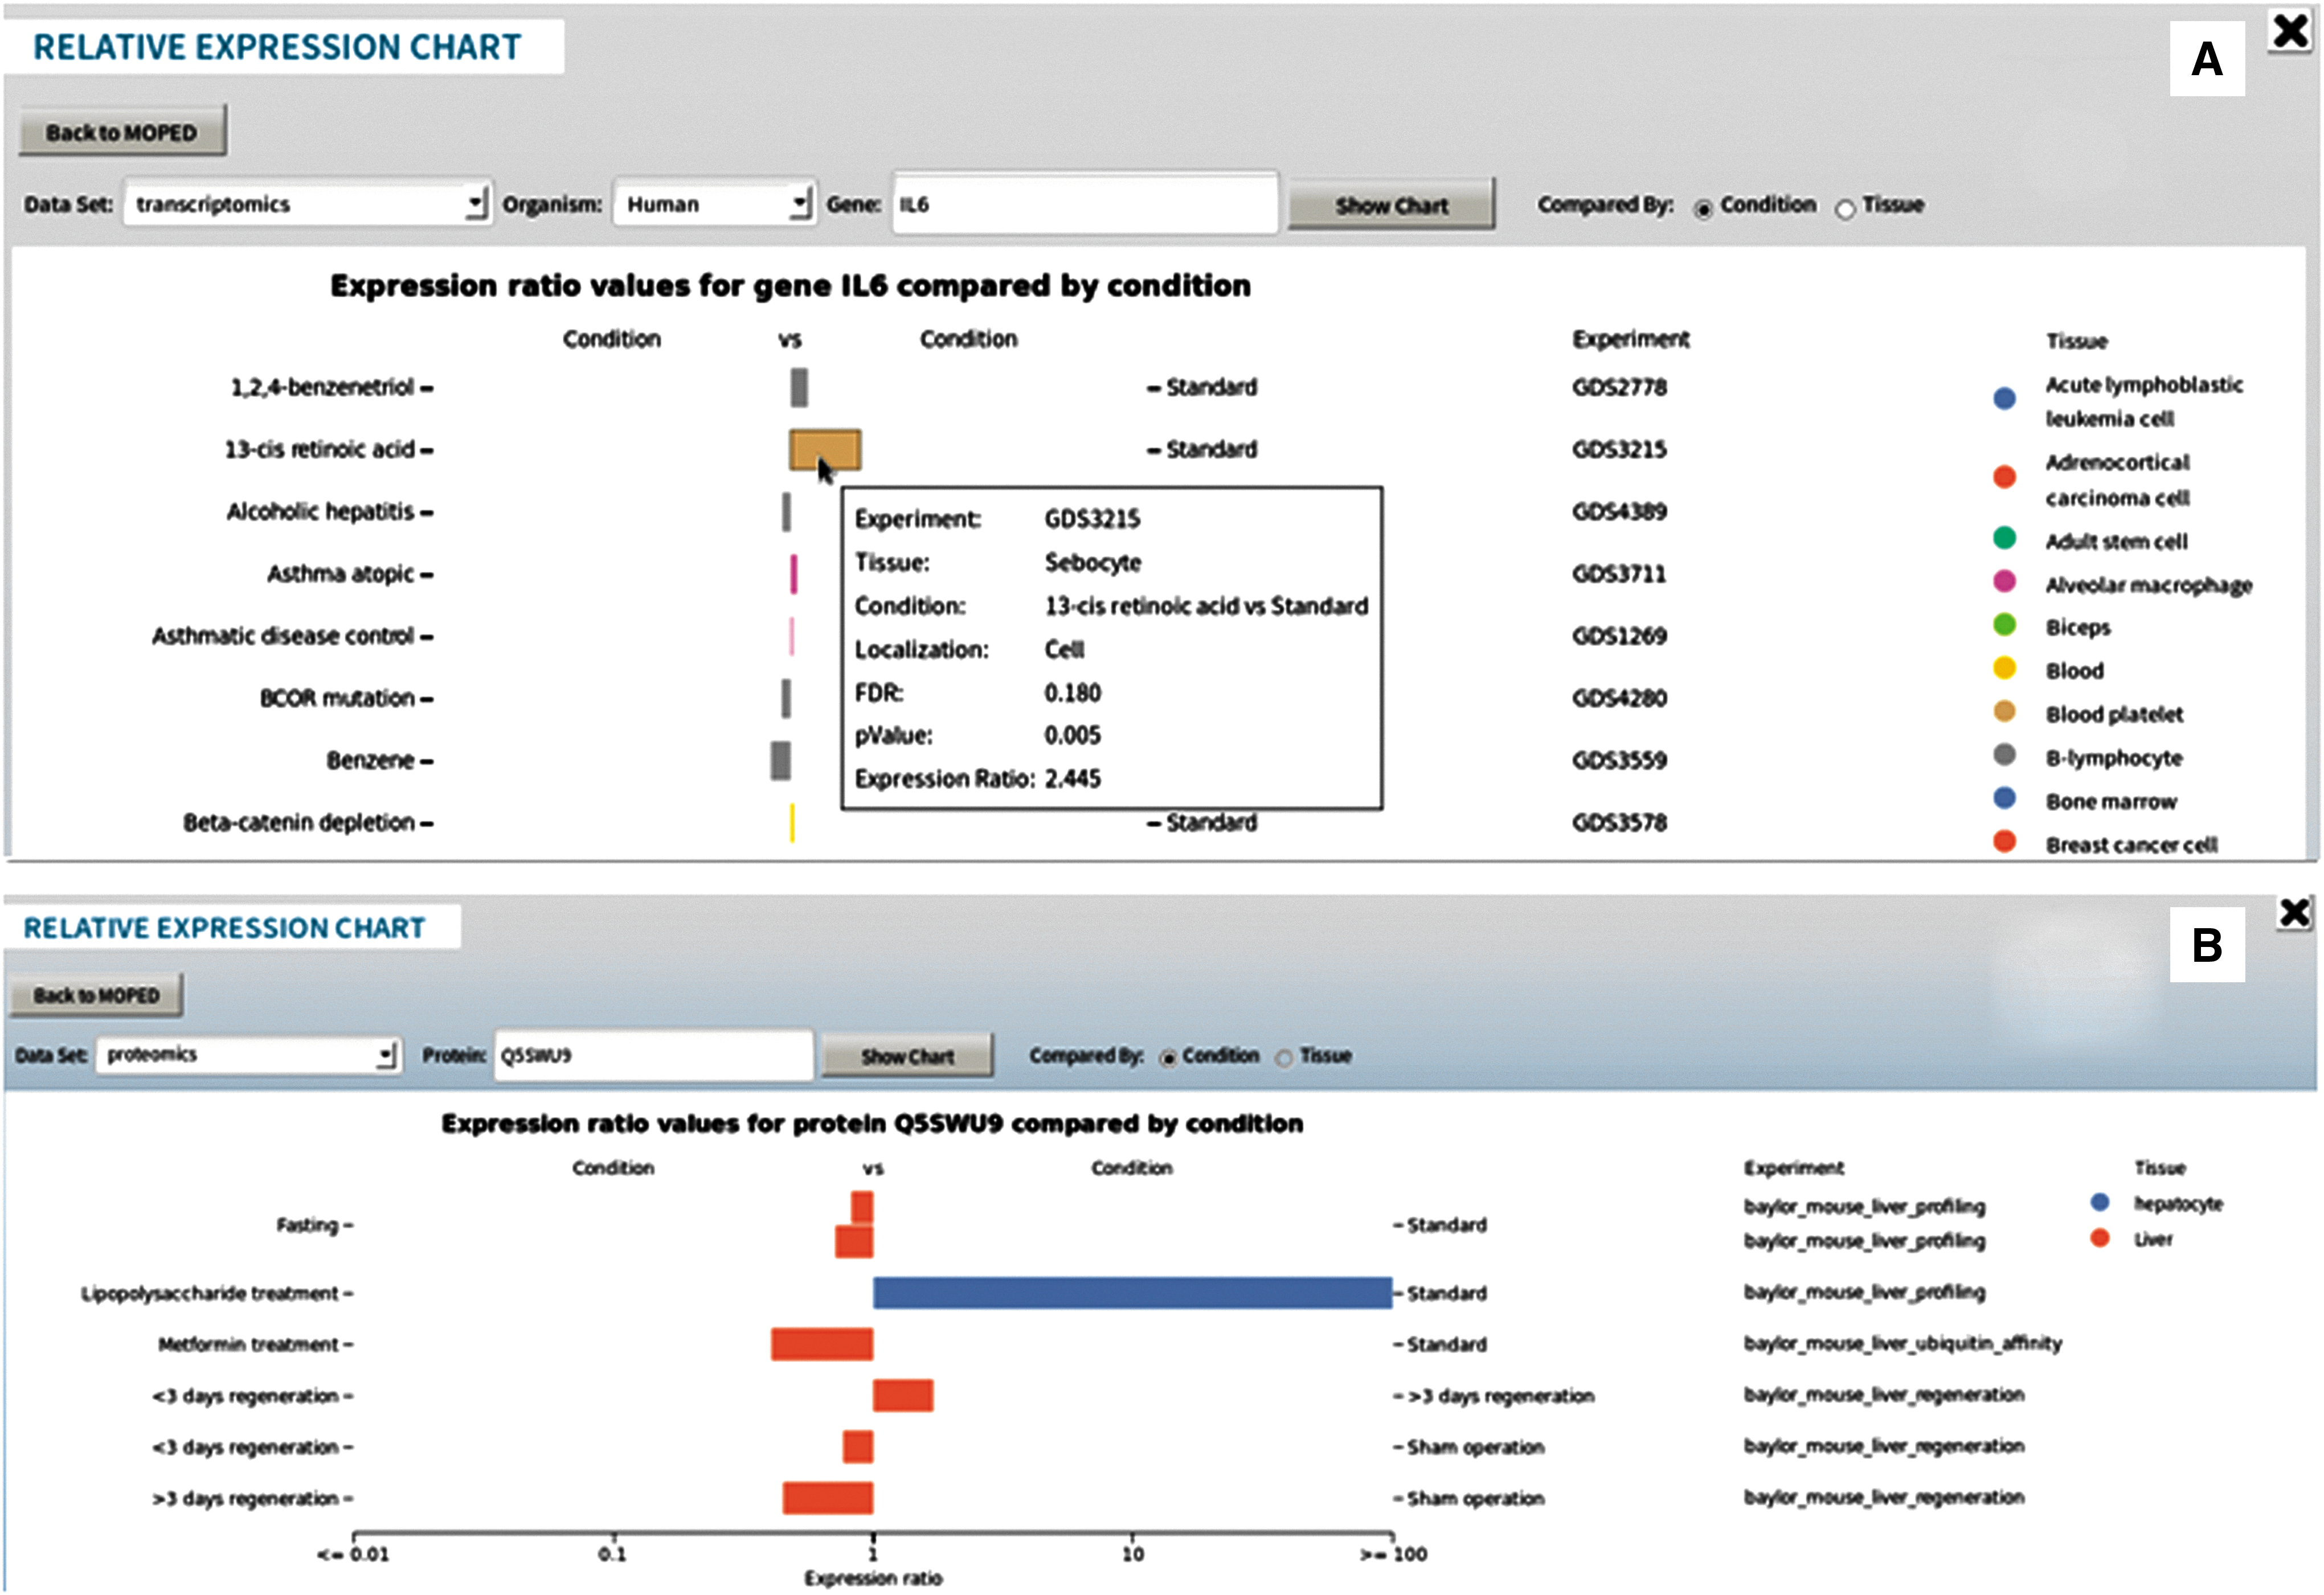
Relative Expression bar chart of genes
Gene relative expression data
As with protein data, the Gene Relative Expression tab offers an intuitive query interface. Searching by keyword, batch, wild card, and advanced search options are available. By default, results display gene symbol, protein ID, expression ratio, organism, condition, tissue/cell type, and experiment. The expanded view includes description, p-value, FDR, localization, and chromosome. Results are sortable by expression ratio, p-value, and FDR (Fig. 2B).
The Gene Details page offers concise gene and expression information. Similar to the Protein Details page, the Gene Details page includes a link to the corresponding protein, chromosome mapping, external links (including GeneCards, NCBI Entrez ID, etc.), gene expression visualizations, and relative expression data (Fig. 4) (Ashburner et al., 2000; Benson et al., 2013; Donna Maglott et al., 2013; Flicek et al., 2014; Gray et al., 2013; Rebhan et al., 1997; Stelzer et al., 2011; Yook et al., 2012). A visual representation of relative expression ratios is integrated into the gene expression table, allowing for simple comparisons. Links between proteins and genes provide a multi-omics understanding of protein and gene expression.
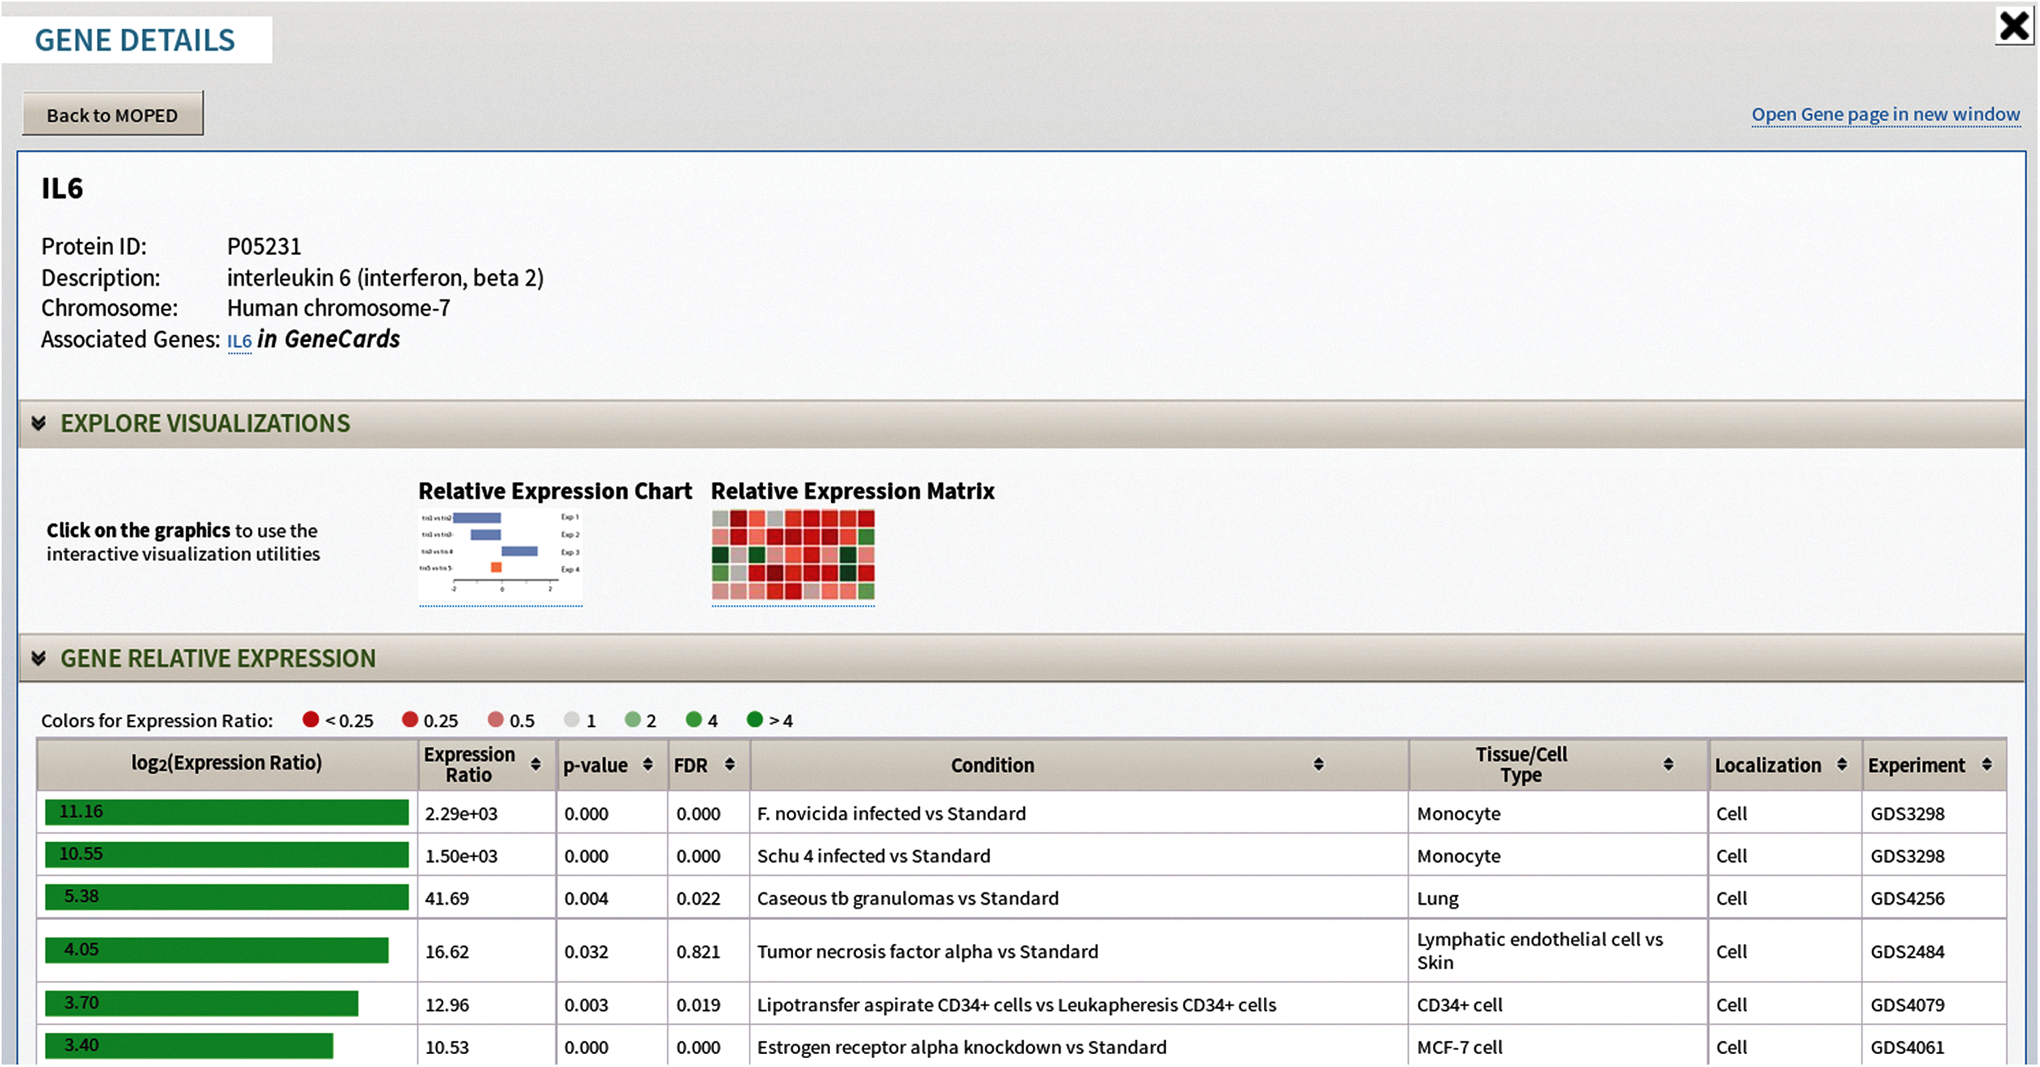
The Gene Details page displays gene specific information. The expression ratio bar chart is color-coded based on expression, providing at-a-glance comparison of relative gene expression.
MOPED aggregates different data sources including gene expression datasets, chromosome mappings, and external IDs to present summarized information to the user. Two of the major challenges of data-driven scientific research are the cleaning of data and the modification of analysis tools (Barga et al., 2011). MOPED's data integration will help scientists explore accurate and consistent gene and protein information without the need for in-house expertise in data management and analysis tool development.
In MOPED 2.5, both protein and gene search results display the corresponding chromosomal location. The advanced search option enables users to retrieve the chromosome-specific data. This feature is aligned with the goals of the Chromosome Centric Human Proteome Project (C-HPP) as it enables researchers to map proteomics expression data to chromosome location (http://www.thehpp.org) (Fig. 5) (Paik et al., 2012).

Relative Expression matrix of neighboring genes along the chromosome. Expression ratios are color-coded by expression and from comparative experiments. Proteins corresponding to neighboring genes along the chromosome can also be displayed in this form.
Experiment metadata
In order to support the goal of reproducible science as pioneered by Nature, MOPED 2.5 now provides detailed experimental metadata, accessible through the Experiment Summary pages (2013b). Endorsed by DELSA Global, the metadata checklist provides information about experimental design, instrument details, sample preparation, data processing, and analysis (Ioannidis and Khoury, 2011; Kolker, 2013; Kolker et al., 2012c; Ozdemir et al., 2011a; 2013a, 2013b). Comprehensive metadata enable researchers to repeat and validate experiments (Ioannidis and Khoury, 2011). By providing metadata, MOPED allows researchers to assess the relevance and usefulness of a given dataset. In addition, the checklists will allow the user to more easily evaluate and integrate diverse data types.
Visualization tools
MOPED 2.5 offers a Visualization tab, which enables graphical exploration of data. Protein absolute expression data in MOPED 2.5 can be seen at a glance on a chord chart relating tissues, conditions, and localizations. Expression bar charts display protein or gene expression across tissues, conditions, and experiments (Fig. 2). The data are grouped by tissue, color-coded by condition, and searchable by ID. Built-in hovering displays detailed experimental information. The bar charts are searchable by protein or gene. Expression matrices display the expression data of one protein or one gene and up to 10 neighboring proteins or genes to build a chromosomal neighborhood view of expression. The expression values are color-coded and listed by tissues, conditions, localizations, and experiments. By facilitating comparisons of protein or gene expression along the chromosome, the expression matrices further advance the efforts of the Chromosome Centric Human Proteome Project (C-HPP) (http://www.thehpp.org) (Fig. 5) (Paik et al., 2012).
Community Involvement: MOPED Forum
Continual improvement and expansion of MOPED are driven by the needs and feedback of the Life Sciences community (Higdon et al., 2014; Kolker et al., 2012c; Ozdemir et al., 2011a). The database was originally created due to survey responses in which researchers stated that a proteomics resource that builds upon already available data repositories would be extremely helpful (Higdon et al., 2013, 2014).
To enable more efficient communication with users, MOPED now includes a public forum that can be accessed through the Forum link on the home page. The science community can post questions that will be answered by the MOPED team, suggest future features for development, and get help with any usage issues. Students are encouraged to participate with an “Ask an Omics Scientist” section providing a discussion opportunity between future and current omics scientists.
Future Features
To give further insight into molecular mechanisms through multi-omics expression data analysis, MOPED plans to integrate pathways and disease information with the currently available data. Comparing the expression of genes and proteins along pathways will uncover intricacies of molecular interactions linked to disease states, leading to further understanding of the disease and ultimately, improved treatments. Using already developed pathway analysis tools, for example DEAP, the expression of proteins and genes can be analyzed along a pathway (Haynes et al., 2013; Subramanian et al., 2005). In addition, data for two other omics, metabolomics and lipidomics, are being assessed for incorporation into MOPED.
Data Submission
Raw or processed omics data (transcriptomics, proteomics, metabolomics, etc.) can be submitted to MOPED by either on-line upload or mailing a hard drive. Researchers, who wish to upload data to public or private MOPED, may contact us on the MOPED Forum (moped-forum.proteinspire.org). Experiment metadata checklists should accompany data and provide accurate experimental and analytical methods in order to increase reproducibility (Ioannidis and Khoury, 2011; Kolker, 2013; Kolker et al., 2012c; Ozdemir et al., 2011a; 2013a, 2013b). Researchers can submit metadata checklists as data publications to journals, for example, OMICS (Snyder et al., 2014). Data can also be uploaded to private MOPED where it can be shared with collaborators and reviewers.
Conclusion
The biological functions of organisms depend on complex and highly interactive systems of biomolecules including RNA, proteins, metabolites, and lipids. These biomolecules are characterized by high-throughput multi-omics data from transcriptomics, proteomics, metabolomics, and lipidomics experiments. Data-enabled biological discoveries require high-throughput data to be integrated and analyzed jointly across multi-omics experiments, yet developing a useful integrated resource is challenging due to the scale of data and complexity of the technologies, formats, ontologies, and methodologies. The collective efforts of multiple disciplines must be used to confront these challenges. MOPED 2.5 has taken a significant step towards overcoming these challenges by becoming a multi-omics database with consistently processed transcriptomics and proteomics data from over 250 experiments.
MOPED 2.5 is a pivotal public database and interdisciplinary knowledge platform for 21st century integrative biology applications from lab to society. Through integrated multi-omics data, MOPED can serve as a platform for multi-omics life science discoveries.
Footnotes
Acknowledgments
We thank Maggie Lackey for her critical reading. Research reported in this study was supported by the National Science Foundation under the Division of Biological Infrastructure award 0969929, National Institute of Diabetes and Digestive and Kidney Diseases of the National Institutes of Health under awards U01DK089571 and U01DK072473, and awards from Seattle Children's Research Institute, The Robert B. McMillen Foundation, and The Gordon and Betty Moore Foundation awarded to E.K. The content is solely the responsibility of the authors and does not necessarily represent the official views of the National Science Foundation, National Institute of Diabetes and Digestive and Kidney Metabolites, Diseases of the National Institutes of Health, Seattle Children's Research Institute, The Robert B. McMillen Foundation, and The Gordon and Betty Moore Foundation.
Author Disclosure Statement
The authors declare no competing financial interests exist.