
Abstract
Abstract
Gliomas are heterogeneous and most commonly occurring brain tumors. Blood–brain barrier restricts the entry of brain tumor proteins into blood stream thus limiting the usage of serum or plasma for proteomic analysis. Our study aimed at understanding the molecular basis of aggressiveness of various grades of brain tumors using isobaric tagging for relative and absolute quantification (iTRAQ) based mass spectrometry. Tissue proteomic analysis of various grades of gliomas was performed using four-plex iTRAQ. We labeled five sets (each set consists of control, grade-II, III, and IV tumor samples) of individual glioma patients using iTRAQ reagents. Significantly altered proteins were subjected to bioinformatics analysis using Database for Annotation, Visualization and Integrated Discovery (DAVID). Various metabolic pathways like glycolysis, TCA-cycle, electron transport chain, lactate metabolism, and blood coagulation pathways were majorly observed to be perturbed in gliomas. Most of the identified proteins involved in redox reactions, protein folding, pre-messenger RNA (mRNA) processing, antiapoptosis, and blood coagulation were found to be upregulated in gliomas. Transcriptomics data of glioblastoma multiforme (GBM), low-grade gliomas (LGGs), and controls were downloaded from The Cancer Genome Atlas (TCGA) data portal and further analyzed using BRB-Array tools. Expression levels of a few significantly altered proteins like lactate dehydrogenase, alpha-1 antitrypsin, fibrinogen alpha chain, nucleophosmin, annexin A5, thioredoxin, ferritin light chain, thymosin beta-4-like protein 3, superoxide dismutase-2, and peroxiredoxin-1 and 6 showed a positive correlation with increasing grade of gliomas thereby offering an insight into molecular basis behind their aggressive nature. Several proteins identified in different grades of gliomas are potential grade-specific markers, and perturbed pathways provide comprehensive overview of molecular cues involved in glioma pathogenesis.
Introduction
G
Cancers are known to carry significant alterations at the molecular level (Calistri et al., 2004), and a number of studies done at the genomic level in the field of glioma (Dunn et al., 2012) indicate that the same applies even in case of glial tumors. Mutations like amplification of EGFR and loss of CDKN2A and PTEN genes are commonly observed in the high-grade gliomas, while mutations in the IDH-1 and IDH-2 genes are common features of LGGs and secondary glioblastomas (Borodovsky et al., 2012; Ohka et al., 2012). These mutations lead to alterations in various signaling pathways like PI3K/Akt/mTOR, PTEN, sonic hedgehog, and notch pathways. However, alterations in posttranslational modifications, which play major role in regulating various metabolic pathways, cannot be detected/identified at the genomic level, making the use of proteomics for better understanding of cancers inevitable (Hanash and Beretta, 2002).
Biological fluids like serum/plasma, cerebrospinal fluid, and urine are good sources for the identification of biomarkers for various diseases (Magni et al., 2010). However, in case of brain tumors, presence of the blood–brain barrier limits the leakage of tumor related proteins into the blood stream, except in high-grade brain tumors where the blood–brain barrier breaches (Kalinina et al., 2011).
Our study aimed at identifying proteomic alterations across different grades of gliomas to understand the pathobiology of the glial tumors and molecular signatures responsible for aggressive nature of high-grade gliomas.
Materials and Methods
Clinical samples
All the proteomic experiments were performed on human biopsy samples obtained after approval from Institutional Review Board of Advanced Centre for Treatment Research and Education in Cancer (ACTREC)—Tata Memorial Hospital (TMH). After obtaining consent from preinformed patients, five tissues each from Grade II, Grade III, and Grade IV were surgically resected. Peritumoral tissues (n = 5), confirmed to be near normal using Immunohistochemistry, were used as control samples. The tissues were snap frozen in liquid nitrogen until further use for experiments. For clinical details refer Supplementary Table S1.
Protein extraction from different grades of glioma tissue
Glioma tissue protein extraction was carried out using TRIzol extraction method (Reddy et al., 2013); the tissue proteins were quantified using 2D-Quant Kit (GE Healthcare) and stored at −20°C until buffer exchange was performed. Detailed methodology is provided in Supplementary Materials and Methods.
Buffer exchange, in-solution digestion, and isobaric tagging for relative and absolute quantification labeling
To label the proteins with isobaric tagging for relative and absolute quantification (iTRAQ) reagents and to perform liquid chromatography–mass spectrometry (LC-MS), the protein samples in rehydration buffer were made LC-MS compatible by exchanging them with 0.5 M TEAB buffer (Triethylammonium bicarbonate buffer) using 3 kDa molecular weight cutoff (MWCO) filters. Fifty micrograms of buffer exchanged protein samples were subjected to denaturation, reduction, and alkylation followed by digestion using trypsin. The trypsin digested control, grade-II, III, and IV tissue protein samples were labeled with iTRAQ reagent 114, 115, 116, and 117, respectively. Labeling reaction was quenched by adding Milli-Q water, and the labeled peptides were pooled.
Offgel fractionation and LC-MS/MS of the labeled peptides
To reduce the complexity of the labeled peptide samples, offgel fractionation was performed using Agilent 3100 offgel fractionator. IPG strips of length 24 cm, pH 3–10 were used, and the peptides were separated based on their pI. Offgel fractionated peptides were subjected to LC-MS/MS in an Agilent 6550 iFunnel Q-TOF equipped with Chip cube and interfaced with nanoflow LC system (Agilent Technologies), and data were analyzed using Spectrum Mill software (Agilent Technologies). For more details refer Supplementary Materials and Methods.
Bioinformatics analysis to identify pathways perturbed in gliomas
Significantly altered proteins were subjected to bioinformatics analysis using Database for Annotation, Visualization and Integrated Discovery (DAVID) v6.7 online tool, which revealed the pathways and biological processes in which the significantly altered proteins are involved (Huang da et al., 2009). Statistical analysis was performed using MetaboAnalyst 3.0 online tool for discriminating different grades of gliomas and control samples (Xia et al., 2015).
Messenger RNA (mRNA) expression data for glioblastoma multiforme (GBM), LGGs, and control samples were downloaded from The Cancer Genome Atlas (TCGA) data portal (https://gdc-portal.nci.nih.gov), and the mRNA expression data were analyzed using BRB-Array tools (http://brb.nci.nih.gov/BRB-ArrayTools) (Simon et al., 2007). Using class comparison module of BRB-Array tools mRNA expression of LGGs and GBMs was compared with control samples. Furthermore, the mRNA expression data were correlated with protein expression data obtained from our quantitative mass spectrometry studies.
Cell line details
Human glioblastoma cell line LN18 was purchased from cell repository, National Centre for Cell Science (NCCS, Pune, India). The cells were cultured in sterile Dulbecco's modified Eagle's medium (DMEM) supplemented with 10% of fetal bovine serum (FBS), 100 U of Penicillin, and 100 μg/mL of Streptomycin. Cell lines were allowed to grow at 37°C and 5% CO2 in an incubator.
Transfection
The human genes CRYAB and SNCA were subcloned into mammalian expression vector pcDNA3-EGFP, and the gene constructs were transfected into LN18 cells. Transfection was performed using BBS-CaCl2 method (Chen and Okayama, 1987). After 48 h posttransfection, cells were observed under fluorescence microscope for the positively transfected cells. For more details refer Supplementary Materials and Methods.
Proliferation assay
Using MTT assay proliferation rates of transfected and control cell lines were measured (Xu et al., 2017). In a 96-well culture plate 1 × 10⁴ cells (per 100 μL of complete media), which were transiently transfected with CRYAB_pcDNA3-EGFP or SNCA_ pcDNA3-EGFP or pcDNA3-EGFP (control) constructs, were seeded into each well in triplicates and cultured for 5 days. Twenty microliters of MTT (stock concentration = 5 mg/mL) was added to each well and incubated for 4 h followed by addition of 150 μL of DMSO (Dimethyl sulfoxide) to dissolve the formazan crystals. Absorbance was recorded at 490 and 570 nm using enzyme-linked immunosorbent assay (ELISA) plate reader (Thermo Fisher). Net optical density (OD) at 490 nm was plotted against time (number of days). All the values were background corrected using the absorbance values obtained for blank. For more details refer Supplementary Materials and Methods.
Results
Comparison of different grades of glioma tumor tissue proteome using iTRAQ method
Tissue proteomic analysis of grade II, III, and IV gliomas with respect to peritumoral tissues (control) was performed using iTRAQ based mass spectrometry approach. Total 171 proteins were identified with at least two unique peptide signatures (false discovery rate [FDR] ≤1%) using LC-MS/MS. Proteins common in a minimum of three out of five sets were subjected to further bioinformatics analysis. Extensive literature survey for proteins identified in our study revealed the expression profiles to be in accordance with those reported by other groups (Supplementary Fig. S1). Partial list of a few differentially expressed proteins is provided in Table 1 and complete list in Supplementary Table S2. Peptide sequences and length of the peptides for the identified proteins are represented in Supplementary Table S3. Box plots of few differentially expressed proteins and representative mass spectra in various grades of gliomas are shown in Figure 1.
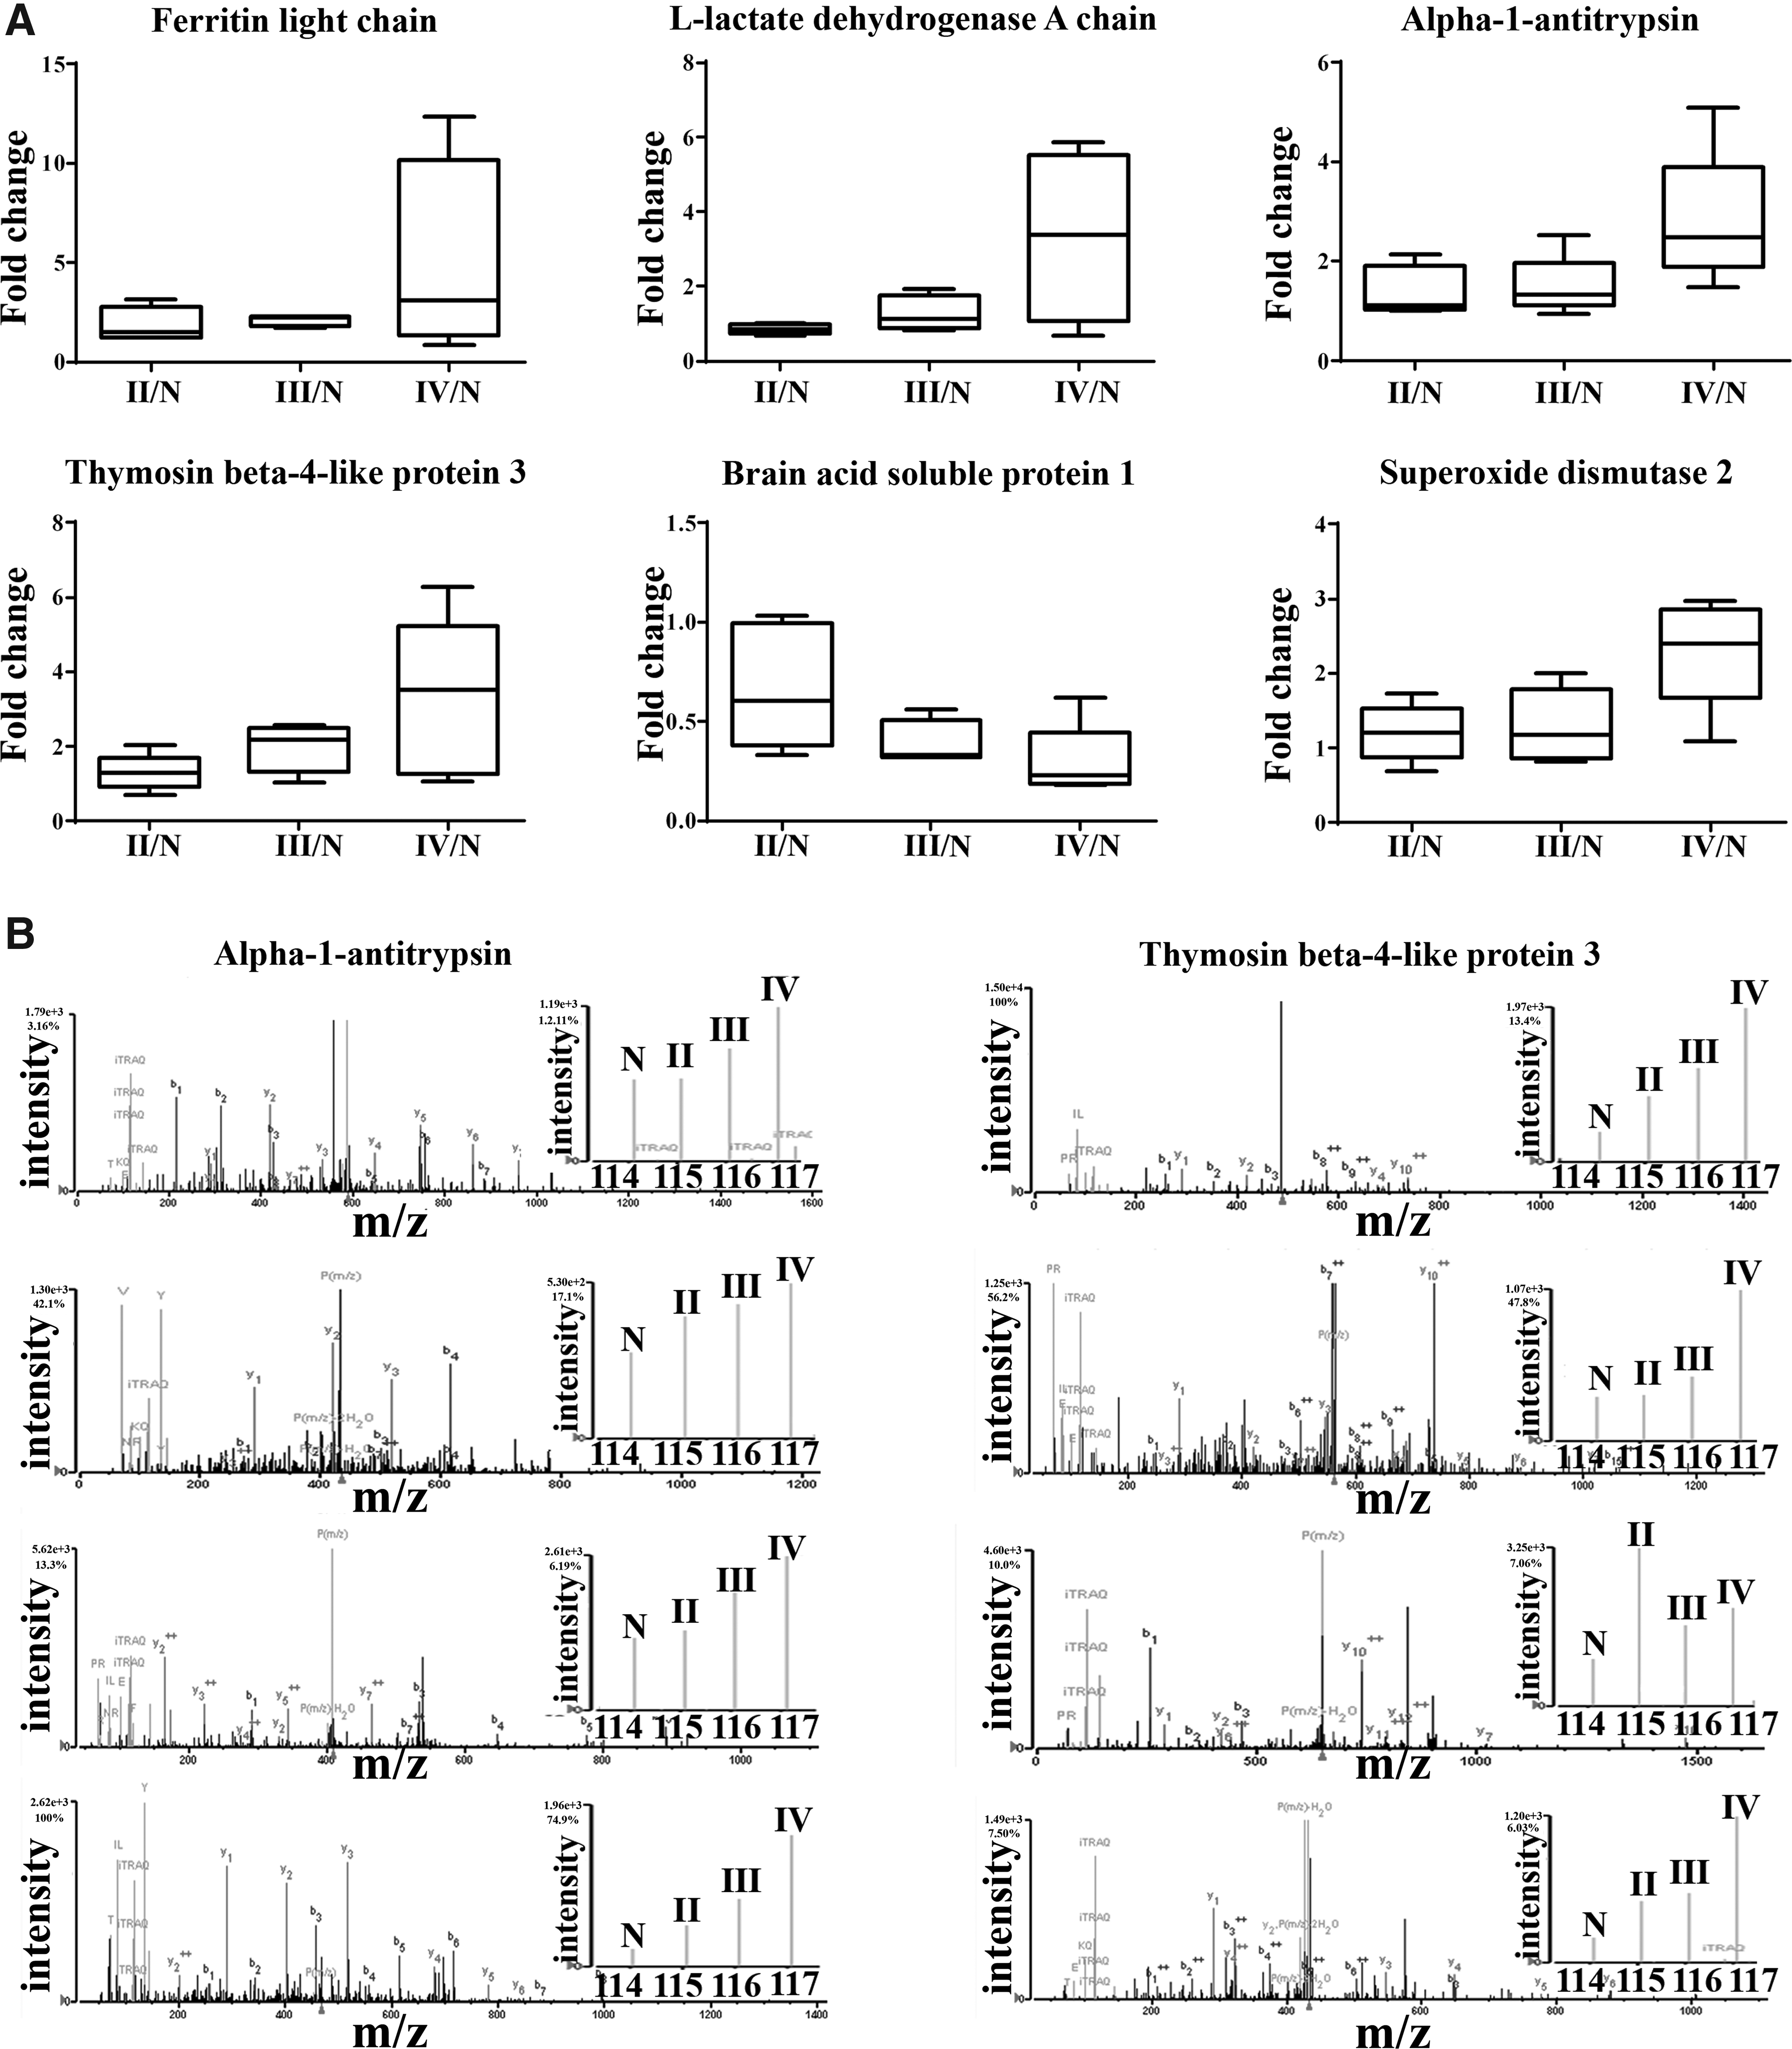
Tissue proteomic analysis of different grades of gliomas using iTRAQ method.
Quantitative proteomic data obtained from the tissue proteomic analysis of different grades of gliomas were subjected to statistical analysis using MetaboAnalyst 3.0. Partial least square discriminant analysis yielded a panel of 15 proteins with variable importance of projection (VIP) >1.5 that could differentiate between control, grade-II, III, and IV gliomas on three-dimensional (3D) score plots (Fig. 2).
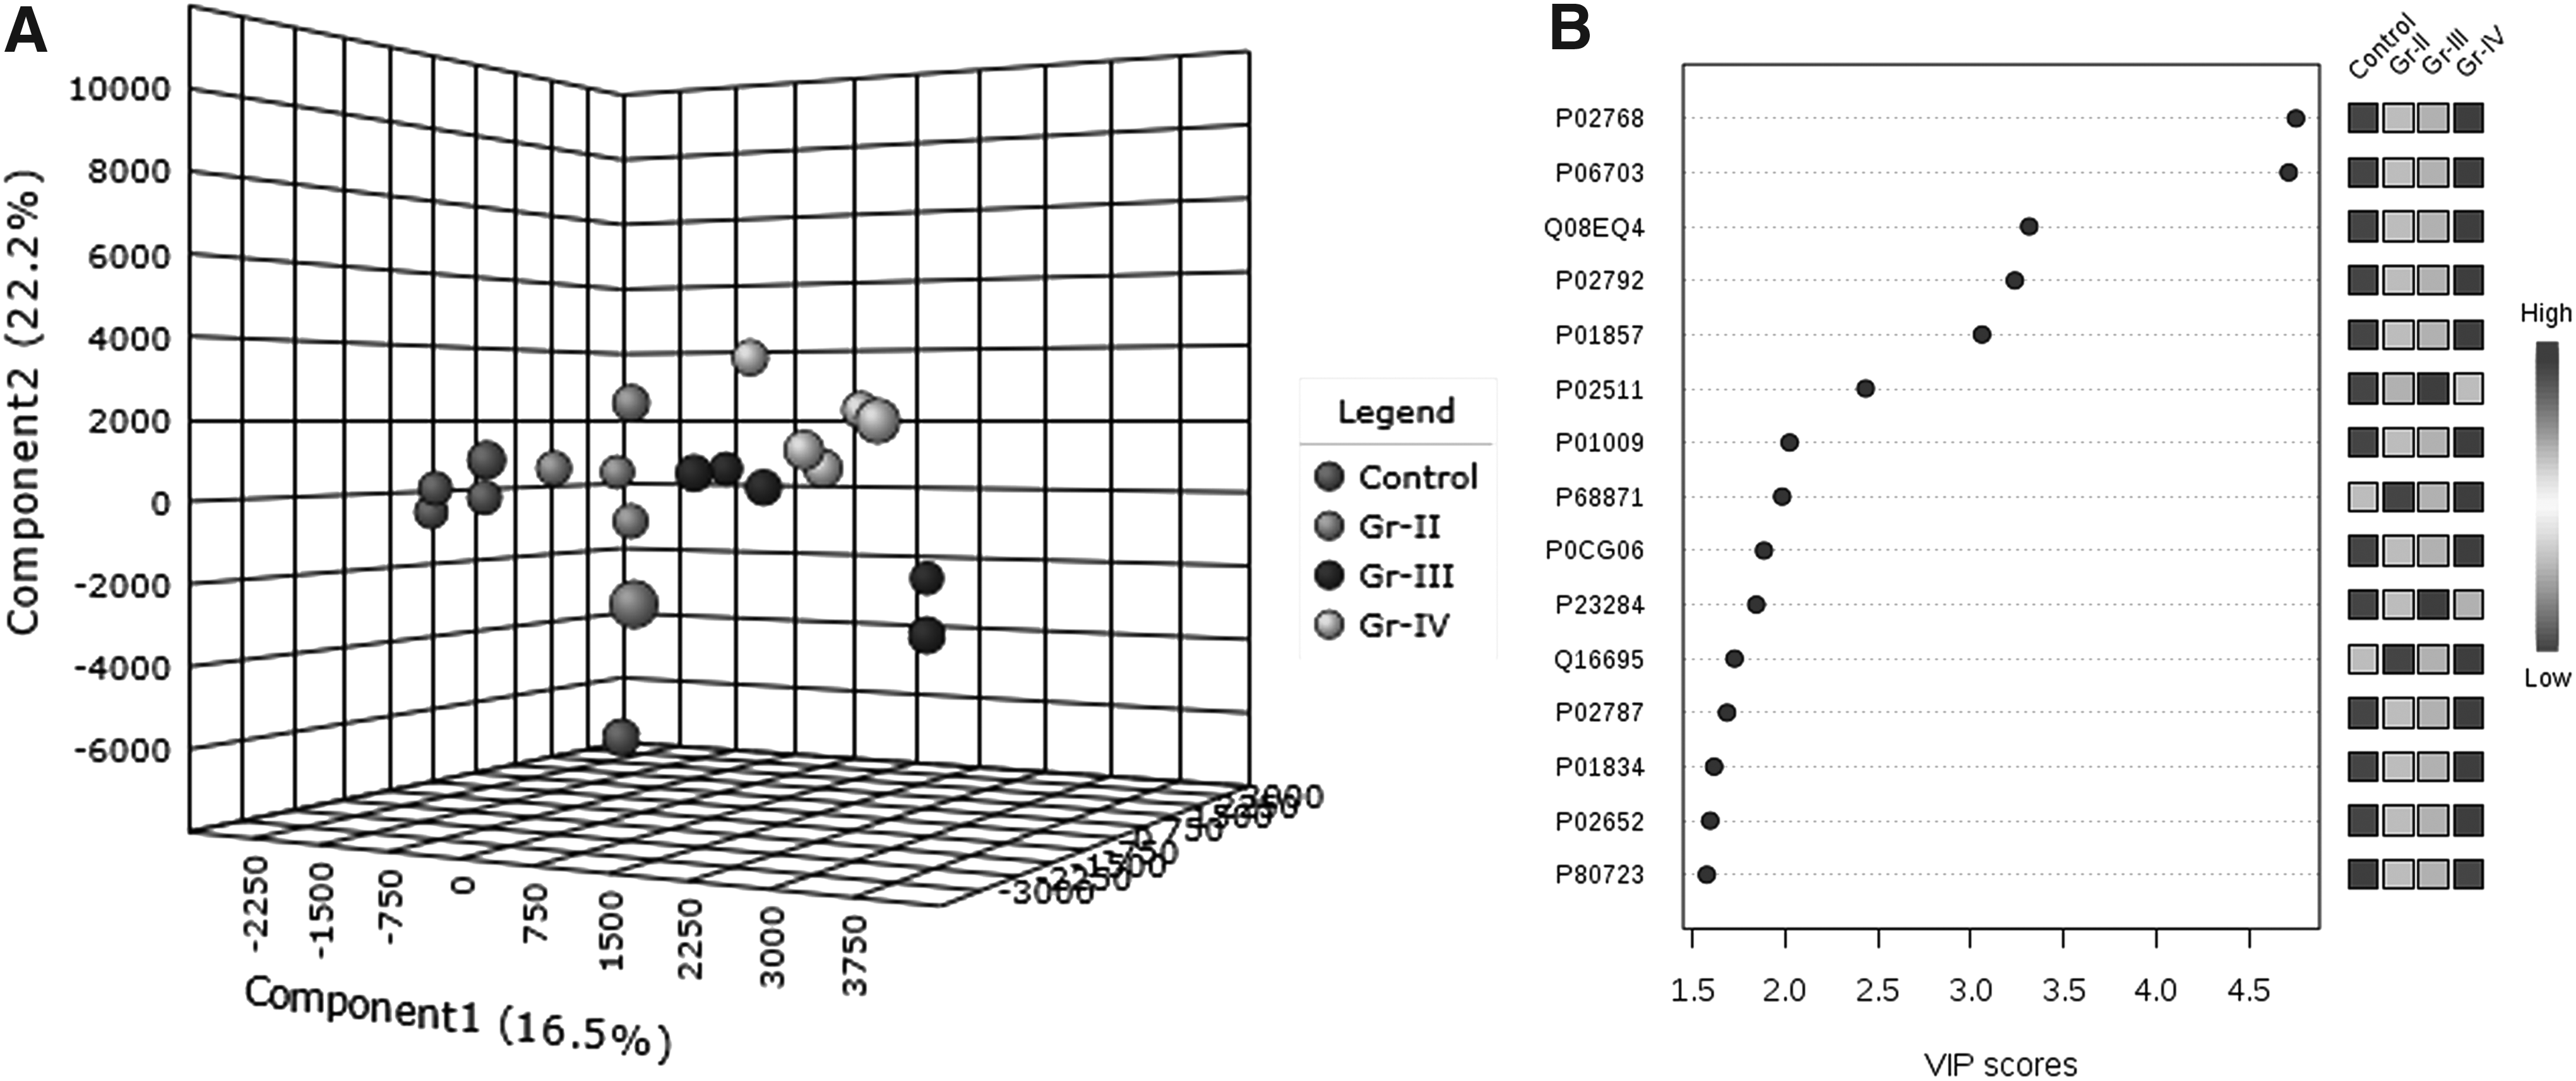
Statistical analysis of brain tissue proteins identified in the current study using MetaboAnalyst 3.0.
Protein expression data from the current study were compared with TCGA transcriptomics data of LGGs and GBM. Total 44 common genes/proteins were identified in the comparison of TCGA LGG transcriptomics data with our iTRAQ data, of which 32 genes/proteins exhibited similar trends and the remaining 12 exhibited opposite trends (Supplementary Table S4). Comparison of TCGA GBM mRNA expression data with our iTRAQ data revealed 70 common genes/proteins of which 51 genes/proteins showed similar trends and the remaining 19 showed opposite trends (Supplementary Table S5).
Proliferation assay was performed using MTT reagent to check the effect of overexpression of CRYAB and SNCA genes on LN18 cells, where empty pcDNA3-EGFP transfected LN18 cells were used as control. Cells overexpressing SNCA exhibited lower proliferation rates than those cells which were overexpressing CRYAB or EGFP (control) (Fig. 3).
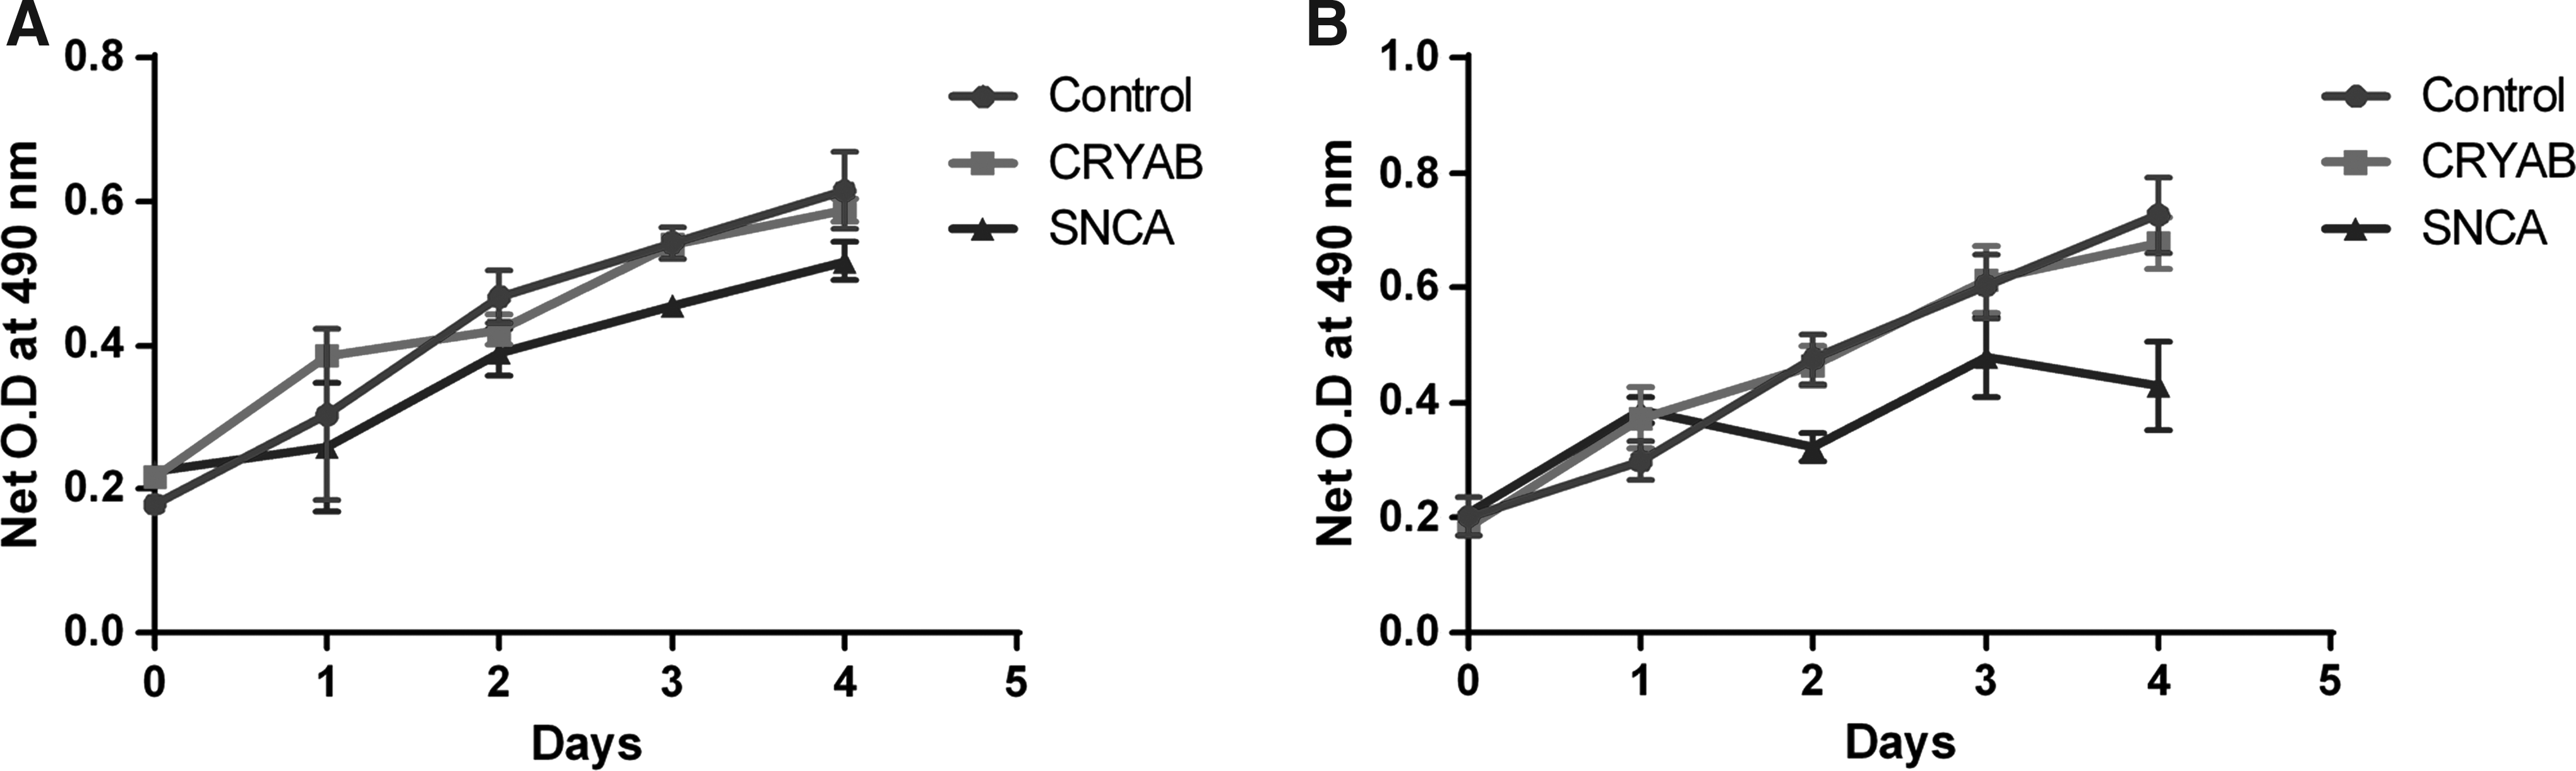
Proliferation assay in LN18 cells transfected with control and CRYAB and SNCA gene constructs.
Discussion
In this study we performed a comprehensive proteomic analysis of different grades of glioma patients using iTRAQ-based mass spectrometry approach. Significantly altered proteins were subjected to gene functional annotation analysis using DAVID. Comparison of tissue proteome of various grades of gliomas indicated a significant alteration of proteins involved in several metabolic pathways associated with neurodegenerative disorders, integration of energy metabolism, carbohydrate, amino acid, pyruvate metabolism, antigen processing, and presenting pathways (Fig. 4 and Supplementary Table S6). A few proteins associated with the cell cycle regulation and proliferation were found to be altered in gliomas. Pathway mapping of proteins identified from the iTRAQ based mass spectrometry experiments was performed using KEGG Mapper (Supplementary Fig. S2) (Kanehisa et al., 2017).
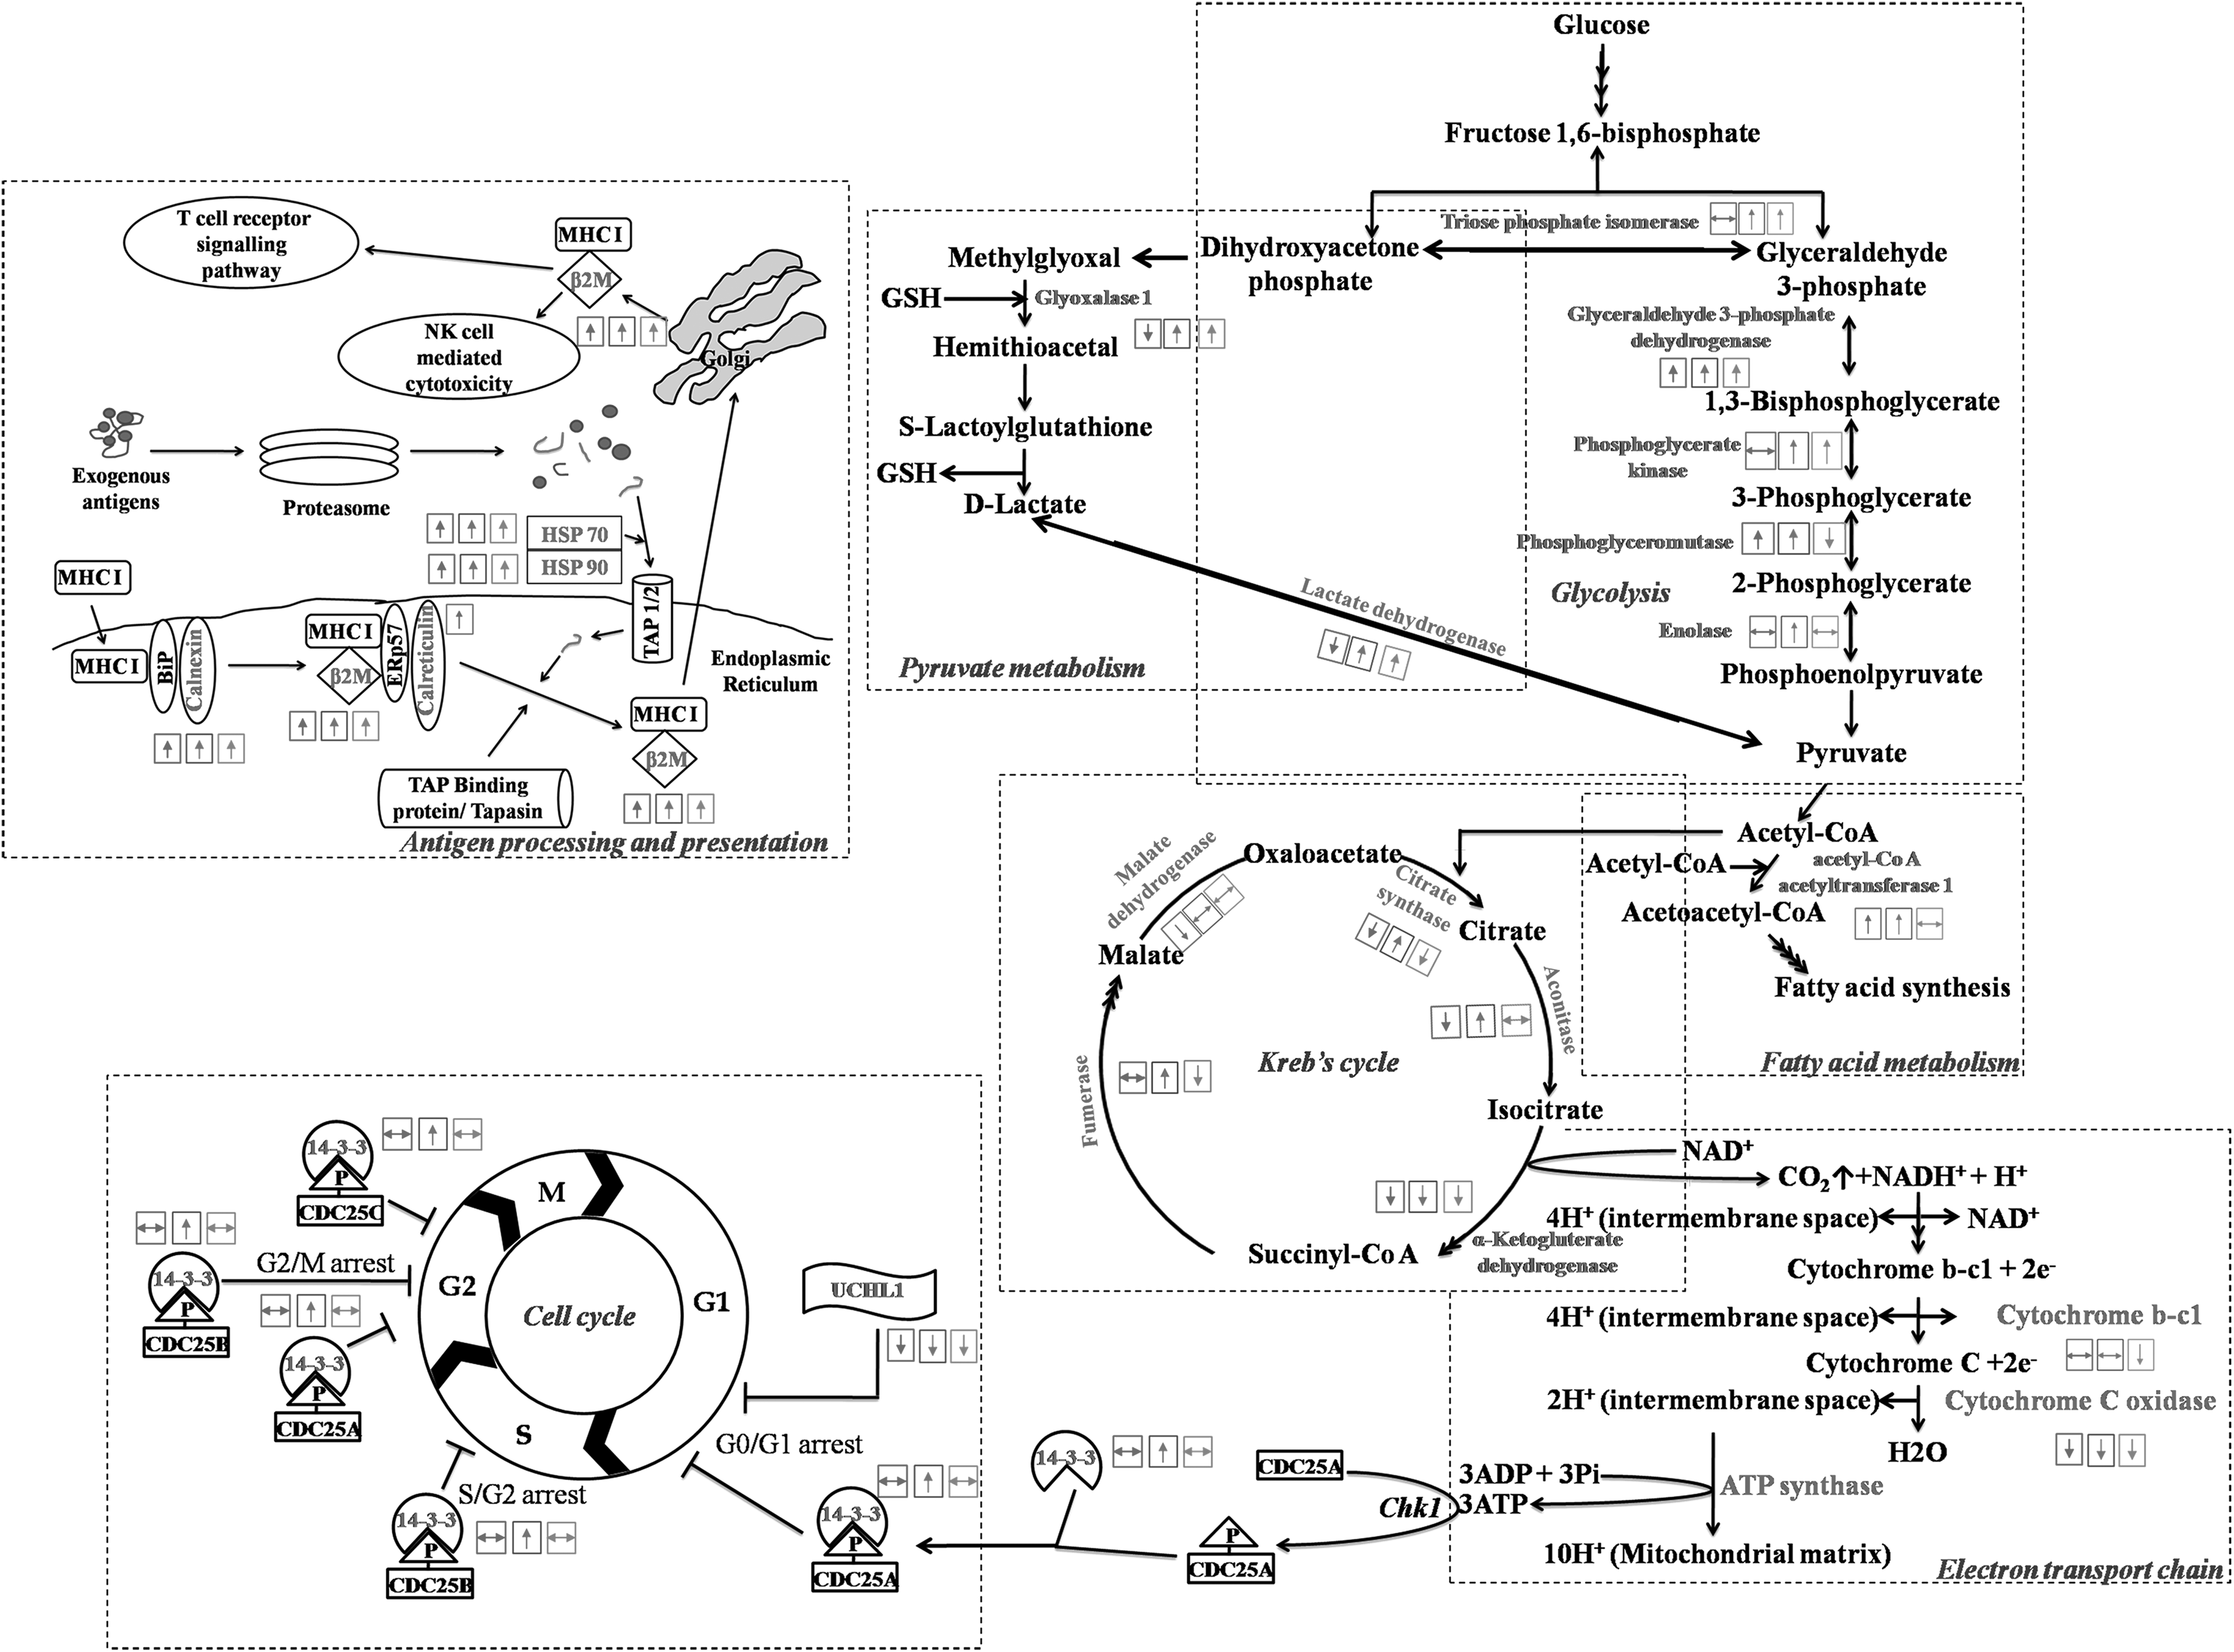
Pathway analysis of significantly altered proteins using DAVID, an online tool. Comprehensive pathway analysis using differentially expressed proteins in various grades of gliomas suggests major perturbation in metabolic pathways. The proteins were mapped in these pathways to identify their role in cell metabolism, particularly energy metabolism. Boxes on top of the proteins (left to right) indicate their expression in glioma grade-2 (left hand side box), grade-3 (middle box), and grade-4 (right hand side box) with respect to control brain tissue. DAVID, Database for Annotation, Visualization and Integrated Discovery.
Most cancer cells depend on glycolysis to meet their energy demands (Pelicano et al., 2006). In our study, we found differential expression of various proteins associated with energy metabolism such as triose phosphate isomerase, glyceraldehyde-3-phosphate dehydrogenase, phosphoglycerate mutase 1, phosphoglycerate kinase 1, and
Proteins associated with cell cycle regulation and cell proliferation like ubiquitin carboxyl-terminal hydrolase isozyme L1 (UCHL1), Peroxiredoxin-1, 60 kDa heat shock protein, mitochondrial (HSPD1), and 14-3-3 family of proteins were found to be differentially expressed in gliomas. UCHL1 is a deubiquitinating enzyme found to be differentially expressed in various cancers (Hibi et al., 1999; Takase et al., 20l3; Tezel et al., 2000), although its exact role in cancers remains controversial. UCHL1 gene knockdown studies in ovarian cancer cell lines showed increased cell proliferation and decreased apoptosis (Jin et al., 2013), whereas overexpression of UCHL1 in gastric cancer cells increases cell migration and invasion through the activation of Akt and Erk1/2 pathways (Gu et al., 2015). Increased expression of UCHL1 protein in breast cancer cell lines reduced the rate of cell proliferation by arresting the cells in G0/G1 phase of cell cycle (Xiang et al., 2012). Our results provide a plausible explanation for the high proliferative potential of gliomas arising from perturbation of key cell cycle regulatory proteins.
Proteins associated with coagulation pathway like alpha-1 antitrypsin (SERPINA 1) and fibrinogen alpha and gamma chains were found to be upregulated in gliomas. SERPINA 1 is a glycoprotein, which irreversibly inhibits the activity of serine proteases and is found to be expressed in various human tissues like liver, brain, kidney, testes, pancreas, and gastrointestinal tract (Carlson et al., 1988). Increased levels of SERPINA 1 reported earlier in case of brain tumors were found to correlate with greater invasiveness of the tumor cells. The increase in SERPINA 1 levels is probably in response to proteolysis of extracellular matrix, which further reduces the inflammatory response generated (Sawaya et al., 1987).
AAT showed positive correlation with the grade of the tumor in our study where expression was observed to increase with progression from low- to high-grade tumors. Fibrinogen forms fibrin clots at sites of injury and is an important component of blood coagulation pathway. Soluble fibrinogen interacts with integrins, nonintegrins, and other extracellular components and has been known to enhance the metastatic potential of tumor cells. Degradation products of fibrin increase angiogenesis, suppress immunological reactions, and increase cell proliferation (Hatzfeld et al., 1982; Plow and Edgington, 1986; Thompson et al., 1992). In our study, we observed a positive correlation between the expression of fibrinogen alpha and gamma chains during the progression from low- to high-grade tumors. Thus, perturbation of proteins involved in blood coagulation seems to be a key event in gliomagenesis, and further validation of these proteins could provide a better understanding of disease pathobiology.
Protein disulfide isomerase (PDI), a chaperone protein, plays a role in formation of functional protein by catalyzing disulfide bond breakage and reformation in the endoplasmic reticulum. Increased levels of PDI have been reported in various metastatic and invasive cancers like breast, prostate, hepatocellular carcinoma, and glioblastoma (Goplen et al., 2006; Maresh et al., 2010; Salmans et al., 2013; Shuda et al., 2003). The significance of PDI in glioma cell migration and invasion was first shown by Goplen et al. (2006) by carrying out PDI inhibitory studies in human glioma models.
Our study revealed an increase in PDI levels in gliomas. Nucleophosmin (NPM) is a nucleolar chaperone protein, which prevents the aggregation of denatured proteins (Szebeni and Olson, 1999). NPM regulates cell proliferation by binding to unduplicated centrosomes and prevents the cell's entry into S-phase of cell cycle. Once the centrosomes are duplicated, NPM is removed from the centrosomes by the action of CDK2/Cyclin E mediated phosphorylation (Okuda et al., 2000). NPM binds to a tumor suppressor protein Arf at the N-terminus, preventing the binding of Mdm2 to Arf protein resulting in the free Mdm2 protein. Mdm2, a negative regulator of p53, suppresses the expression of p53 gene thus resulting in the uncontrolled cell proliferation and negative regulation of apoptosis (Bertwistle et al., 2004; Sherr, 2001). NPM has been reported to be upregulated in the early stages of thyroid cancers (Pianta et al., 2010), and it's overexpression in HT29 cell lines was observed to have resulted in increased cell migration and invasiveness (Liu et al., 2012).
In our study, we identified increased expression of chaperone proteins like NPM, protein disulfide-isomerase A3, HSP-90, and calnexin in various grades of tumors. The roles of chaperones in regulating processes like apoptosis, cell migration, and invasion suggest their involvement in glioma pathogenesis.
Accumulation of free radicals in the mitochondria results in the oxidative damage of the mitochondrial membranes and releases cytochrome c into the cytosol, which leads to cell death by apoptosis. Actively proliferating cancer cells circumvent this problem by producing large amounts of superoxide dismutase (SOD), which scavenges oxygen radicals and protects the cancer cells from oxidative damage (Huang et al., 2000). In our study we observed a positive correlation between SOD2 and different grades of glioma. Overexpression of alpha-synuclein in U373 glioma cell lines showed increased apoptosis due to the activation of caspases (Stefanova et al., 2003). Annexin A1, reported to be upregulated in grade-IV astrocytomas (Mulla et al., 2004), is a calcium and phospholipid binding protein and plays a major role in immune suppression by inhibiting the synthesis of eicosanoids and phospholipase A2 (Weyd et al., 2013).
In addition to its role in apoptosis, annexin A5 promotes glioma cell invasion, chemoresistance, and increases the activity/expression of matrix metalloproteinase-2 (Wu et al., 2014). A study by Qing et al. (2008) using NPM gene knockdown showed that reduced NPM protein levels induced apoptosis and decreased proliferation rates in neural stem cells. In our study SOD2, annexin A1 and A5, and NPM levels were observed to be upregulated in gliomas, while alpha synuclein was found to be downregulated suggesting an important role of oxygen radical scavenging and oxidative damage in glioma progression.
We observed an increase in the expression of proteins involved in redox reactions such as thioredoxin, peroxiredoxin-1, and ferritin light chain with increase in the grade of the tumor. Thioredoxin is a disulfide reducing protein, and in addition to its role as a growth promoting factor in leukemic cells (Rosen et al., 1995), it also helps cancer cells escape from apoptosis (Nakamura et al., 1997) and increases angiogenesis by inducing expression of HIF-1 and VEGF (Welsh et al., 2002).
Peroxiredoxin is involved in various biological processes such as scavenging of hydrogen peroxide radicals (O'Leary et al., 2014), cell motility, and cell invasion (Taniuchi et al., 2015). Ferritin is an iron binding protein, which sequesters the free iron ions thus protecting the cells from oxidative damage (Cohen et al., 2005). The expression of ferritin has been reported to be directly proportional to cellular iron levels (Cairo et al., 1985). Tumor cells require large amounts of iron, as cofactor for proteins involved in energy production, DNA synthesis, and cell cycle regulation to meet with their metabolic processes. Accumulation of large amounts of iron in tumor cells (Freitas et al., 2007) has been established to play a role in tumor immunosuppression thus helping them escape from the host immune system (Elliott and Head, 2012). Involvement of the above redox proteins in cell cycle and angiogenesis provides an explanation to the increase in the levels of these proteins with increase in grade of the tumor.
Proliferation rate of LN18 cells transfected with SNCA gene construct was observed to be decreased compared to that of LN18 cells transfected with either CRYAB gene construct or control vector. This reduction in rate of proliferation can be attributed to the interference of the SNCA gene product with that of the cell cycle progression or its role in induction of apoptosis. However, LN18 cells transfected with CRYAB gene construct showed no alteration in the rate of proliferation compared with that of the cells transfected with control vector. These results are in sync with the iTRAQ based mass spectrometry experiments performed in the current study which revealed that SNCA was downregulated in all the grades of glioma compared to its expression in the control tissues. This downregulation might be responsible for increasing the tumor growth either by increasing the rate of proliferation or by inhibiting cell death.
Concluding Remarks
In summary, this comprehensive proteomics analysis of different grades of gliomas revealed proteins associated with major pathways like glycolysis/gluconeogenesis, lactate metabolism, oxidative phosphorylation, coagulation cascades, apoptosis, and cell cycle. The increased expression of proteins like ferritin light chain, alpha-1 antitrypsin, thymosin beta-4-like protein 3, and LDH-A chain with increase in the grades of the tumors provides a plausible explanation toward the aggressive nature of high-grade tumors over low-grade tumors and could be potential markers of disease progression. Ectopic expression of SNCA gene construct in LN18 cell line revealed role of SNCA in suppression of tumor growth. Although the current study provides mechanistic cues of increased aggressive nature of high-grade brain tumors, further validation of several candidate proteins identified from this study may offer identification of grade-specific protein markers and better insight into the molecular basis of glioma pathogenesis.
Footnotes
Acknowledgments
This research was supported by Department of Biotechnology (DBT) (No. BT/PR14359/MED/30/916/2010, BT/PR4599/BRB/10/1042/2012) Government of India. K.G. was supported by Council of Scientific and Industrial Research (CSIR) Senior Research Fellowship.
Author Disclosure Statement
The authors declare that no conflicting financial interests exist.
Abbreviations Used
References
Supplementary Material
Please find the following supplemental material available below.
For Open Access articles published under a Creative Commons License, all supplemental material carries the same license as the article it is associated with.
For non-Open Access articles published, all supplemental material carries a non-exclusive license, and permission requests for re-use of supplemental material or any part of supplemental material shall be sent directly to the copyright owner as specified in the copyright notice associated with the article.