
Abstract
Abstract
Despite decades of investment in biomarker research, we still do not have robust and field-tested biomarkers for many chronic diseases so as to anticipate clinical outcomes and thus move toward personalized medicine. Biomarker innovations have tended to focus on genomics, but next-generation biomarkers from the nascent field of glycomics now offer fresh vistas for innovation in chronic disease biomarkers and systems diagnostics. Glycosylation, regarded as a complex enzymatic process where sugars (glycans) bind to proteins and lipids, affects many human biological functions, including cell signaling, adhesion, and motility. Notably, and contrary to proteins, glycan biosynthesis does not require a template; rather its final structure is catalyzed by a repertoire of enzymes that attach or detach monosaccharides in the glycosylation pathway, making glycomics research more challenging than proteomics or genomics. Yet, given glycans' biological significance, alterations in their processing may be detrimental to human health and also offer insights for preventive medicine and wellness interventions. Therefore, studying glycans' structure and understanding their function and molecular interactions in the emerging field of glycomics are key to unraveling the pathogenesis of various common chronic diseases. This review summarizes the major concepts in glycomics, including glycan release methods, techniques for large-scale glycan analysis, and glycoinformatic tools for data handling and storage. In all, this analysis on glycomics offers strategies to build a robust postgenomic innovation roadmap for glycan-driven biomarkers as the field is anticipated to mature further and gain greater prominence in the near future.
Introduction
M
Glycosylation, regarded as a complex enzymatic process where sugars (glycans) bind to proteins and lipids, affects many human biological functions, including cell signaling, adhesion, and motility. Glycans are complex carbohydrates located on the surface of all eukaryotic cells and modify proteins in glycosylation, forming glycoconjugates, which thus far, are the most significant post-translational modifications (PTM) known (Cummings and Pierce, 2009; Harada et al., 2015; Stanley, 2011; Wang et al., 2016a). For over 19,709 human protein genes known, an estimated 39% are predicted to be either on the intracellular surface or outside of the cell. Thus, about 7686 proteins have these glycans bound to them (Apweiler et al., 1999; Lauc, 2016; Lauc et al., 2016).
When attached to proteins, glycans affect all aspects of the protein, including function, trafficking, folding, and clearance (Helenius and Aebi, 2001; Stanley, 2011; Zoldoš et al., 2013). So far, four protein-modifying glycan types have been identified: (1) N-glycans (attached to asparagine [Asn] side chains of peptides in an Asn-X-threonine [Thr]/Serine [Ser], [X≠ proline] sequon); (2) O-glycans (attached to serine/threonine); (3) glycosaminoglycan (GAG) (attached to serine side chains in a Ser-Glycine (Gly)-X-Gly (X≠ proline) sequon); and (4) C-glycans (attached to peptides through carbon–carbon (C-C) in the consensus sequence tryptophan (Trp)-X-X-Trp (Fuster and Esko, 2005; Hofsteenge et al., 1994; Jensen et al., 2012; Schachter, 2000; Stanley, 2011; Varki et al., 2009a; Weerapana and Imperiali, 2006).
Contrary to proteins, glycan biosynthesis does not require a template; rather, its final structure is catalyzed by a repertoire of enzymes that attach or detach monosaccharides in the glycosylation pathway (Menni et al., 2013; Taniguchi et al., 2011), making glycan biosynthesis several-fold more complex than protein synthesis (Lauc et al., 2016). While recognizing other glycan types, such as O-glycans, GAG, and C-glycans, the focus of this review will be on N-glycans. N-glycosylation begins on the cytoplasmic side of the endoplasmic reticulum (ER) where an oligosaccharide glycan precursor, comprising three glucose (Glc), nine mannose (Man), and two N-acetylglucosamine (GlcNAc) monosaccharides (Glc3Man9GlcNAc2), is attached to a lipid dolichol phosphate (Dol-PP) complex (Aebi et al., 2010; Varki et al., 2009a; Stanley, 2011).
This complex, catalyzed by oligosaccharyltransferases, is transferred from the Dol-PP to an N-side chain of asparagine (Asn) on a given protein (Tomiya et al., 2004; Varki et al., 2009b). All proteins having the consensus sequence (Asn-X-threonine [Thr] or Asn-X-serine [Ser], [X≠ proline]) have this complex pinned to them before their translocation to the luminal side of the ER (Ohtsubo and Marth, 2006). In the ER lumen and following different folding states of the newly synthesized glycoprotein, the oligosaccharide precursor is subjected to a cascade of trimming steps by glycosidases to form the correct glycoprotein (Taylor and Drickamer, 2011).
The glycoprotein then migrates to the cis portion of the Golgi apparatus where it is further trimmed and elongated by glycosidases and glycosyltransferases, respectively, into three distinct N-glycan structures—all having a conserved common core G1cNAc2Man3 (Jensen et al., 2012; Varki et al., 2009a). Additionally, other modifications, including N-acetylglucosaminylation, fucosylation, galactosylation, and sialylation, occur in the medial to trans Golgi during maturation (Rosnoblet et al., 2013).
N-glycans' role in cellular processes has been extensively reviewed, including cell communication, signaling, adhesion, motility, and host–pathogen interactions (Brooks, 2009; Gu et al., 2012; Helenius and Aebi, 2001; Ohtsubo and Marth, 2006). N-glycans are fairly stable over extended periods and therefore a change in their structure can be as a consequence of an environmental or pathophysiological condition (Gornik et al., 2009; Lu et al., 2011). Perhaps this is the reason why aberrant N-glycans are linked to several chronic diseases such as cancers (Arnold et al., 2008; Lauc et al., 2013; Saldova et al., 2014; Wang, 2013), hypertension (Wang et al., 2016b), metabolic syndrome (MetS) (Lu et al., 2011; McLachlan et al., 2016), diabetes (Testa et al., 2015), systemic lupus erythematosus (Vučković et al., 2015), rheumatoid arthritis (Sebastian et al., 2016), Parkinson's disease (Russell et al., 2017), and congenital disorders of glycosylation (Grünewald et al., 2002). Given the critical role of N-glycans in human physiology, high-throughput techniques and glycoinformatic tools that fine-tune structural determination and analyses are mandatory.
This review therefore highlights the various technological innovations in glycomics, including strategies for deglycosylation, techniques for N-glycan analysis, and glycoinformatic platforms that aid data handling, interpretation, and storage (Fig. 1). In addition, this review is also an innovation analysis, in that we discuss the application of N-glycan profiles as chronic disease biomarkers among different populations.
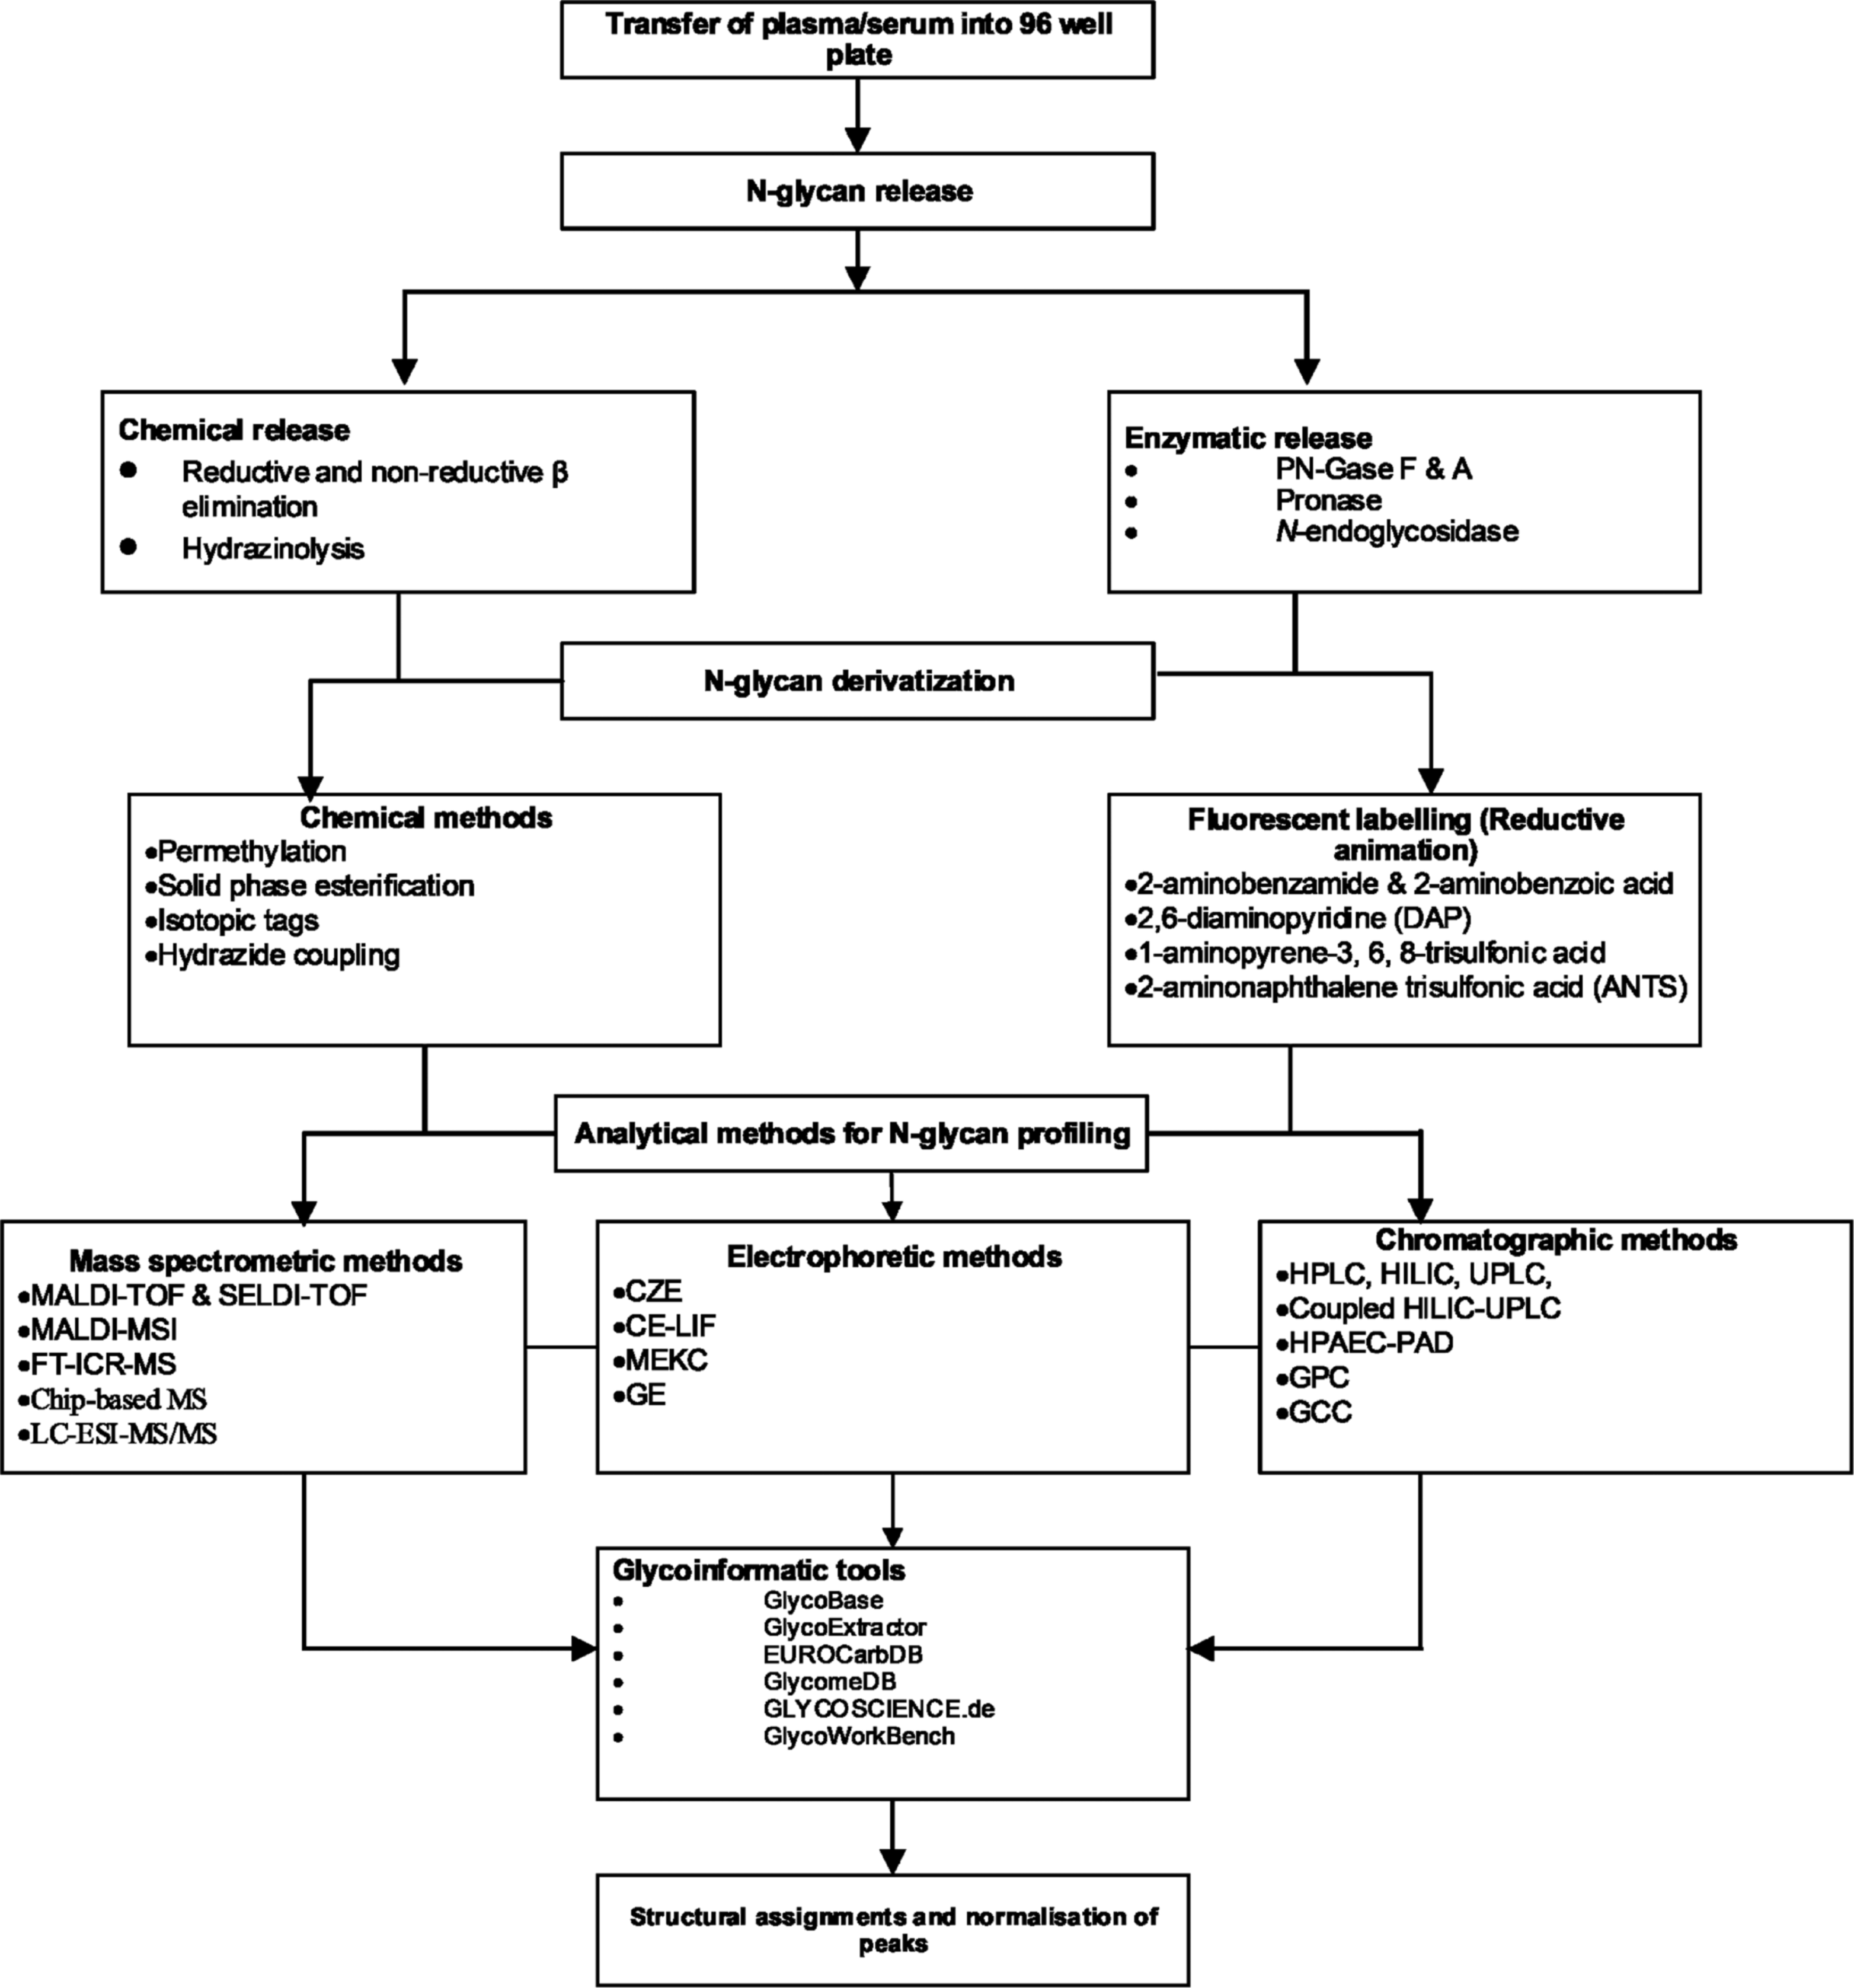
Schematic representation of N-glycan profiling.
Methods of N-Glycan Release
N-glycans exist as protein or lipid conjugates (Helenius and Aebi, 2001). Therefore, to analyze and determine their structural features, they are liberated from their bound proteins or lipids in a process termed deglycosylation (Hägglund et al., 2007). In the past, deglycosylation was a challenging task to accomplish, but recent advances in deglycosylation methods have made it possible to release N-glycans with less difficulty. The choice of a particular method depends on the type of glycosylation, the composition, and the amount of sample to be analyzed (An et al., 2003, 2009). Generally, N-glycans are released either by enzymatic or chemical means (Alley et al., 2013; An et al., 2009; Hägglund et al., 2007; Merry and Astrautsova, 2003; Yang et al., 2016).
In the enzymatic approach, the enzyme mostly used is peptide-N-glycosidase (PNGase) F or N-glycanase, which cleaves N-glycans with efficiency (Alley et al., 2013; An et al., 2009; Hägglund et al., 2007; Krishnamoorthy and Mahal, 2009; Mechref, 2011). In this, N-glycans are first cleaved into their 1-amino forms, followed by a deamination process that converts Asn to aspartic acid (Mechref, 2011). However, α-1, 3-linked fucose-modified proteins are cleaved with PNGase A since it leaves the fucose group intact, thereby enabling the identification of complex and hybrid forms (Alley et al., 2013; Hägglund et al., 2007; Mechref, 2011). For glycoproteins that are resistant to both PNGase F and A, pronase, a collection of proteolytic enzymes from Streptomyces griseus, is preferred. Pronase is only limited by its long incubation period, which is now known to be reduced after immobilizing on solid supports (Alley et al., 2013).
By way of enhancing pronase activity, Song et al. (2014) recently described the threshing and trimming method (TaT) where glycoproteins in tissues were first digested (threshed) with pronase into small peptides and glycoamino acids. Glycoamino acids were then trimmed with N-bromosuccinimide (NBS) to yield free N-glycans. TaT has several advantages: (1) because the method requires mild conditions using nontoxic reagents, both labile groups and N-glycan reducing ends are unaffected; (2) compared with other chemical methods, it is less expensive, making it a robust alternative for large-scale deglycosylation (Song et al., 2014); and (3) like PNGase F, TaT is also effective at cleaving α-1-3-linked fucose-modified proteins (Song et al., 2014).
Other deglycosylation enzymes are peptide N-endoglycosidase (Endo) H, D, F1, F2, and F3 (Merry and Astrautsova, 2003). While Endo H and Endo F1 cleave both high-mannose and hybrid N-glycans, Endo D is specific for complex N-glycans (Tarentino et al., 1989). Endo F2 and Endo F3 cleave biantennary and triantennary N-glycans, respectively, while tetraantennary N-glycans are cleaved by glycosamidases (Hägglund et al., 2007; Merry and Astrautsova, 2003).
N-glycans are released chemically by β-elimination (reductive and nonreductive). In this study, N-glycans are cleaved from glycoproteins in an alkaline medium that converts monosaccharides at the reducing end to alditol or GalNAc-ol (Cummings and Pierce, 2014; Roth et al., 2012). The nonreductive β-elimination method is sometimes preferred because the reducing end aldehyde is left intact for fluorescent labeling and also the presence of strong reducing agents minimizes peeling reactions, thus making it useful for large-scale N-glycan release (Cummings and Pierce, 2014).
Another means of releasing N-glycans is by hydrazinolysis under high temperatures (95°C) (Brooks, 2009). Hydrazinolysis entails complexing glycoproteins with hydrazines immobilized on beads, resulting in the breakdown of the protein portion of a glycoprotein (Lazar et al., 2013). However, hydrazinolysis is rarely used for N-glycan release because the reagents are toxic and destroy important labile groups (Lazar et al., 2013; Song et al., 2014). Additionally, the reagents interfere with the bonds linking glycans to Asn, making it difficult to determine the glycosylation site. Furthermore, integrity of the N-glycans may be compromised since some reagents are incorporated into the terminus of their structure (Cummings and Pierce, 2014).
Overall, the described deglycosylation methods are effective, and once detached, N-glycans are ready for characterization, purification, and structural assignment.
N-Glycan Derivatizing Methods
Considering N-glycans are non-UV-absorbing biomolecules, detection using various chromatographic methods is often difficult. At the same time, several hydroxylic side chains disallow sensitive detection using mass spectrometry (MS). Thus, they are usually derivatized to enhance detection (Ruhaak et al., 2010). Two main derivatization approaches are generally employed; permethylation (chemical) and reductive animation. Selecting a particular approach, in part, is dependent on which analytical technique is to be used. While permethylation is often required before MS (Hung et al., 2012), reductive animation is usually preferred during chromatographic separation (Zaia, 2008).
In 1960, Hakomori described permethylation, which involves replacing hydrogen groups bonded to oxygen and nitrogen in the presence of dimethylsulfoxide (DMSO), methyliodide, and sodium hydroxide (NaOH) to form hydrophobic derivatives (Hakomori, 1964). When compared with native N-glycans, permethylated ones are more stable, less solvated, and have higher surface activity, resulting in increased ion abundance in MS (Alley et al., 2013; Walker et al., 2011; Zaia, 2008). In addition, permethylation allows uniform ionization and simultaneous measurement of both neutral and acidic N-glycans.
Furthermore, the ease of predicting fragments of permethylated N-glycans, compared with the native ones, facilitates structural assignment (Ruhaak et al., 2010). Although traditional permethylation has improved MS analysis, peeling reactions and oxidative degradation due to excess NaOH arise, thereby reducing sensitivity (Furukawa et al., 2013; Kang et al., 2005).
However, this has been ameliorated by solid-phase permethylation, which employs reduced NaOH in microspin columns. This new method not only improves permethylation efficiency by limiting peeling reactions and removing excess reagents but also enhances sample recovery (Desantos‐Garcia et al., 2011; Kang et al., 2005). For complex N-glycans, permethylation is not often used because of possible loss of N-acetylneuraminic acid (sialic acid) groups; rather, solid-phase esterification (SPE) is preferred. SPE stabilizes the sialic acids by converting all carboxylic acid groups to methyl esters. When compared with underivatized N-glycans, esterified N-glycans significantly improve the overall MS sensitivity (Alley et al., 2013).
Due to the lack of fluorescent moieties and chromophores on the free reducing ends of N-glycans, they are derivatized with specific labels or tags by reductive animation. Among the widely used labeling tags are 2-aminobenzamide (2-AB) (Bigge et al., 1995; Watanabe et al., 2000), 2-aminobenzoic acid (2-AA), 2-aminopyridine (2-AP), 2,6-diaminopyridine (DAP) (Xia et al., 2005), 2-aminonaphthalene trisulfonic acid (ANTS), and 1-aminopyrene-3, 6, 8-trisulfonic acid (APTS) (Callewaert et al., 2004). The drawback with this method is the long time period for sample analysis because of persistent salt contamination, which necessitates sample cleanup. Other isotopic tags that are commonly used are [12C6] or [13C6]-aniline, 13CH3I (Alvarez-Manilla et al., 2007), and hydrazide coupling (Walker et al., 2011).
Analytical Techniques in Glycomics
Since glycomics became a recognized discipline, developing techniques for complete N-glycan analysis has been challenging mainly because of the complex nature of N-glycans. In fact, over 200 glycosyltransferases are involved in their biosynthesis, with synthesized forms having different glycosylic linkages, varied anomeric orientation, and different degrees of branching (Baycin et al., 2014; Wang et al., 2016a). Consequently, unraveling the structural architecture of these complex biomolecules to appreciate their role in pathophysiology is difficult unless highly sensitive and robust analytical techniques are employed. Generally, N-glycans are analyzed by MS (Bindila and Peter‐Katalinić, 2009), liquid chromatography (LC), and capillary electrophoresis (CE) (Raman et al., 2005; Turnbull and Field, 2007; Zhao et al., 2012). While this review will not provide a detailed overview of these techniques, a concise introduction on the mode of operation will be necessary.
Mass Spectrometry
Mass spectrometers operate by the formation of charged ions and separate ions according to their mass-to-charge ratio (m/z). Two main ionization modes are currently known: matrix-assisted laser desorption–ionization (MALDI) and electrospray ionization (ESI) (Wuhrer, 2013). Briefly, MALDI involves dissolving an analyte in a solution of organic molecules (matrix), which is dried to form solid analyte matrix crystals. Matrix crystals are heated and irradiated by laser pulses causing sublimation into a gaseous phase. Although the exact origin of the ions is not completely clear, it is suggested that ions for MALDI are generated during proton transfer and photon atomic/molecular interaction (Hoffmann and Stroobant, 2001). Gaseous ions then migrate through an electrostatic field to the analyzer. The peculiarity of MALDI is its ability to ionize and desorb analytes in a single run, allowing in-depth detection even at the femtomole level (Hoffmann and Stroobant, 2001).
ESI, on the other hand, involves the application of a high-voltage or electric field to a liquid–analyte mixture through a capillary tube, forming charged droplets. The liquid droplets undergo repeated evaporation as they pass through an inert gas-heated capillary tube. As solvent evaporation is continuous, offspring droplets are formed, which increase with increasing electric field intensity, resulting in multiple charged ions that are then analyzed. A unique feature of ESI is that the multiple charged ions from large-molecular-weight molecules are easily detected even on analyzers with poor mass limits, making it very useful for large-scale glycomics (Hoffmann and Stroobant, 2001; Zaia, 2008). Overall, both modes can ionize N-glycans, but regardless of which mode is chosen, derivatization is critical for detection, identification, and resolution of the MS spectra (Harvey, 2011; Weiskopf et al., 1998).
A typical example of MS method that has become popular in glycomics is the MALDI-time-of-flight-MS (MALDI-TOF-MS). This technique has its strengths and weaknesses. The main advantages include (1) a low cost per sample as a result of high-throughput per instrument; (2) the ability to perform site-specific glycosylation analysis; (3) high sensitivity; and (4) adequate structural elucidation. Some of its main disadvantages are (1) loss of sialic acid linkages; (2) unable to achieve isomer separation; and (3) it is not reliable for effective quantification (Huffman et al., 2013).
Nonetheless, successful application of MALDI-TOF-MS in population-based glycomics is recognized. A typical illustration was when Kyselova et al. (2007) examined N-glycan variations in 10 healthy individuals and 24 prostate cancer patients. In brief, serum samples were alkylated and reduced in the presence of ammonium bicarbonate and dithiothreitol. Aided by PNGase F, serum glycoproteins were deglycosylated and released N-glycans were then extracted by loading onto activated charcoal microcolumns in the presence of acetonitrile and trifluoroacetic acid. Eluted N-glycans were derivatized by solid-phase permethylation using NaOH, methyl iodide, and DMSO. Aliquots of the permethylated N-glycans were then loaded onto an MALDI plate, and at 355 nm wavelength, N-glycan peaks (spectra) of both healthy and prostate cancer patients were analyzed (Fig. 2). Employing this technique, the authors identified over 50 N-glycan structures, of which 12 structures differed significantly between healthy and prostate cancer patients (Kyselova, 2007).
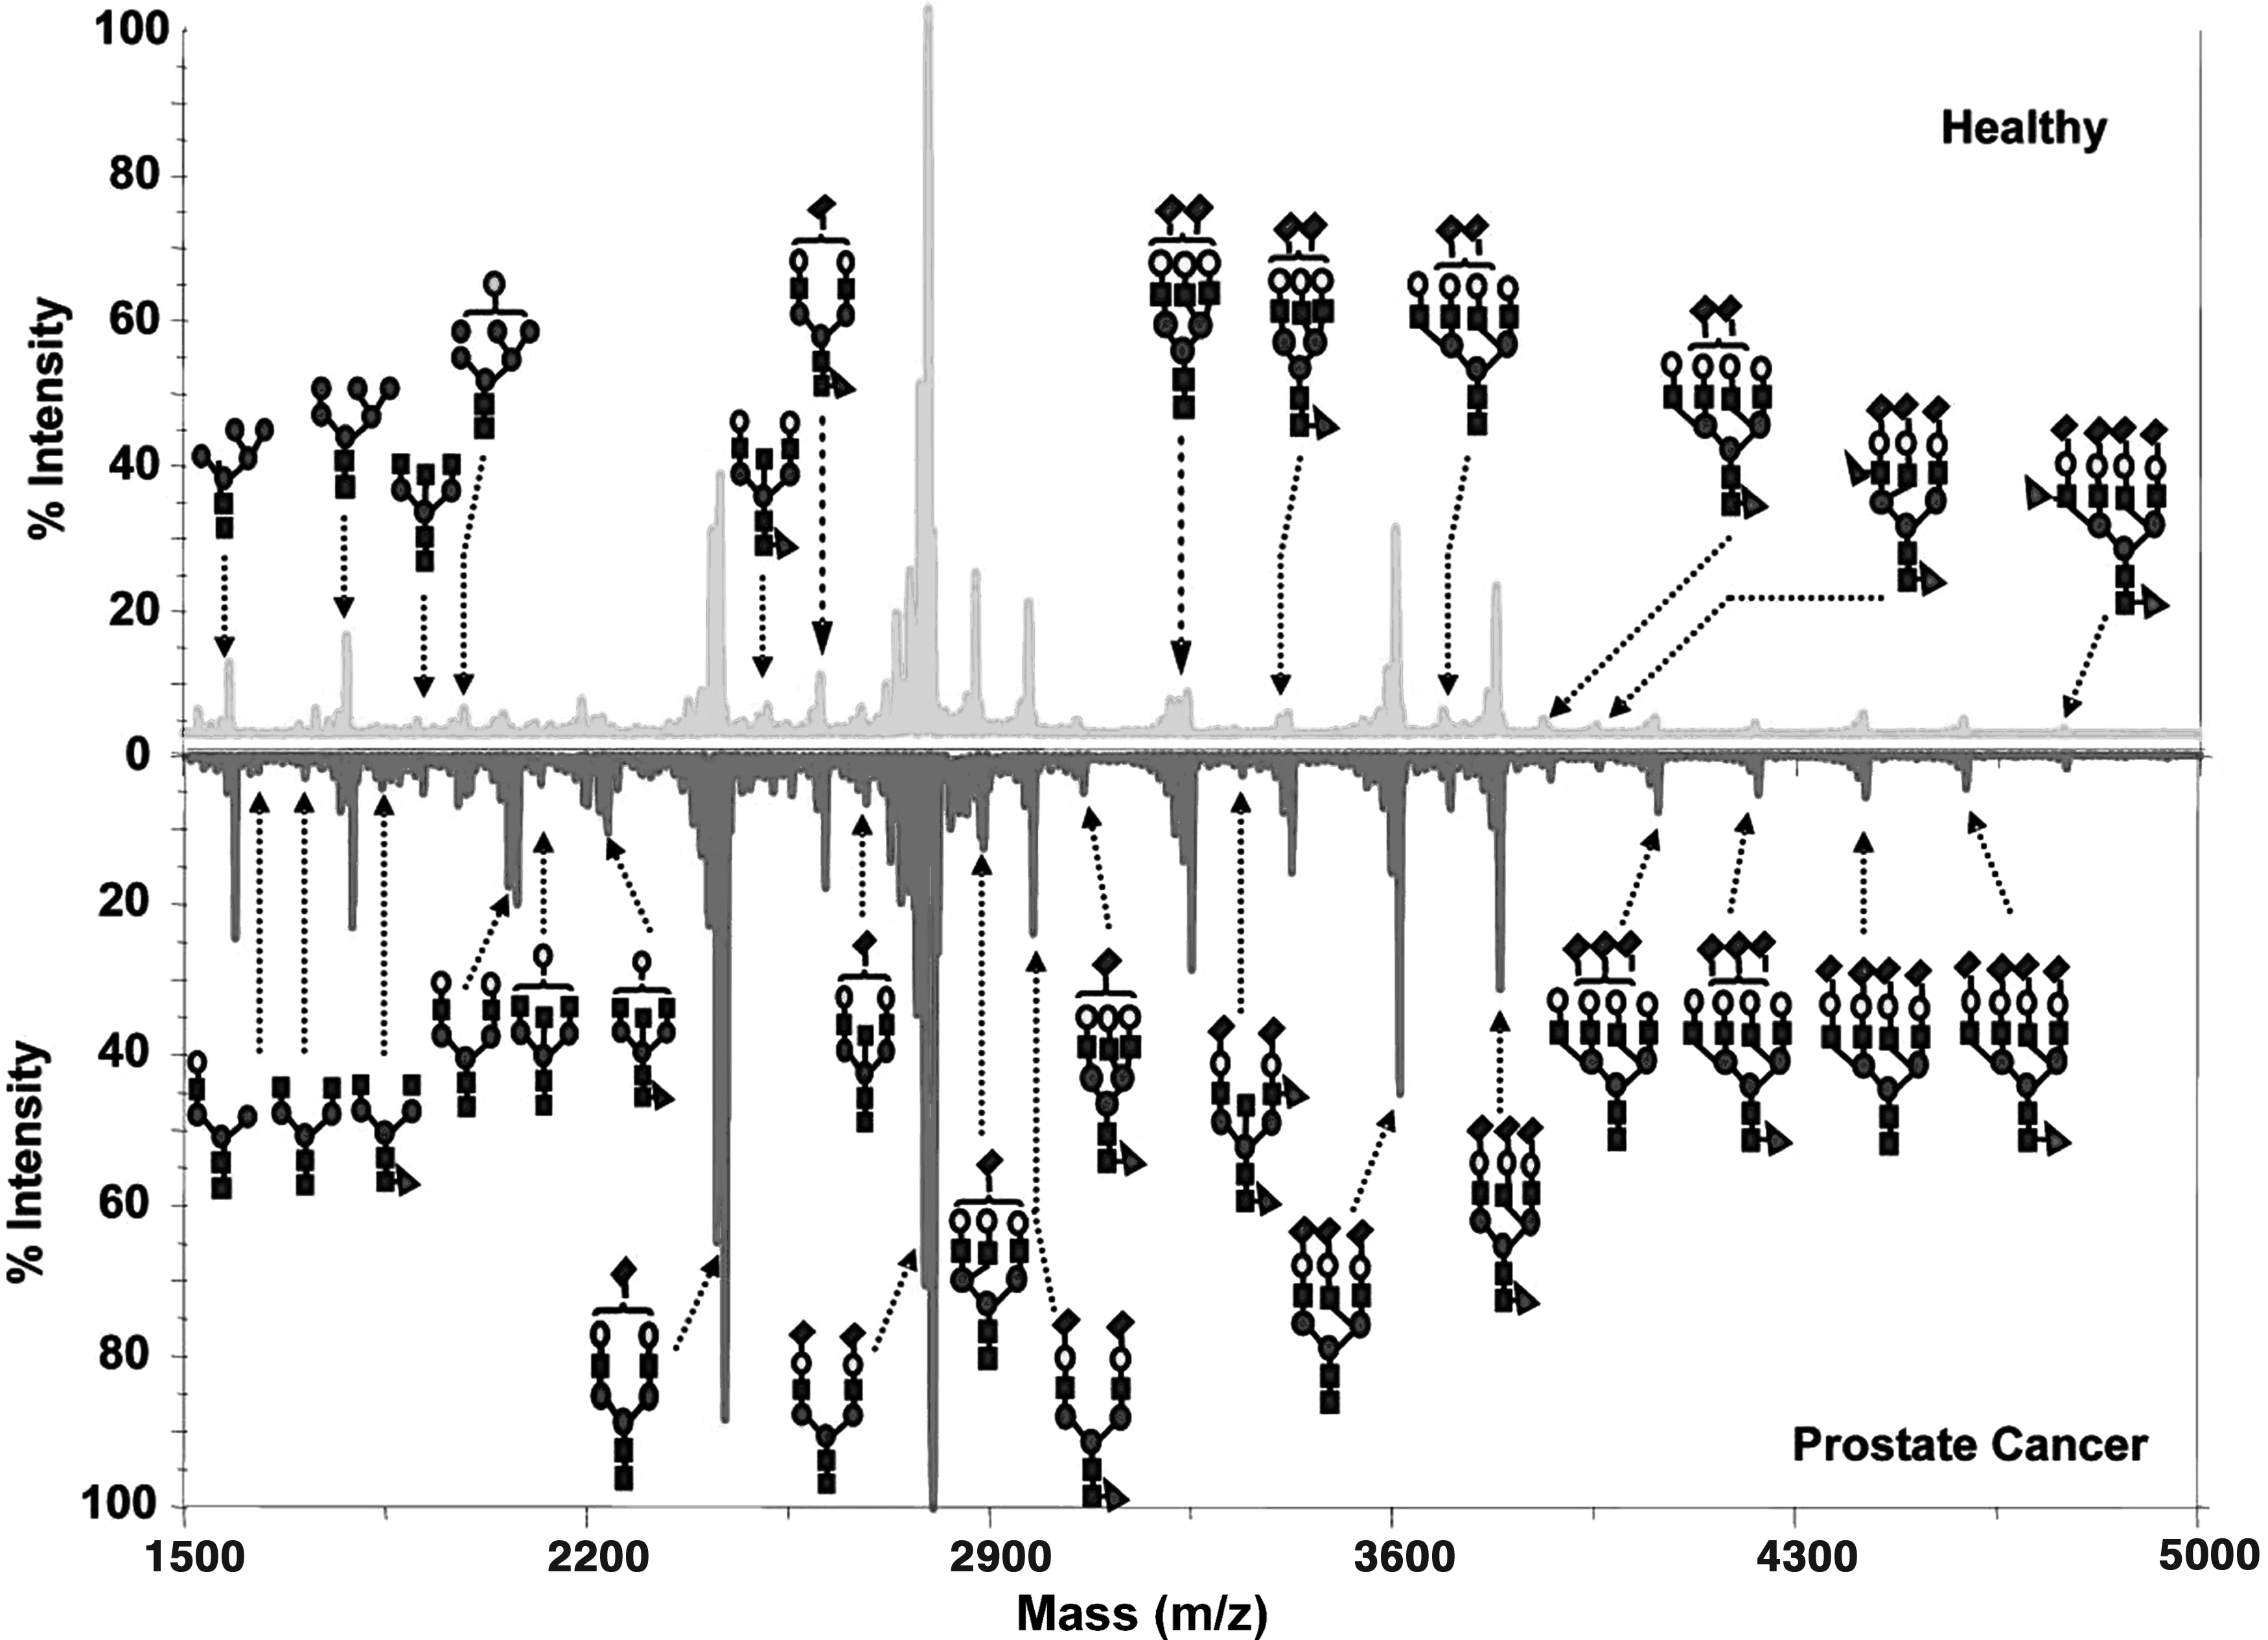
MALDI spectra of N-glycans in prostate cancer and controls. Circles, mannose; triangles fucose; squares N-acetylglucosamine; rhomboid N-acetylneuraminic acid. Figure reproduced with permission from Kyselova et al. (2007). MALDI, matrix-assisted laser desorption–ionization.
In recent years, MALDI-MS imaging (MALDI-MSI) has been developed to spatially resolve N-glycan structures and provide molecular distribution or maps of the relative amount of each N-glycan trait in a given tissue section (Powers et al., 2013). MALDI-MSI has several advantages: (1) multiple N-glycan structures can be determined in a single run, allowing complete profiling of all analytes present within a tissue; (2) a combination of MSI with other quantitative MS provides an unprecedented profile of tissue-specific N-glycan variations (Toghi et al., 2014); and (3) N-glycans, which are visualized in the form of images, allow the sensitive detection of morphological changes of structures in each tissue section. MALDI-MSI was employed for imaging N-glycans in formalin-fixed paraffin-embedded tissues of ovarian cancer patients (Ever-Dass et al., 2016).
Shortly thereafter, tissues from ovarian cancer patients were dipped in a formalin solution. After rinsing in deionized water, the tissues were processed in xylene, ethanol, and paraffin to form paraffin complexed tissue blocks. Following further washing with ethanol and incubation with NH4HCO3, N-glycans within tissues were released using PNGase F. Released N-glycans were then purified on porous graphitized carbon and cation exchange columns and analyzed using porous gel chromatography (PGC)-LC-ESI-MS/MS, while MSI was used for visualizing the spatial distribution of N-glycans in ovarian cancer tissues (Everest-Dass et al., 2016). It was observed that high-mannose and hybrid/complex N-glycans were abundant in the tumor tissues and the stroma, respectively (Fig. 3).
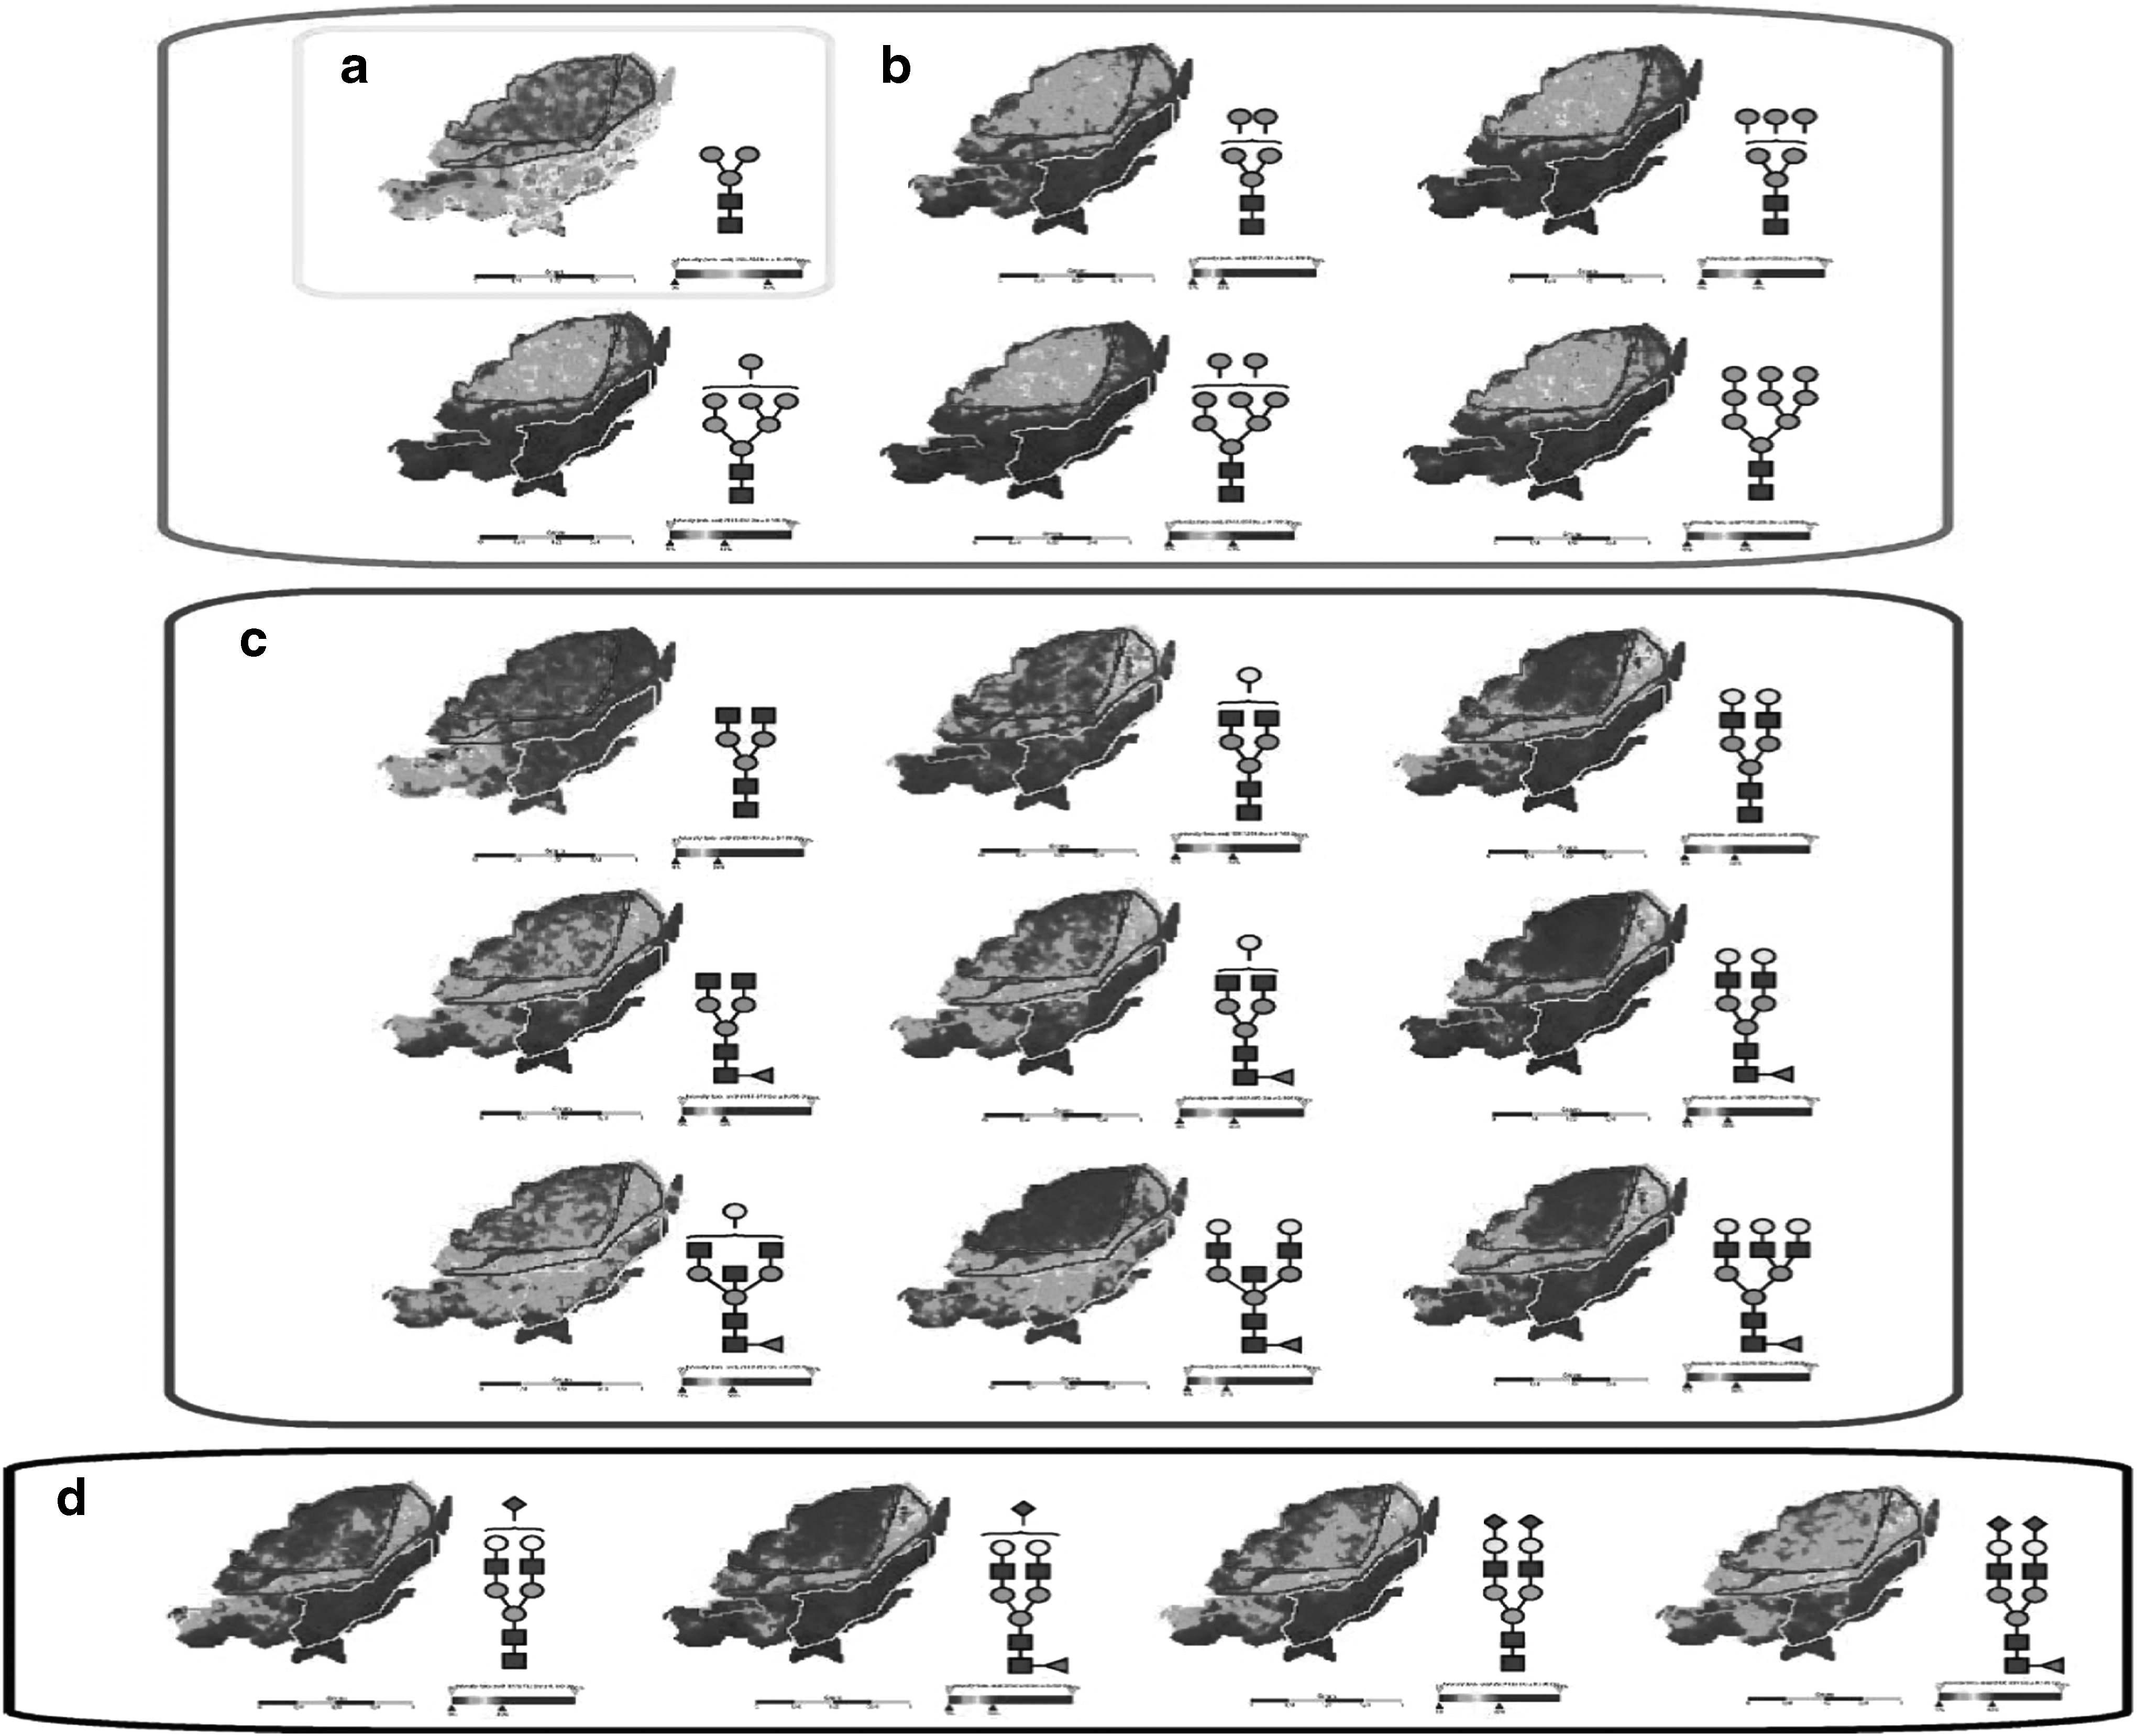
N-glycan in formalin-fixed paraffin-embedded tissue sections analyzed using MSI.
Apart from MALDI-MSI, other highly sensitive MS equipment are tandem MS, chip-based MS (Bindila and Peter‐Katalinić, 2009), Fourier transform ion cyclotron MS (Park and Lebrilla, 2005), and surface-enhanced laser desorption/ionization (Cummings and Pierce, 2009; Youxin et al., 2016). While N-glycan analysis using MS has been remarkable, it is limited by its inability to provide detailed information of structural isomers. This has necessitated the coupling of MS to other chromatographic techniques for in-depth structural characterization (Wuhrer, 2013).
Liquid Chromatography
Rapid advances in technology have made it possible to resolve N-glycan structures using chromatographic techniques. While recognizing different separation methods such as gel permeation chromatography and graphitized carbon chromatography, this review will focus on high-performance liquid chromatography (HPLC)-based methods. HPLC separates complex N-glycans by the adsorptive interaction of N-glycans in solution (mobile phase) with a stationary phase. Solvents mostly used as mobile phases include ethanol, methanol, and acetonitrile, while amides, silanols/silica gels/particles, and diols are often used as stationary phases (Novotny et al., 2013; Zauner et al., 2011).
In HPLC, N-glycans in solution are first loaded and after gradually altering the conditions of the mobile phase, N-glycans are eluted based on their retention times on the column, generating peaks (chromatogram), which are observed on a detector (Rudd et al., 2001). Constituent N-glycan monosaccharides are often expressed as glucose units (GU) and peaks are quantified by calculating the area under curve and dividing by the sum of the individual peaks (Royle et al., 2008).
Depending on the composition of mobile and stationary phases, HPLC can be either normal phase or reverse phase (RP). While NR-HPLC employs a polar stationary phase and a nonpolar mobile phase, RP-HPLC is the direct opposite. Although HPLC has been useful for separating N-glycans, it is limited by possible coelution and hence requires several purification steps, which lead to long sample runs and high solvent consumption. For this reason, an automated and highly sensitive form of HPLC known as hydrophilic interaction liquid chromatography (HILIC) has been developed (Zauner et al., 2011). As an advanced form of HPLC, HILIC employs a partition mechanism to separate N-glycans according to their charge, size, and oligosaccharide composition. Very often, N-glycans for HILIC separation are derivatized with 2-AB to enhance UV detection.
Since these labels confer some hydrophobic properties, derivatized N-glycans have weak interaction with the stationary phase, causing them to be eluted first (Zauner et al., 2011). Structural assignment of the eluted N-glycans, expressed as GU, is then performed by comparing with reference databases, which are discussed later in this review (Royle et al., 2008). HILIC has several advantages over HPLC. Some of these are a single and efficient separation of both charged (sialylated) and uncharged/highly polar (OH) N-glycans, full isometric separation, and high-resolution potential (Novotny et al., 2013).
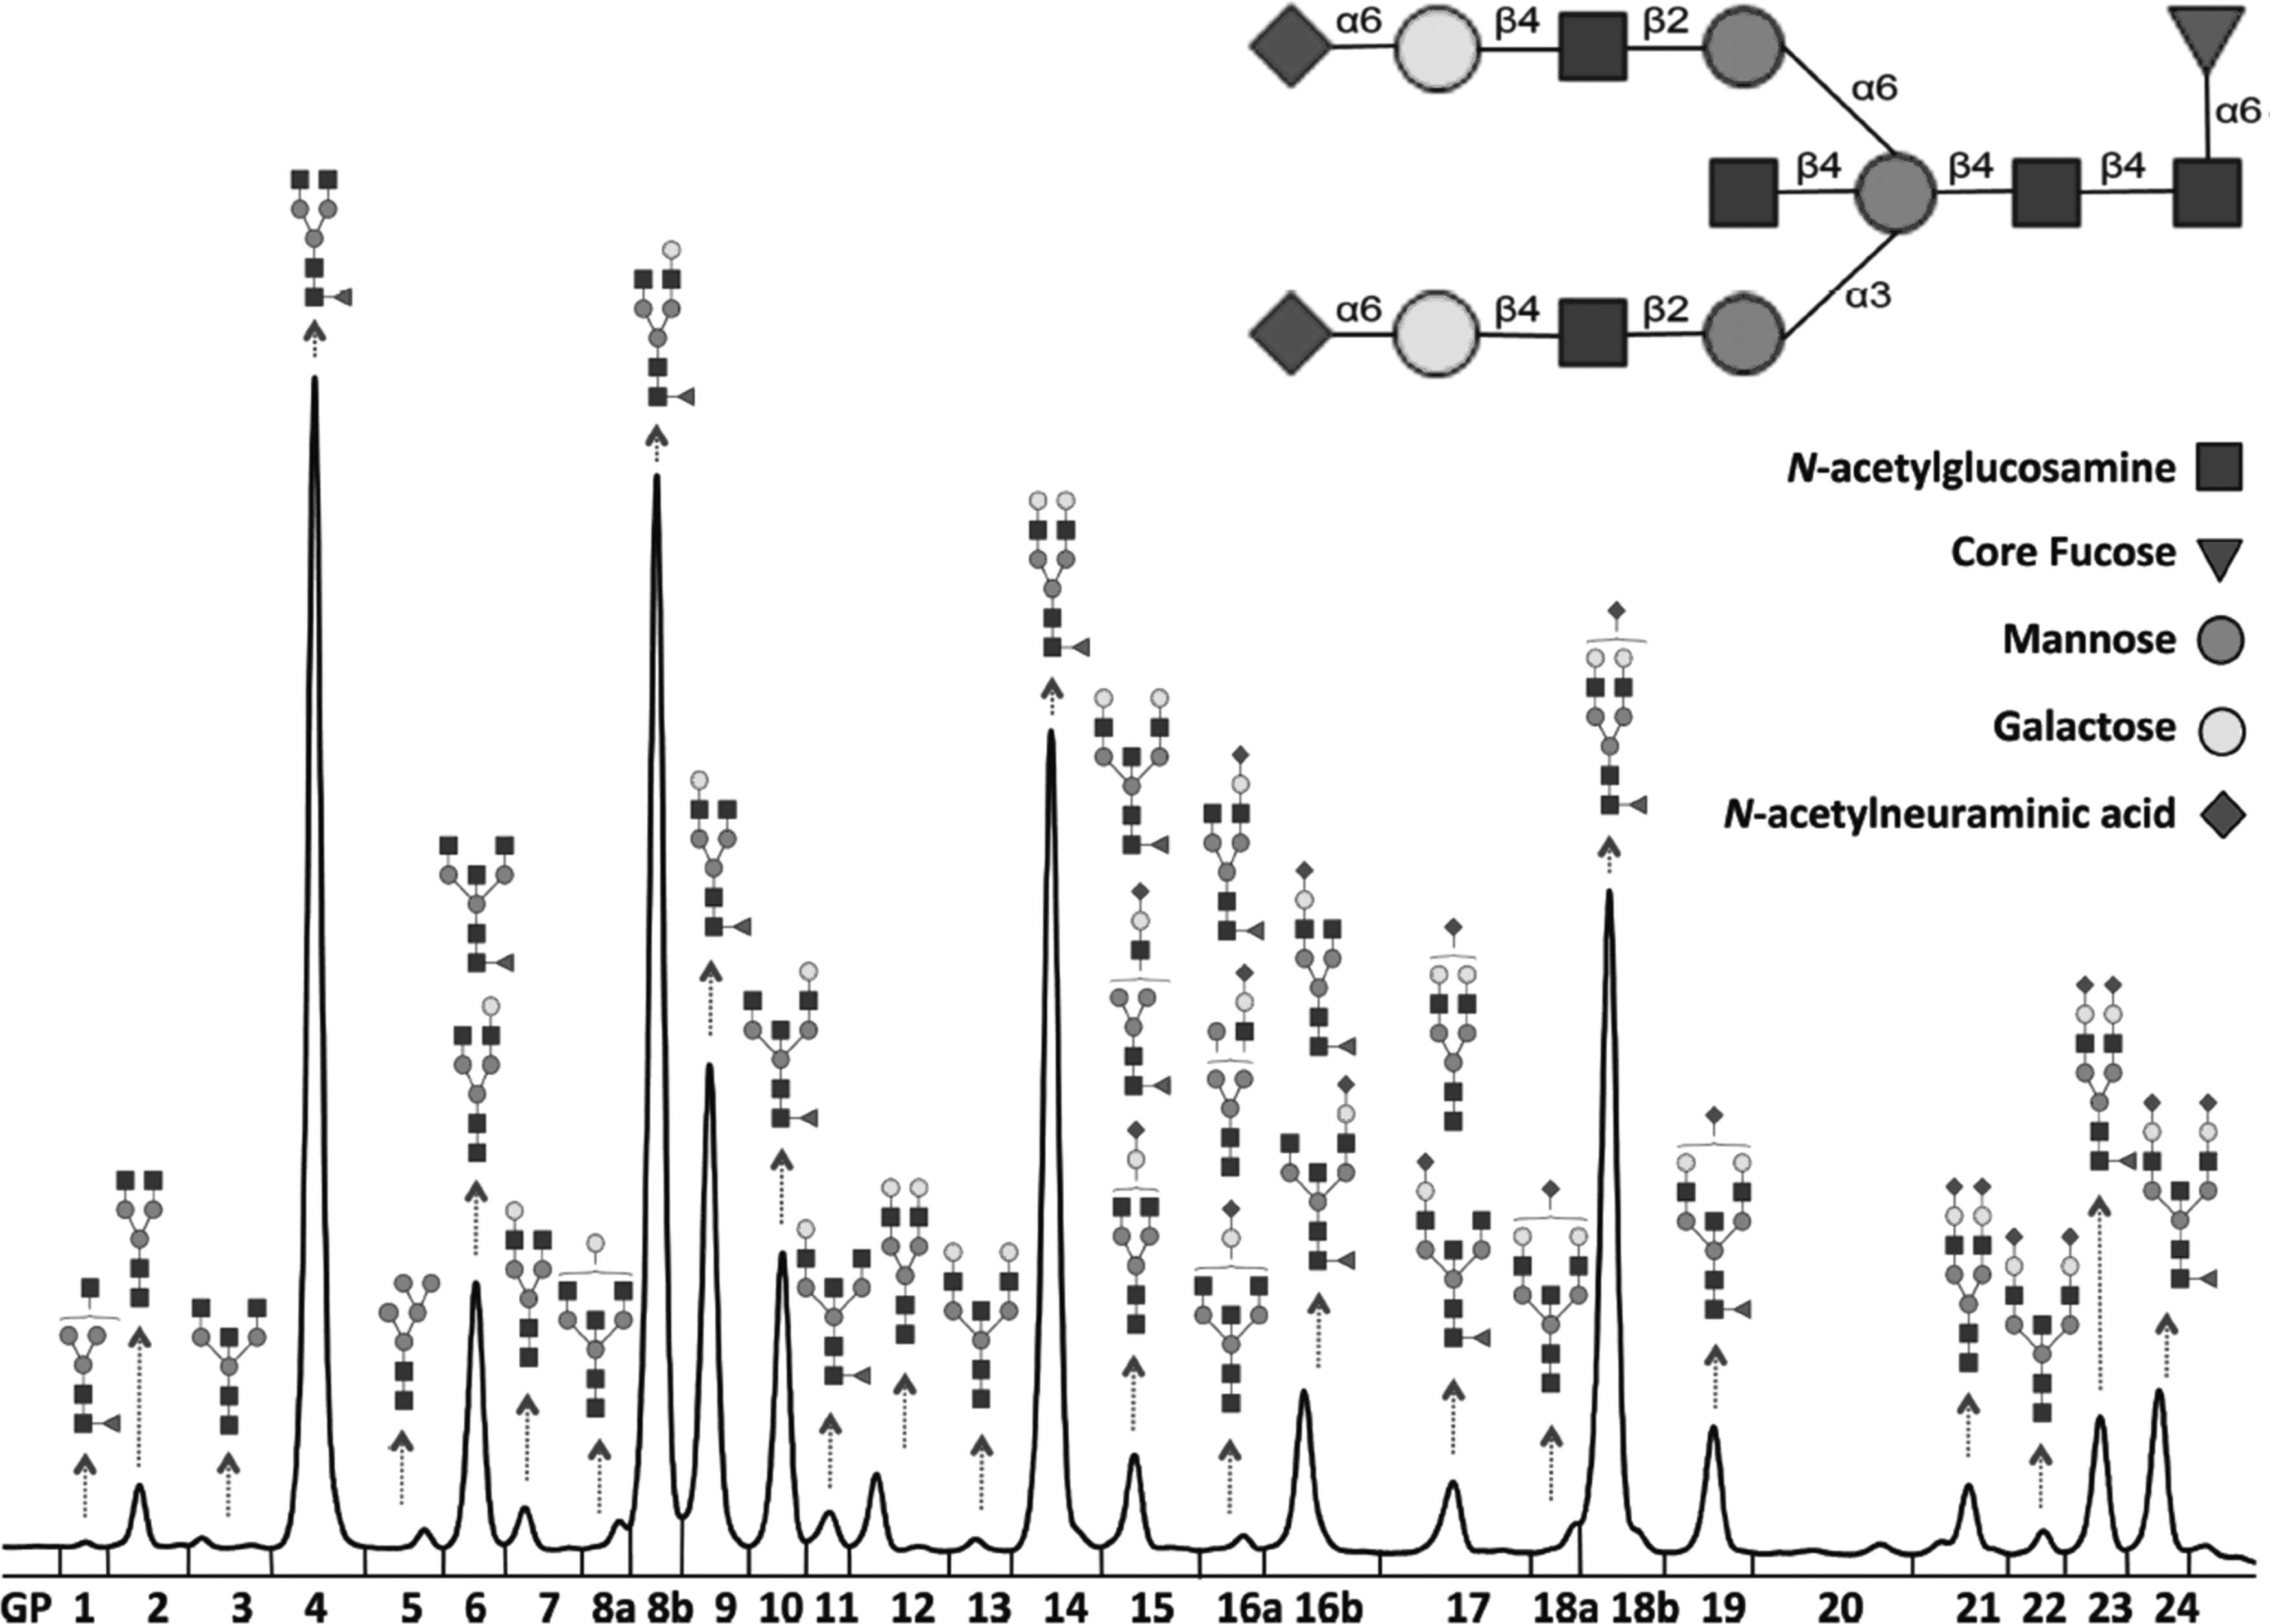
In recent years, HPLC-HILIC has been applied for identifying biomarkers for chronic diseases. For example, Lu et al. (2011) investigated the correlation between plasma N-glycan profiles and MetS among 212 Chinese Han and 520 Croatian individuals. Briefly, N-glycans were released from 5 μL of plasma in a microplate using PNGase F and fluorescently labeled with 2-AB. This was followed by exoglycosidase digestion with Arthrobacter ureafaciens sialidase. Using a TSK gel Amide-80 5-μm (250 × 4.6 mm) column, formic acid, and ammonia buffer, with acetonitrile as organic solvent, N-glycans were separated on HPLC-HILIC. Weak anion exchange (WAX)-HPLC was used to separate complex N-glycans based on the number of sialic acid groups attached. Using this technique, it was possible to assign 16 N-glycan peaks (Fig. 4), of which nine significantly correlated with established MetS biomarkers, including systolic blood pressure, diastolic blood pressure, body–mass index, and fasting blood sugar (Lu et al., 2011).
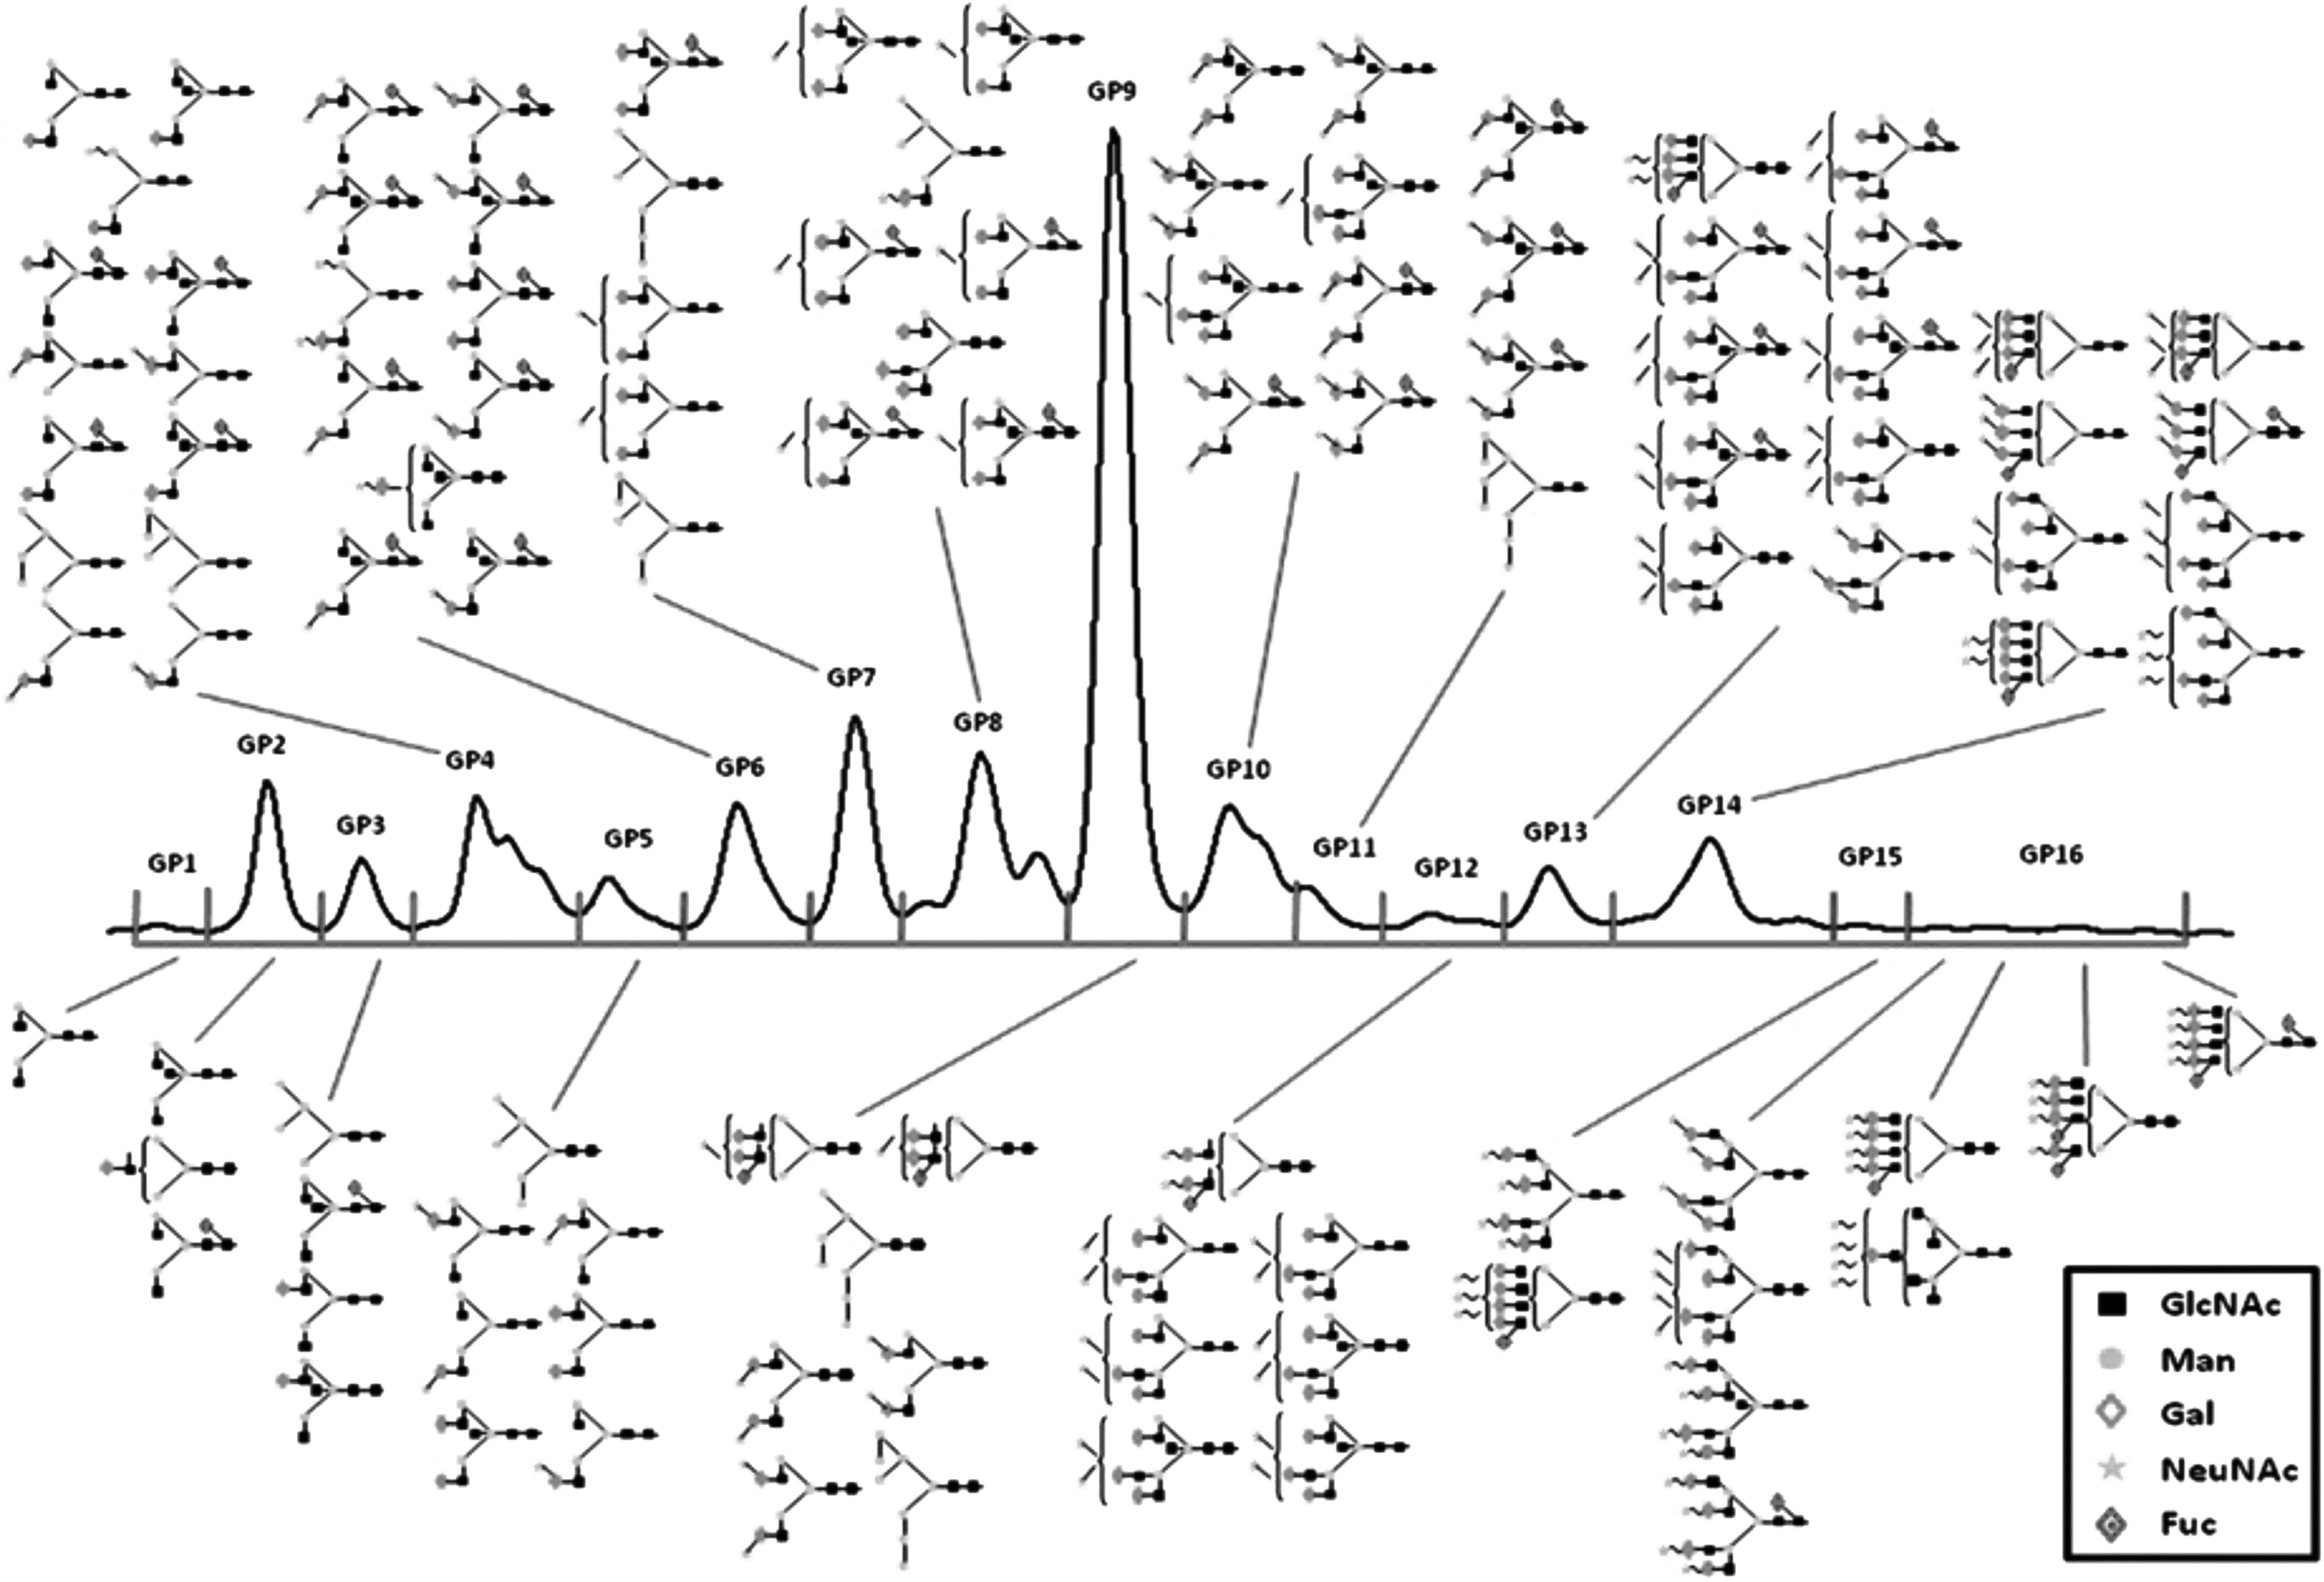
Plasma N-glycome. Enabled by HPLC-HILIC, 33 plasma N-glycan peaks from MetS in Chinese Han and Croatian populations were categorized into 16 groups. Structural assignment of each N-glycan peak was determined after comparing with a reference database. Figure reproduced with permission from Lu et al. (2011). HILIC, hydrophilic interaction liquid chromatography; HPLC, high-performance liquid chromatography; MetS, metabolic syndrome.
Similarly, McLachlan et al. (2016) employed the HPLC-HILIC technique to investigate the association between plasma N-glycans and MetS in a large Orcadian population comprising 2039 individuals. This study identified 21 N-glycan traits that were altered in MetS (McLachlan et al., 2016).
Progressing from HPLC, ultra-performance liquid chromatography (UPLC) has been designed, allowing shorter analytic runs, less solvent consumption, and improved resolution (Saldova et al., 2014). Like HPLC-HILIC, UPLC has been employed for studying N-glycan structures on a large scale. An example of such a study is by Saldova et al. (2014), who examined N-glycan profiles in the serum of 62 breast cancer patients and 107 healthy controls. Briefly, N-glycans were released from the serum using PNGase F, after which they were fluorescently labeled with 2-AB. Following several washing steps, N-glycans were separated on UPLC using 1.7 BEH Glycan in a 2.1 × 150-mm column. WAX-HPLC was then performed to separate the N-glycans on the basis of their sialic acid attachments and confirmed by exoglycosidase digestions. Through this technique, over 140 N-glycans were assigned, which are potential biomarkers for breast cancer (Saldova et al., 2014).
Similarly, Krištić et al. (2014) used UPLC to analyze immunoglobulin G (IgG) in the plasma of 5117 individuals from four European populations and observed major IgG changes such as fucosylation, bisecting G1NAc, and sialylation that correlated with age. In particular, after analyzing 24 IgG glycan peaks from the chromatogram (Fig. 5), it was concluded that nongalactosylation was positively associated with age, while digalactosylation decreased with age. These findings therefore show that glycosylation changes in IgG can be an important predictor of human aging (Krištić et al., 2014). Other scientists who have employed the UPLC technique for N-glycan analysis include Sebastian et al. (2016), Wang et al. (2016b), and Yu et al. (2016). Although not presently well known, another cutting edge technique that will soon flood the glycomic field is UPLC-MS (e.g., UPLC-QTof). This technique allows the detection of multiple features in a given sample and exploits the advantages of MS for better MS/MS glycan fragmentation and perfect mass confirmation of low-level peaks (Dunn et al., 2011).
IgG glycosylation profiles using UPLC. Twenty-four N-glycan peaks were generated on the UPLC chromatogram. Figure reproduced from Krištić et al. (2014). UPLC, ultra-performance liquid chromatography.
Capillary Electrophoresis
CE, since its emergence in the past few years, has been considered one of the most robust techniques for analyzing N-glycans (Mechref, 2011; Monton and Terabe, 2005). In principle, CE separates charged ions in solution in a narrow separating capillary tube. This capillary tube is dipped in two buffer-containing reservoirs connected to a high voltage. When the analyte is introduced at the inlet of the reservoir, a voltage is applied generating an electric field, which causes the analyte to migrate. Based on their mass-to-charge ratios, the analytes are distinctly separated on the detector while generating an electropherogram on the data acquisition device.
CE instrumentation is simple yet capable of distinguishing structural isomers, which otherwise are not easily separated using MS (Mechref, 2011). Additionally, it is fast, efficient, and requires only a small sample volume for analysis, making it an effective tool in situations where there is limited sample quantity (Campa et al., 2006; Zhao et al., 2012). In contrast to other analytical techniques, CE separation can be achieved under mild conditions, with low salt concentrations, thereby protecting the integrity of the analyte (Monton and Terabe, 2005). However, comprehensive and detailed information of the N-glycan structure can be obtained when CE is coupled to other analytical techniques such as laser-induced florescence (LIF). Similar to the other described techniques, CE-LIF will require derivatization with fluorescent tags for sensitive detection. Among the most commonly used tags are p-amino benzoic acid (p-ABA), 7-amino-1, 3-naphthalene disulfonic acid (ANDSA), and 2-aminonaphthalene-1-sulfonic acid (ANS). The main drawback of CE is that it is unable to perform site-specific glycosylation analysis (Huffman et al., 2013).
A clinical application of this technique was described by Varadi et al. (2013) who profiled N-glycans of haptoglobin in pneumonia, chronic obstructive pulmonary disease (COPD), and lung cancer. Briefly, plasma samples were washed with a binding buffer, and after incubation, samples were centrifuged to separate the bound haptoglobin from the unbound material. The bound haptoglobin was then loaded onto a column containing a specific haptoglobin monoclonal antibody. Following several washing steps with phosphate-buffered saline, haptoglobin was eluted and purified. N-glycans in haptoglobin were released using PNGase F and fluorescently labeled with APTS. Sialic acids on the complex N-glycans were then digested using exoglycosidase sialidase and the resultant profiles analyzed on CE-LIF (Fig. 6). As shown by this technique, there was an increase in α-1, 6-triantennary glycans in all patient groups compared with controls. Additionally, when compared with COPD, lung cancer patients showed increased core and arm fucosylated tetraantennary N-glycans (Varadi et al, 2013).
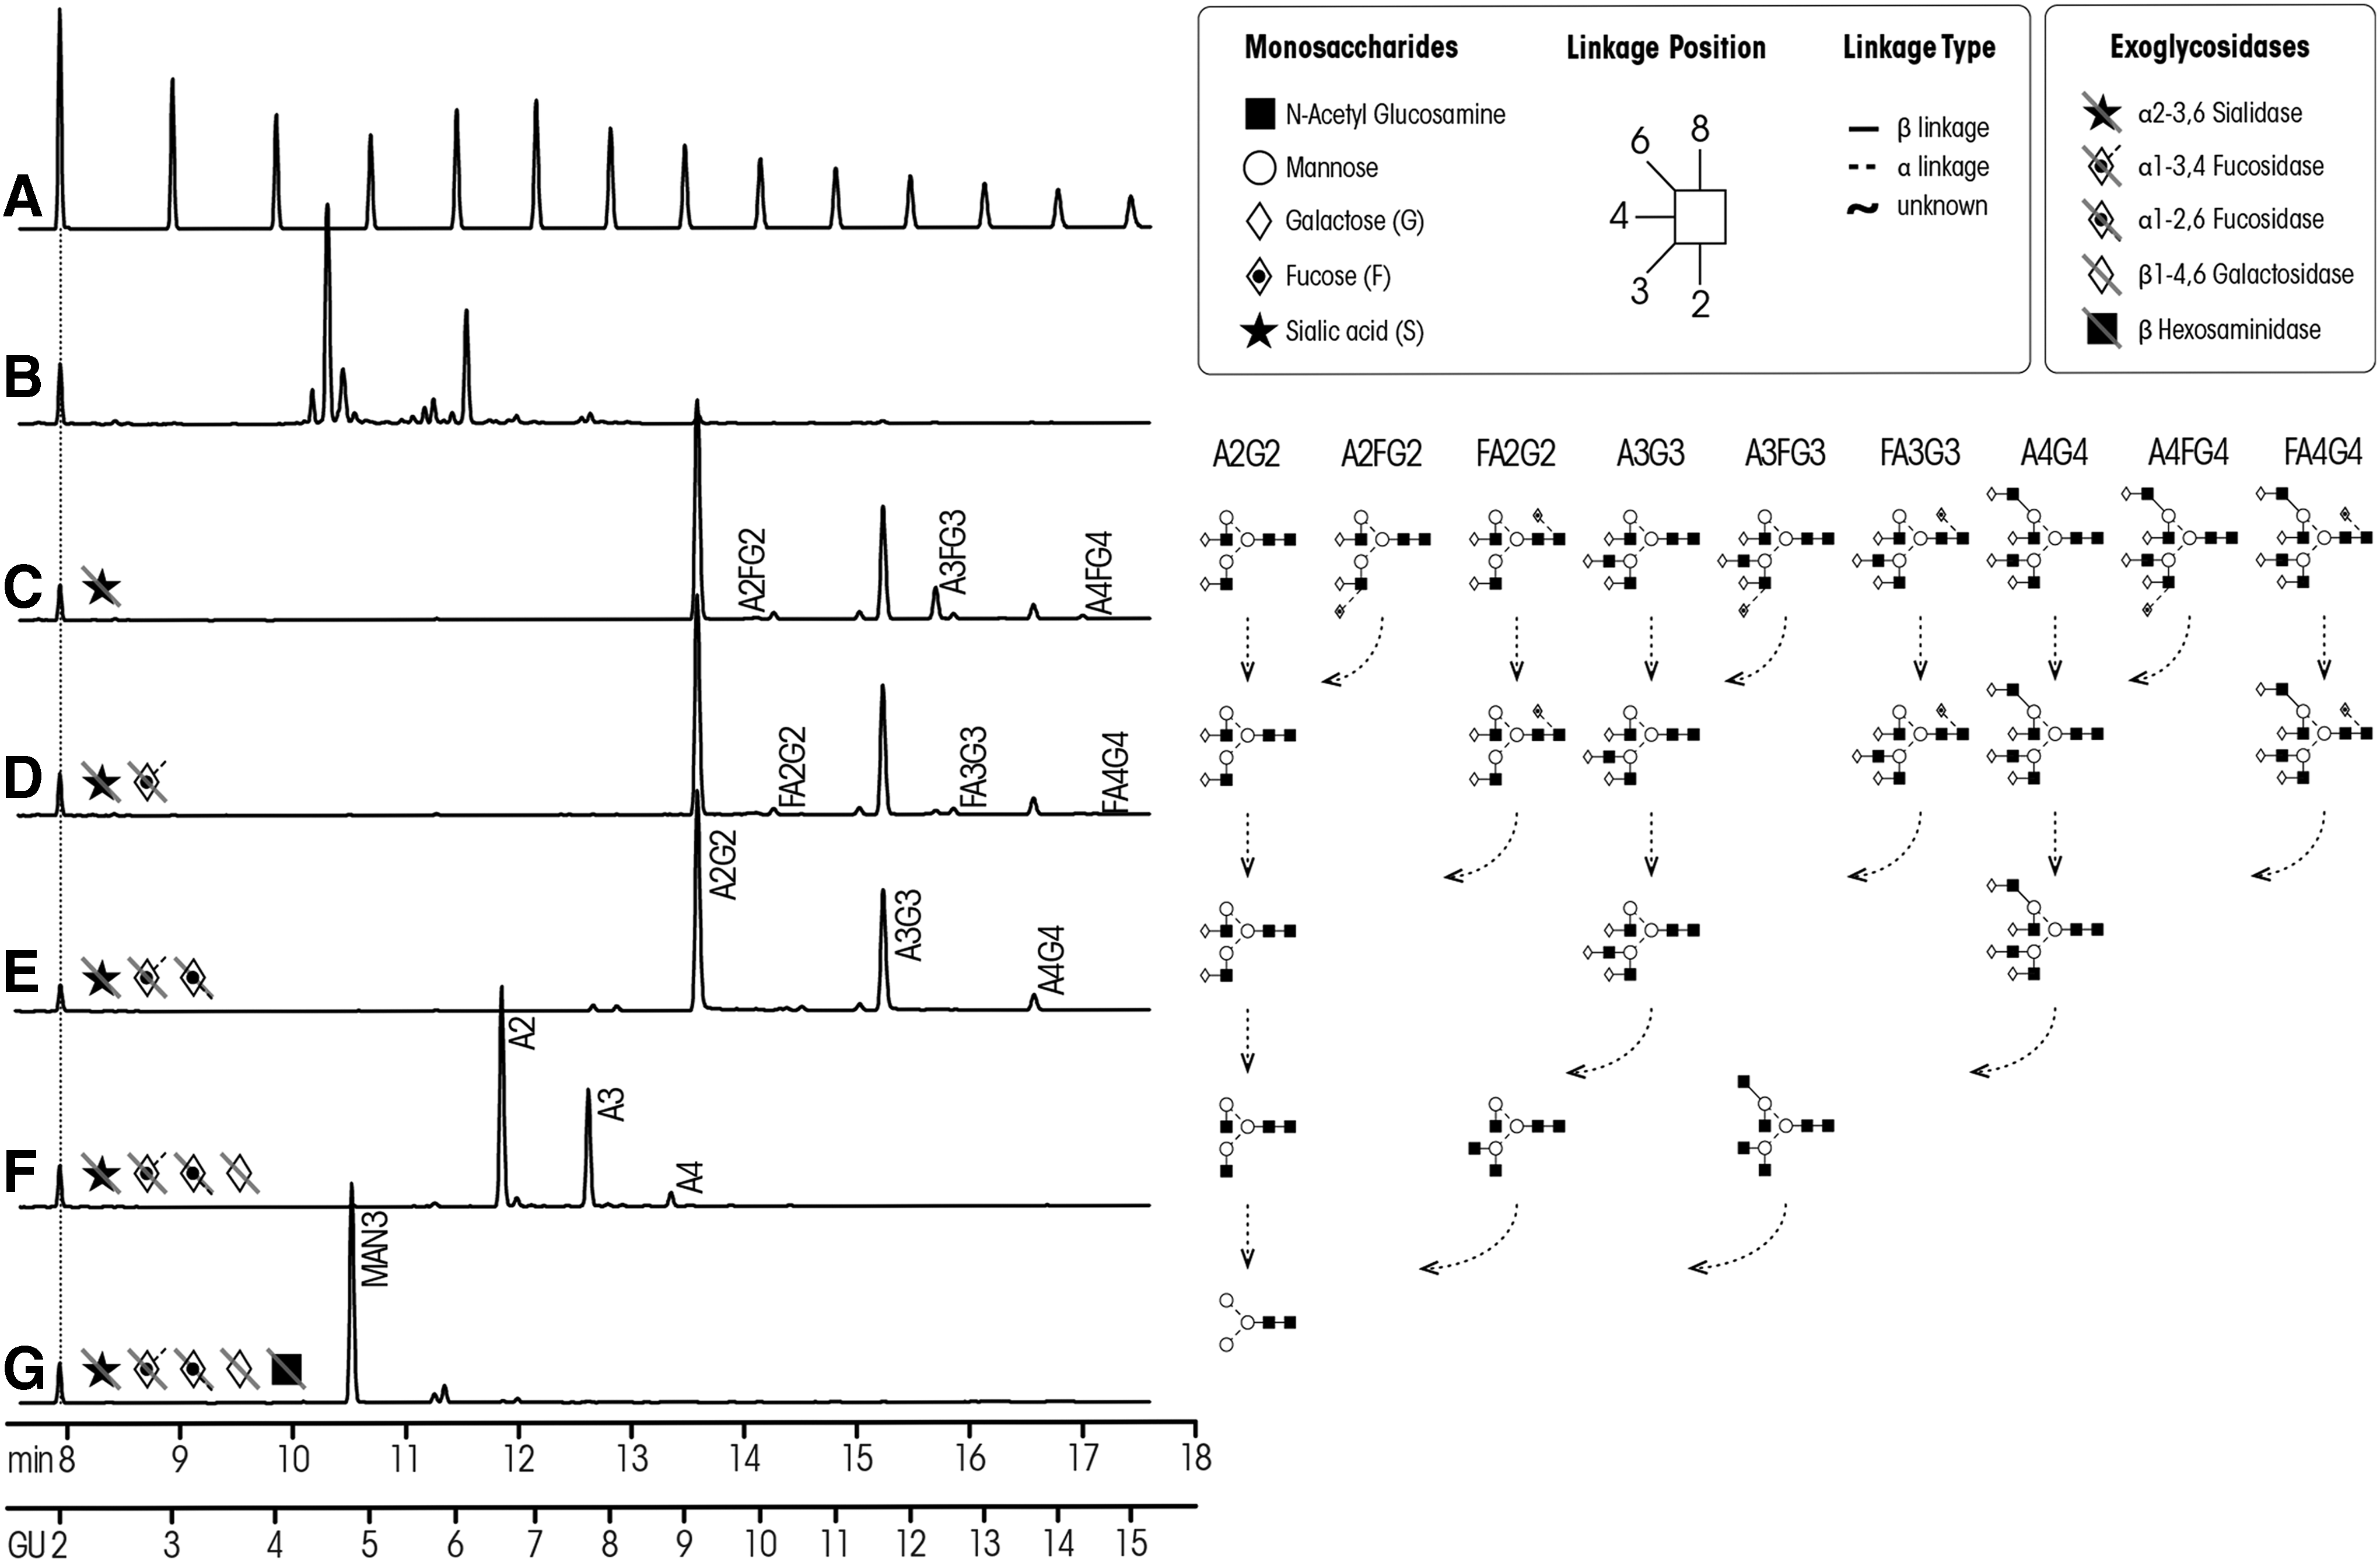
N-glycan profiles of plasma haptoglobin in pneumonia, lung cancer, COPD, and controls. Different exoglycosidases such as sialidase, fucosidase, hexosaminidase, and galactosidase were used to digest haptoglobin and profiled using CE-LIF. Figure reproduced with permission from Varadi et al. (2013). CE, capillary electrophoresis; COPD, chronic obstructive pulmonary disease.
Similarly, by applying the CE-LIF technique, Schwedler et al. (2014) were able to identify 34 and 32 N-glycan isomers in the serum of epithelial ovarian cancer (EOC) patients and healthy patients, respectively. They found that compared with healthy patients, core fucosylated tetraantennary N-glycans were higher in EOC, while diantennary and high-mannose N-glycans decreased (Schwedler et al., 2014).
Other types of CE-based techniques often employed for N-glycan analysis are capillary zone electrophoresis and micellar electrokinetic chromatography.
Despite the advancement of analytical and deglycosylation techniques, relative complexities of glycan structures cannot be fully elucidated with these techniques alone. Adequate and comprehensive N-glycan databases are needed to aid experimental data storage, N-glycan structure annotation, and interpretation into computer-readable formats that can be easily accessed by glycobiologists.
Glycoinformatic Tools
As opposed to genomics and proteomics where there are large pools of databases, comparable databases for glycomics are still in the early stages (Hayes et al., 2011; Krishnamoorthy and Mahal, 2009; Lazar et al., 2013; Raman et al., 2005, 2006; Von Der Lieth et al., 2004). Notwithstanding this, a large pool of glycoinformatic databases containing a repertoire of N-glycan structures has been developed (Artemenko et al., 2010; Campbell et al., 2008; Hayes et al., 2011; Von der Lieth et al., 2011). Many of these databases are not well known due to inadequate resources, website inaccessibility, and lack of public awareness (Baycin et al., 2014). While this review will not fully cover all the N-glycan databases known, it will highlight some of them.
The first attempt to set up glycan databases was in the early 1990s when the complex carbohydrate structure database (CCSD), often called the CarbBank, was established by the Complex Carbohydrate Research Center at the University of Georgia (Doubet and Albersheim, 1992; Frank and Schloissnig, 2010; Lütteke et al., 2006). They created a catalog of 9200 carbohydrate sequences, which were pooled from over 2500 publications during the mid-90s. (Doubet and Albersheim, 1992). Lack of funding unfortunately led to this group discontinuing their efforts; however, their pioneering work led to the development of all the modern databases for glycomics research (Frank and Schloissnig, 2010; Von der Lieth et al., 2011).
EUROCarbDB
The EUROCarbDB is a web-based open-access resource, which contains a cluster of N-glycan profile data from the HPLC and MS platforms (Campbell et al., 2008; Frank and Schloissnig, 2010; Von der Lieth et al., 2011). It also has unique features for storing curated and experimental data and tools for visualizing N-glycan structures (Von der Lieth et al., 2011). For example, it is possible to completely observe N-glycan structures, including their anomeric orientation, stereoisomers, and the type of monosaccharide linkages, because of the embedded GlycanBuilder tool designed for intuitive graphical visualization (Ceroni et al., 2007; Von der Lieth et al., 2011).
Importantly, it is possible to incorporate and integrate other databases in the EUROCarbDB platform to promote data exchange and accessibility. Given the structural diversity of N-glycans, uniform annotation of monosaccharides is challenging. However, in EUROCarbDB, there is an embedded GlycoCT and MonosaccharideDB, which uses a controlled vocabulary for annotating constituent monosaccharides with unified names that are easily translated to computer-readable formats (Aoki-Kinoshita, 2008, 2013; Ceroni et al., 2007; Frank and Schloissnig, 2010; Von der Lieth et al., 2011).
GlycoBase
GlycoBase is an open-access resource containing N-glycan data for classifying and assigning N-glycan structures from the HPLC, UPLC, and CE platforms (Baycin et al., 2014; Lu et al., 2011; Saldova et al., 2014; Stöckmann et al., 2013). It is a repository of over 350 2-AB-labeled N-linked structures in GU (Baycin et al., 2014; Campbell et al., 2008) and provides information on N-glycan positions and their exoglycosidase digests (Campbell et al., 2008). Likewise, with GlycoBase, it is also possible to visualize constituent monosaccharides and their linkage orientation (Baycin et al., 2014; Campbell et al., 2008). Advancing GlycoBase is the data matching automation software, autoGU, which assigns N-glycan peaks from HPLC and provides information of their exoglycosidase products (Artemenko et al., 2010; Campbell et al., 2008). While the GlycoBase software has improved glycomics research, the cumbersome task of manually exporting sample sets to other file formats and the likelihood of data integration errors limit its use (Artemenko et al., 2010). This appears to be overcome by the GlycoExtractor database (Artemenko et al., 2010).
GlycoExtractor
GlycoExtractor is another web-based resource for analyzing spectra from HPLC, HILIC, and MS platforms (Artemenko et al., 2010; Saldova et al., 2011, 2014). In GlycoExtractor, samples are assigned based on their peak number and the experimental date, and it exports desired file formats to other platforms such as EUROCarbDB for detailed structural assignments (Artemenko et al., 2010; Baycin et al., 2014). Unlike the GlycoBase, data extraction and exporting in GlycoExtractor are automated. For example, Artemenko et al. (2010) have shown that exporting data from 100 profiles into XML or JSON formats, which manually would have taken 90 min to perform, could be done in 1–2 sec using GlycoExtractor (Artemenko et al., 2010).
GlycomeDB
GlycomeDB is a web-based resource containing a collection of N-glycan structures from several databases and comprises over 35,056 structures (Ranzinger et al., 2009). Embedded GlycoCT and the glycoUpdateDB interfaces make cross-linking between databases possible, thereby providing complete specific information of each N-glycan (Baycin et al., 2014). In this context, GlycoUpdateDB uploads datasets from multiple databases, translates them into a GlycoCT format, and then incorporates them into the GlycomeDB (Baycin et al., 2014). Additionally, species-specific N-glycan data and anomeric configuration of monosaccharides, whether alpha or beta, can be obtained using this platform (Ranzinger et al., 2009).
Consortium for Functional Glycomics Database
The consortium for functional glycomics (CFG) database is a large resource containing a collection of glycomic datasets (8626 glycan sequences) from MALDI-TOF-MS, nuclear magnetic resonance (NMR), and N-glycan arrays (Baycin et al., 2014; Frank and Schloissnig, 2010; Raman et al., 2006; Von der Lieth et al., 2011). In the CFG, it is possible to search for an array of N-glycan profiles because it integrates other O- and N-databases such as CarbBank and glycominds. In this study, N-glycans can be searched by name, molecular mass, or monosaccharide composition, and aided by the substructure interphase, researchers are able to build and modify specific N-glycans by comparing with a given template (Baycin et al., 2014; Raman et al., 2006). Enabled by the cartoonist program, N-glycan structures can be assigned and viewed in the form of a PDF or JPG. In the CFG, data analysis is hierarchical. For example, N-glycan profiles from tissues and cells using MS are organized according to these hierarchical levels: species→tissue→sample→N-/O-linked glycan profile→high/low-molecular-weight glycans (Raman et al., 2006).
GLYCOSCIENCE.de
The GLYCOSCIENCE.de is a web-based resource containing N-glycan structural data from NMR and MS platforms and comprises over 23,233 structures. GLYCOSCIENCE.de is able to link different data sources, such as the protein data bank and the CCSD, for adequate structural description (Frank and Schloissnig, 2010; Lütteke et al., 2006; Von der Lieth et al., 2011). The complex nature of glycans requires a unique encoding scheme that describes all the chains in the glycan structure. GLYCOSCIENCE.de applies the LInear Notation for Unique description of Carbohydrate Sequences (LINUCS) scheme that uniquely defines all monosaccharide linkages present, thus simplifying the glycan search facility within this resource (Lütteke et al., 2006). A very important feature of GLYCOSCIENCE.de is the GlycoCT, which is useful for classifying cell surface macromolecules. Embedded in GLYCOSCIENCE.de are tools that display the three-dimensional representation of the glycan structural coordinates and glycosidic linkages (Aoki-Kinoshita, 2013).
GlycoWorkbench
The GlycoWorkbench is a unique resource designed as part of the EUROCarbDB, which provides a graphical interface for interpreting N-glycan data obtained from MS spectra (Ceroni et al., 2008; Von der Lieth et al., 2011). In the GlycoWorkBench, N-glycans from experimental MS peaks are first paired with N-glycans in the theoretical list using an in silico fragmentation engine. Specified N-glycan annotation in the GlycoWorkBench is achieved by cross-linking with other glycan databases such as the GLYCOSCIENCE.de, the CarbBANK, and the CFG databases (Ceroni et al., 2008). The embedded GlycanBuilder allows complete editing and visualization of glycan structures. In the GlycanBuilder, various symbols can be assigned to monosaccharide units and modification of glycan structures is possible. For example, the ring size, the anomeric configuration, and the linkage types of glycan structures can be defined (Ceroni et al., 2008).
Conclusions
The field of glycomics is undergoing a revolution and advances in this area are attributed to recent technological innovations that aid N-glycan analysis. When compared with genomics, metabolomics, and proteomics where there are well-established databases, glycomic databases are still underdeveloped mainly because of N-glycan heterogeneity and different degrees of branching. Nonetheless, a combination of the few glycomic databases with highly sensitive analytical techniques has made it possible to understand how aberrant N-glycans are linked to multiple chronic diseases. This suggests that N-glycan profiles might, in the next couple of years, be one of the most robust biomarkers for risk stratification that will improve detection and set the pace for preventive treatments for chronic diseases. Although at present glycan studies are mainly focused on chronic diseases, it will be intriguing to explore and identify specific N-glycan traits that relate to certain acute diseases.
In all, this analysis on glycomics offers strategies to build a robust, postgenomic innovation roadmap for glycan-driven biomarkers as the field is anticipated to mature further and gain greater prominence in the near future.
Footnotes
Acknowledgments
This work was supported by Australia-China International Collaborative Grant (NH&MRC-APP1112767-NSFC81561128020) and National Natural Science Foundation of China (81273170, 81370083, 81673247, and 81573215).
Author Disclosure Statement
The authors declare that no conflicting financial interests exist.