
Abstract
Abstract
Nonalcoholic fatty liver disease (NAFLD) is a growing global public health concern and becoming the leading cause of liver disease worldwide. The estimated global prevalence of NAFLD is ∼25% depending on the country and the assessment method used to establish the diagnosis. Meta-analyses suggest that the highest prevalence is in the Middle East (31.8%) and South America (30.4%), and the lowest in Africa (13.5%). In the United States, between 75 and 100 million individuals were estimated to have NAFLD. This important disease is associated with increased incidence of liver-related deaths, hepatocarcinoma, and overall mortality. Fibrosis stage, among other histological characteristics, is the most critical factor in predicting all-cause and disease-specific mortality in NAFLD. The ability to detect fibrosis early in NAFLD patients is critical in controlling mortality associated with this highly prevalent disease. We present here an expert review on recent advances in novel blood biomarkers, for example, the Wisteria floribunda agglutinin-positive mac-2 binding protein (WFA+-M2BP), type IV collagen 7S, chitinase 3 like 1 (CHI3L1; YKL-40), and insulin-like growth factor-1 (IGF-1). Algorithms using multiple biomarkers such as alpha-2-macroglobulin, mir34a, YKL-40, and hemoglobin A1c (HbA1c; NIS4), enhanced liver fibrosis (ELF), Hepascore, FibroMeter, FibroTest, FIBROSpect, FIB-C3, and ADPAPT are highlighted. Novel technologies such as tandem mass spectrometry to directly measure protein turnover rate of the key proteins involved in hepatic fibrosis, as an indicator of fibrogenesis, are also discussed. In conclusion, NAFLD is a growing global health problem that warrants long-term funding, research, and training of scholars across the fields of public health diagnostics, systems sciences, nutrition, hepatology, and clinical oncology.
Introduction
Nonalcoholic fatty liver disease (NAFLD) is defined as having excess fat content in the liver, typical over 5% by weight. NAFLD has two types: nonalcoholic fatty liver (NAFL) and nonalcoholic steatohepatitis (NASH). NAFL is defined as those NAFLDs with no evidence of liver cell damage (ballooning of the hepatocytes), whereas NASH is NAFL plus inflammation and liver cell damage, with or without fibrosis.
NAFLD is becoming the leading cause of liver disease in the world. The estimated worldwide prevalence is about 25% depending on the country and the assessment method used for diagnosis (Rinella, 2015). Younossi et al. (2016) conducted a meta-analysis of 86 studies with a sample size of 8,515,431 from 22 countries and found that the global prevalence of NAFLD is 25.24% with the highest prevalence in the Middle East (31.79%) and South America (30.45%), and the lowest in Africa (13.48%). In the United States, between 75 and 100 million individuals were estimated to have NAFLD (Rinella, 2015). The prevalence of NAFLD in Asian countries was estimated to be 27.4% (Fan et al., 2017). The prevalence is reportedly higher in populations with obesity (51.34%), hyperlipidemia (69.16%), hypertension (39.34%), and metabolic syndrome (42.54%) (Cheng et al., 2013; Farrell and Larter, 2006; Younossi et al., 2016).
The typical clinical progression paths of NAFLD are as follows: NAFLD to NASH, then to fibrosis and cirrhosis, and finally to liver failure and hepatocarcinoma (HCC), although up to 50% of HCC cases may occur in the absence of cirrhosis (McPherson et al., 2015; White et al., 2012). About 15–20% of NAFLD patients progress to NASH (Williams et al., 2011) and 30–40% of NASH patients develop fibrosis, and among them, 15–20% progress further to advanced fibrosis (stage F3/F4 liver fibrosis) or cirrhosis (stage F4 liver fibrosis) (Singh et al., 2015).
Interestingly, other researchers have shown, however, that patients with NAFLD could develop fibrosis without NASH. For example, in a recent study, 132 of 389 patients (33.9%) with significant fibrosis had no NASH and 39 of the patients (10.0%) even had no inflammation (Pelusi et al., 2019).
NAFLD is associated with increased incidence of liver-related mortality, HCC, and overall mortality (Ascha et al., 2010; Younossi et al., 2016). Hagstrom et al. (2017) conducted a retrospective cohort study of 646 biopsy-proven NAFLD patients to assess the risk of severe liver disease with liver fibrosis. They found that the hazard ratios (HR) of severe liver disease increased with increasing stages of fibrosis (HR 5.48 for stage 2, 14.28 for stage 3, and 104.52 for stage 4), and the presence of NASH did not increase the risk (Hagström et al., 2017).
Ekstedt et al. (2015) showed that the fibrosis stage is the strongest predictor for disease-specific mortality in NAFLD after up to 33 years of follow-up. Vilar-Gomez et al. (2018) conducted a multinational study of 458 patients with biopsy-confirmed NAFLD with bridging fibrosis (F3, n = 159) or compensated cirrhosis (222 patients with Child–Turcotte–Pugh scores of A5 and 77 patients with scores of A6) and showed that the fibrosis stage, but no other histological characteristics, predicted all-cause and disease-specific mortality in NAFLD.
Le et al. (2017) analyzed the association between advanced fibrosis and the overall mortality in 6000 individuals, of whom, 30.0% had NAFLD and 10.3% had advanced fibrosis. They showed that the 5- and 8-year overall mortality in NAFLD subjects with advanced fibrosis was significantly higher than individuals without NAFLD (18% and 35% vs. 2.6% and 5.5%, respectively) and NAFLD with advanced fibrosis is an independent predictor for mortality (HR = 3.13, 95% confidence interval [CI] 1.93–5.08, p < 0.001) (Le et al., 2017).
Dulai et al. (2017) conducted a meta-analysis of 1495 NAFLD patients and they found increased risk of mortality with increases in the stages of fibrosis. They showed that the mortality rate of liver-related mortality increased exponentially with increasing stages of fibrosis: 1.41-, 9.57-, 16.69- and 42.3-fold increases in patients with stage 1, 2, 3, and 4 fibrosis were observed compared with subjects with no fibrosis (stage 0) (Dulai et al., 2017).
Therefore, the ability to detect fibrosis early in NAFLD patients is critical in controlling mortality associated with this highly prevalent disease. This expert review offers an analysis of the recent developments in noninvasive blood biomarkers for NAFLD. We do not review those scoring systems that are pathology based such as the NASH activity score (NAS), steatosis, activity, and fibrosis (SAF score), the NAFLD fibrosis score (NFS), or that can be calculated from routine laboratory tests such as the FIB4 score or the aspartate aminotransferase (AST):platelet ratio index (APRI). Many of the noninvasive scoring systems, including NAS, FIB4, APRI, and BARD scores, only yield high negative predictive values (NPVs) but poor positive predictive values (PPVs).
Therefore, they are only useful in excluding patients without advanced fibrosis and avoiding unnecessary liver biopsies (Xiao et al., 2017). Nor are we reviewing those based on imaging techniques, including transient elastography, magnetic resonance elastography, shear wave elastography, and acoustic radiation force impulse. We focus here on novel blood biomarkers or biomarker-based algorithms, including those that require further validation, to help develop better noninvasive blood biomarkers for routine screening, diagnosis, and monitoring of NAFLD-related fibrosis.
Individual Biomarker Advances
Liver fibrosis is a natural wound healing response caused by various insults (hepatitis, toxins, free fatty acids etc.) that induce inflammation and hepatic cell injury. The major cellular processes include activation of hepatic stellate cells to become myofibroblasts and the formation of extracellular matrix, resulting in the loss of hepatocytes and the accumulation of extracellular matrix and fibrillar collagens (Fig. 1). Molecules involved in these processes can serve as biomarkers, including proteins, microRNAs (miRNAs), and long noncoding RNAs (lncRNAs). The biomarkers involved in regulation of fibrogenesis might be better than those that are merely an indication of the end results of fibrogenesis (e.g., collagens) (Fig. 1).
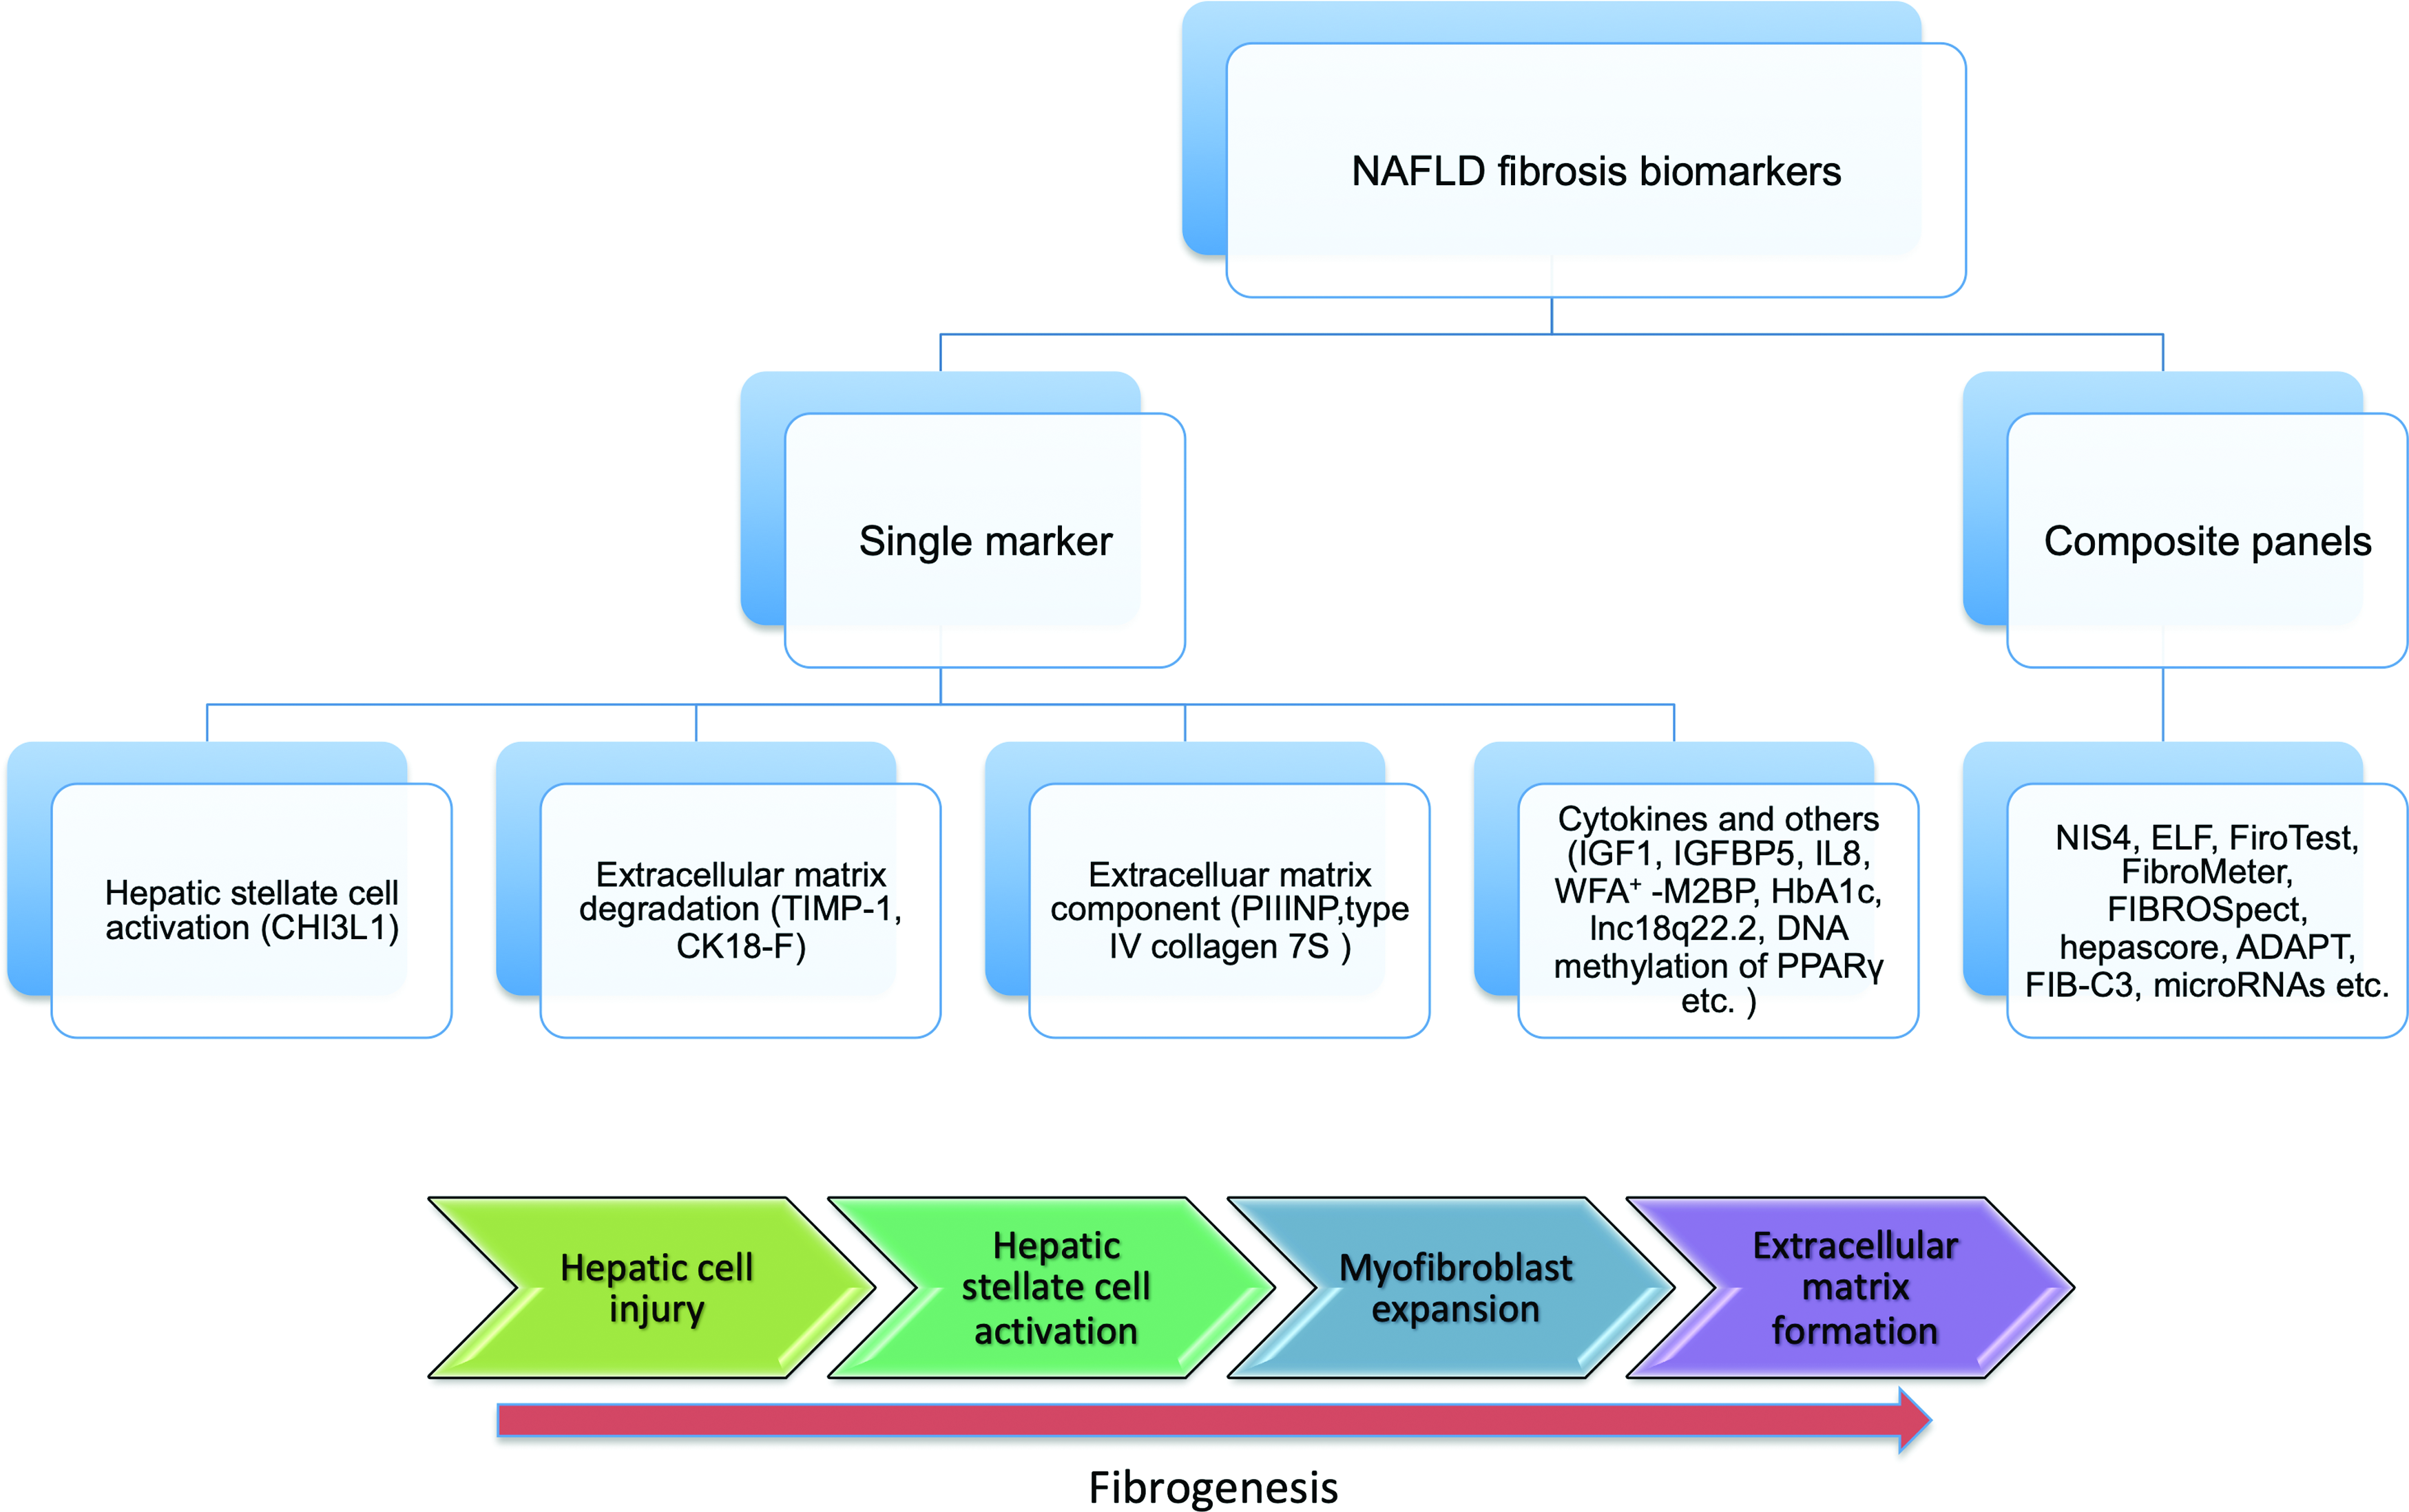
A diagram showing individual biomarkers with their respective potential roles in fibrosis and the composite panels using various combinations of individual markers.
WFA+-M2BP and type IV collagen 7S
Ogawa et al. (2018) analyzed the performance of the Wisteria floribunda agglutinin-positive mac-2 binding protein (WFA+-M2BP) and type IV collagen 7S in detecting significant fibrosis in 165 patients with liver biopsy-diagnosed NAFLD. They found that the area under the curve (AUC) of serum WFA+-M2BP using a cutoff value of 0.83 ng/mL for the diagnosis of fibrosis stage ≥2 was 0.832 (95% CI: 0.771–0.894) and the AUC of serum type IV collagen 7S using a cutoff value of 5.2 ng/mL for the diagnosis of fibrosis stage ≥2 was 0.837 (95% CI: 0.778–0.898) (Ogawa et al., 2018) (Table 1). They found that using the above cutoff scores, WFA+-M2BP identified 73.2% (n = 60) of the patients with significant fibrosis, and type IV collagen 7S identified 80.5% (n = 66) of them (Ogawa et al., 2018). A total of 62.2% (n = 51) had both above the threshold (Ogawa et al., 2018).
Recently Identified Noninvasive Individual Blood Biomarkers for Nonalcoholic Fatty Liver Disease-Related Fibrosis
APRI, AST (aspartate aminotransferase):platelet ratio index; AUC, the area under the curve; IGF1, insulin-like growth factor-1; IGFBP-5, insulin-like growth factor-binding protein 5; PIIINP, terminal peptide of procollagen III; PPARγ, peroxisome proliferator-activated receptor gamma; WFA+-M2BP, Wisteria floribunda agglutinin-positive mac-2 binding protein; CHI3L1, chitinase 3 like 1.
WFA+-M2BP is also named M2BPGi for the Mac2-binding protein glycosylation isomer. The official gene name for Mac-2 binding protein is galectin 3 binding protein (LGALS3BP) (www.genecards.org). The WFA-M2BP test is available from Sysmex Corporation, Kobe, Japan (https://sysmex.co.jp). Glycoproteins could be potential biomarkers for liver fibrosis and additional glycoproteins as biomarkers for fibrosis await further discovery.
Chitinase 3 like 1 (YKL-40) and type IV collagen 7S
Chitinase 3 like 1 (CHI3L1) was initially identified as a biomarker of fibrosis for hepatitis B virus (HBV), hepatitis C virus (HCV), and patients (Huang et al., 2015; Kamal et al., 2006; Lin et al., 2018; Mushtaq et al., 2019; Wang et al., 2018). Kumagai et al. (2016) measured CHI3L1 (YKL40) in 111 NAFLD patients and found that serum CHI3L1 levels in NAFLD patients increased with severity of liver fibrosis. CHI3L1 has an AUC of 0.764 with a sensitivity of 70% and a specificity of 76.8% in detecting advanced fibrosis in NAFLD patients.
The advantage of CHI3L1 is that it does not seem to correlate with any scores of steatosis, inflammation, and ballooning in NAFLD patients (Kumagai et al., 2016). When combined with type IV collagen 7S using the algorithm (−0.0545 + type IV collagen 7s × 0.3456 + YKL-40 × 0.0024), the AUC increased to 0.8763 using a cutoff value of 2.06 (Kumagai et al., 2016). CHI3L1 is available from Proprium Biotech USA and Hangzhou Proprium Biotech Co. Ltd (http://propriumbio.com). CHI3L1 was included in the NIS4 algorithm (refer to the later part of the review) using alpha-2-macroglobulin, mir34a, YKL-40, and hemoglobin A1c (HbA1c) for the identification of NAFLD patients who need treatment (NAS ≥4; F ≥ 2) (Hanf et al., 2018).
Hemoglobin A1c
Tanaka et al. (2019) showed that HbA1c was associated with fibrosis of NAFLD patients (Hanf et al., 2018). They showed that the frequency of potential liver fibrosis (defined as FIB-4 index ≥1.3) was 19%, 22%, 30%, 52%, and 31% in different HbA1c groups of <4.9%, 5.0–5.9%, 6.0–6.9%, 7.0–7.9%, and ≥8.0%, respectively, indicating that the prevalence of NAFLD and liver fibrosis of NAFLD increased with HbA1c levels up to 8.0% HbA1c (Tanaka et al., 2019). In a multivariate analysis, they demonstrated that an HbA1c level ≥6.5% was significantly associated with potential liver fibrosis (p = 0.017, HR = 1.7) (Tanaka et al., 2019). HbA1c was also included in the NIS4 algorithm (Hanf et al., 2018).
Cytokeratin 18 fragment
Aida et al. (2014) analyzed serum cytokeratin 18 fragment (CK18-F) level as a noninvasive biomarker for NAFLD. They found that serum CK18-F levels were closely correlated with steatosis, inflammation, ballooning, and with the overall NAFLD activity score (NAS). CK18-F has an AUC of 0.762 and 0.757 for predicting the presence of NAFL and definite NASH at the cutoff of 230 and 270 U/L, respectively, with a sensitivity of 0.89 and a specificity of 0.65 for NAFL and a sensitivity of 0.64 and a specificity of 0.76 for NASH (Aida et al., 2014). However, for staging NAFLD-related liver fibrosis, CK18-F only showed a statistically significant difference between F0 and F1 (p = 0.0102), but did not show differences among F1, F2, F3, and F4 (Aida et al., 2014).
Tissue inhibitors of metalloproteinase 1
Yilmaz and Eren (2019) analyzed transforming growth factor beta 1, transforming growth factor beta 2, matrix metalloproteinase (MMP)-2, MMP-7, MMP-9, tissue inhibitors of metalloproteinase (TIMP)-1, and TIMP-2 between NAFLD patients and controls and found that only TIMP-1 levels were significantly higher in patients with significant fibrosis (fibrosis stage ≥2; 2624 ± 1261 pg/mL) than in those without (fibrosis stage 0−1; 2096 ± 906 pg/mL; p = 0.03).
Insulin-like growth factor-1 and insulin-like growth factor-binding protein 5
Colak et al. (2012) found that serum concentrations of human insulin-like growth factor-1 (IGF-1) were significantly decreased in patients with moderate-to-severe fibrosis (F2–F3) compared with patients with no or mild fibrosis (F0–1) (mean of 57 and 141 mg/L, respectively; p = 0.001). An AUC of 0.85, a sensitivity of 75%, and a specificity of 91% were achieved with a cutoff threshold of 63.6 mg/L (Colak et al., 2012). In addition, they also found that serum insulin-like growth factor-binding protein 5 levels were significantly higher in patients with moderate-to-severe fibrosis compared with patients with no or mild fibrosis (628 and 962 mg/L, respectively) (p = 0.028). At the threshold of 630.1 mg/, the AUC was 0.74 with a sensitivity of 75% and a specificity of 80% (Colak et al., 2012).
Terminal peptide of procollagen III
Tanwar et al. (2013) showed that the terminal peptide of procollagen III (PIIINP) is good marker to discriminate differing degrees of NASH (AUC of 0.9 for NAS 0–4 vs. 5–8, AUC of 0.92 for ballooning 0–1 vs. 2, AUC of 0.96 for lobular inflammation 0–1 vs. 2–3) (Tanwar et al., 2013). However, PIIINP as a marker for discriminate differing degrees of fibrosis is poor with AUC of 0.63 for F0 versus F1–2, and AUC 0.65 for F0–1 versus F2 (Tanwar et al., 2013).
Interleukin-8
Glass et al. (2018) analyzed serum samples for 24 cytokines of 97 patients with biopsy-proven NAFLD. In an initial analysis, serum interleukin (IL)-8, osteopontin, and monocyte chemoattractant protein 1 showed an association with hepatic fibrosis in NAFLD patients (Glass et al., 2018). After controlling for age, sex, body mass index (BMI), diabetes mellitus, hypertension, and metabolic syndrome status, only IL-8 remained significantly associated with hepatic fibrosis (p = 0.001) (Glass et al., 2018).
Circulating lncRNA lnc18q22.2
Atanasovska et al. (2017) performed gene expression profiling of 4383 lncRNAs in 82 liver biopsy samples from individuals with NASH (n = 48), simple steatosis but no NASH (n = 11), and healthy controls (n = 23) and identified a liver-specific lncRNA (lnc18q22.2, RP11-484N16.1) that correlated with NASH grade (r = 0.51, p = 8.11 × 10⁻⁷), lobular inflammation (r = 0.49, p = 2.35 × 10⁻⁶), and NAFLD activity score (r = 0.48, p = 4.69 × 10⁻⁶). However, whether this lncRNA could be detected in blood and its performance as a biomarker for liver fibrosis of NALFD await further investigation.
Plasma DNA Methylation of Peroxisome Proliferator-Activated Receptor Gamma
Hardy et al. (2017) showed that quantitative plasma DNA methylation of peroxisome proliferator-activated receptor gamma (PPARγ) gene promoter was able to stratify 26 patients with biopsy-proven NAFLD into mild group and severe group with an AUC of 0.91 using the threshold PPARγ CpG1 methylation value of 81%. The sensitivity and specificity were 0.83 and 0.93, respectively (Hardy et al., 2017).
Multibiomarker-Based Diagnostic Panels
NIS4
Harrison et al. (2017) reported at the European Association for the Study of the Liver International Liver Congress in 2017 the alpha-2-macroglobulin, mir34a, YKL-40, and HbA1c (NIS4) algorithm for the identification of patients who needed treatments (NAS ≥4; F ≥ 2) with an AUC of 0.82, a sensitivity of 73.12%, and a specificity of 78.15%, using a cutoff value of 0.4255 (Table 2).
Noninvasive Composite Blood Biomarkers for Nonalcoholic Fatty Liver Disease-Related Fibrosis
CK18-F, cytokeratin 18 fragment; HbA1c, hemoglobin a1c; NAS, NASH activity score; NASH, nonalcoholic steatohepatitis; NIS4, alpha-2-macroglobulin, mir34a, YKL-40, and HbA1c; ELF, enhanced liver fibrosis; TIMP, tissue inhibitors of metalloproteinase; HA, hyaluronic acid; GGT, γ-glutamyl transferase.
For this purpose, NIS4 performed better than other tests, including NFS, enhanced liver fibrosis (ELF), FibroTest, Fibrometer, BARD, APRI, and FIB4 as measured by comparing their AUC values, and furthermore, NIS4's performance was not affected by steatosis. At the 2018 American Association for the Study of Liver Diseases (AASLD) conference, the above research group further reported the results of NIS4 for the detection of patients who needed treatment (NAS ≥4; F ≥ 2), in 714 patients at risk of NASH (Hanf et al., 2018). They showed that the NIS4 algorithm is not affected by age, sex, presence of type 2 diabetes, or obesity (Hanf et al., 2018). They reported an AUC of 0.83 (0.795–0.858).
Three cutoff values were proposed: at the optimal cutoff of 0.5, it had a sensitivity of 74% and a specificity of 75%; at a low cutoff of 0.3, it had a sensitivity of 90% and a specificity of 51%; at a high cutoff of 0.7, it had a sensitivity of 52% and a specificity of 90% (Hanf et al., 2018). NIS4 is available from Genfit Corp (Loos, France) (https://genfit.com) and also available in the United States from the LabCorp. (https://labcorp.com).
ELF panel
Guha et al. (2008) tested a panel of markers—ELF panel, consisting of TIMP 1, hyaluronic acid (HA), and aminoterminal peptide of procollagen (PIIINP). They found that the ELF has an AUC of 0.90 (CI 0.84–0.96) in distinguishing severe fibrosis (F3–4) from less severe fibrosis (F1–F2) with a threshold of 0.3576 for a sensitivity of 80%, a specificity of 90%, a PPV of 71%, and an NPV of 94% (Table 1) (Guha et al., 2008). For distinguishing significant fibrosis (F2–4) from less severe fibrosis (F0–1), the overall AUC was 0.82 (CI 0.75–0.88) using a threshold of −0.1068 for a sensitivity of 70%, a specificity of 80%, a PPV of 70%, and an NPV of 80% (Guha et al., 2008). The ELF algorithm is as follows: DS (discriminant scores) = −7.412 + (ln(HA) × 0.681) + (ln(P3NP) × 0.775) + (ln(TIMP1) × 0.494).
FibroTest (FibroSure)
FibroTest used a proprietary computational algorithm using 10 biochemicals in combination with age, gender, height, and weight and is available from BioPredictive (https://biopredictive.com/), Paris, France, and as FibroSure by LabCorp. (https://labcorp.com/), Burlington, NC, USA. FibroTest generates a composite score for liver fibrosis (0.0–1.0, F0–F4), hepatic steatosis (0.0–1.0, S0–S3), and NASH (0.0–0.75, N0–N2). A low cutoff of 0.30 was used to rule out advanced fibrosis (sensitivity of 88–95%) and a high cutoff of 0.70 for identifying advanced fibrosis (specificity of 97–99%) (Ratziu et al., 2006) (Table 2).
FibroMeter
The FibroMeter NAFLD score is based on serum HA, platelets, prothrombin index, serum aminotransferase levels, ferritin, glucose, and body weight (Aykut et al., 2014). However, the algorithm (regression score) is proprietary by Echosens SA (Paris, France) (https://echosens.com). Aykut et al. (2014) found that the sensitivity and specificity of the FibroMeter™ NAFLD score for significant fibrosis were only 38.6% and 86.4%, respectively, and for advanced fibrosis were 66.7% and 72.1, respectively (Table 2).
FIBROSpect
FIBROSpect consists of three biomarkers: alpha-2-macroglobulin, HA, and TIMP-1. It was initially developed for diagnosing fibrosis in chronic HCV patients with a sensitivity and a specificity of 83.5% and 66.7%, respectively (Patel et al., 2008). In the 2017 AASLD conference, Abdelmalek et al. (2017) showed that in 792 biopsy-confirmed NAFLD patients, it has a sensitivity of 81% and a specificity of 74% and an AUC of 0.85 (Table 2). FIBROSpect was introduced by Prometheus Lab. Inc., San Diego, USA.
Hepascore
Hepascore includes six variables, age, sex, α2-macroglobulin, HA, bilirubin, and γ-glutamyl transferase (GGT), and it was originally developed for staging fibrosis in HCV patients (Adams et al., 2005).
The algorithm is: Hepascore
In the above formula, age is entered in years, male sex = 1, female sex = 0, α2-macroglobulin in g/L, hyaluronate in μg/L, bilirubin in μmol/L, and GGT in U/L. (Adams et al., 2005).
Adam et al. (2011) showed that Hepascore has an AUC of 0.907, a sensitivity of 0.87, and a specificity of 0.89 for liver cirrhosis (F4) using a cutoff value of 0.7, an AUC of 0.814, a sensitivity of 0.76, and a specificity of 0.84 for advanced liver fibrosis (F3–F4) using a cutoff value of 0.37, and an AUC of 0.729, a sensitivity of 0.51, and a specificity of 0.88 for significant liver fibrosis (F2–4) using a cutoff value of 0.44. They showed that for the prediction of liver cirrhosis, Hepascore performed better than FibroTest, FIB4, APRI, and BARD scores, with a sensitivity and NPV at 87% and 98.5%, respectively (Adams et al., 2011). In a meta-analysis, it was found that Hepascore had better diagnostic ability for significant and advanced fibrosis in HCV, HBV, and alcoholic liver disease than for NAFLD (Huang et al., 2017).
ADAPT algorithm including PRO-C3
Daniels et al. (2019) established ADAPT, an algorithm incorporating PRO-C3, and demonstrated that it accurately identified patients with NAFLD and advanced fibrosis. ADAPT included Age, presence of DiAbetes, PRO-C3, and plaTelet count (“ADAPT”). PRO-C3 is an ADAMTS-generated neo-epitope marker of type III collagen formation. Daniels et al. (2019) tested initially the ability of PRO-C3 alone as a marker and showed that it has an AUC 0.81 (95% CI 0.74–0.87) for the identification of patients with advanced fibrosis (F ≥ 3). Next, they developed the ADAPT algorithm and showed that it has an AUC of 0.86 (95% CI 0.79–0.91), better than PRO-C3 alone, and other existing fibrosis scores, including APRI, FIB-4, and NFS (Daniels et al., 2019).
FIB-C3 score
Boyle et al. (2017) presented, at the 2017 AASLD conference, a combination of age, BMI, T2DM, platelets, and Pro-C3, named the FIB-C3 score. They validated it using a cohort of 433 well-characterized patients with biopsy-proven NAFLD (F0: N = 90; F1: 88; F2: 99; F3: 94; F4: 62), dividing into a discovery cohort (n = 320) and a validation cohort (n = 113) (Boyle et al., 2017). They showed that FIB-C3 performed much better than FIB-4; FIB-C3 has an AUC of 0.86 and 0.85, a sensitivity of 77% and 76.7%, and a specificity of 80.4% and 75.9% in the discovery and validation cohorts, respectively (Boyle et al., 2017).
A model including the HA, CK18, and TIMP-1 panel
Pimentel et al. (2015) presented at the 2015 AASLD conference the combination of serum HA, CK18, and TIMP-1 to predict advanced fibrosis in NAFLD patients. They build a model including the three markers and the performance is good with an AUC of 0.9 compared with an AUC of 0.40, 0.73, and 0.82 for the TIMP-1, CK18, and HA alone, respectively. The sensitivity was 88.2% and the specificity was 84.1% for predicting advanced fibrosis defined as fibrosis stages 3–4, and NASH as NAS >5 in a cohort of 180 NAFLD patients (Pimentel et al., 2015) (Table 1).
miRNA miR-34a, -192, -27b, -122, -197, and -30c
Lopez-Riera et al. (2018) tested on serum samples 18 miRNAs that were previously identified as significantly altered in NAFLD patients, or in NASH and severe fibrosis groups. First, they compared the performance of these miRNAs for their ability to differentiate NAFLD with SAF score ≥2. They found that the best performing miRNA was miR-34a, with an AUC of 0.76. Interestingly, the miRNA ratios miR-34/197 and miR-192/197 showed better AUCs of 0.81 and 0.78, respectively. For the prediction of patients with NAS ≥5, they found that the best individual predictor was miR-27b with an AUC of 0.73 and the miRNA ratios miR192/30c and miR-27b/30c performed even better with AUC of 0.78 and 0.79, respectively (Lopez-Riera et al., 2018).
Finally, they analyzed the ability of these miRNAs in the prediction of severe fibrosis in NAFLD patients, and found that the best individual miRNA was -30c (downregulated in F > 2) with an AUC of 0.72, and miRNA ratios such as -27b/30c and -27b/197 performed slightly better (AUC = 0.77 and 0.75, respectively) (Lopez-Riera et al., 2018). Compared with FIB-4, the miRNA ratio -27b/197 showed a higher sensitivity (83% vs. 72% for FIB-4) (Lopez-Riera et al., 2018). In summary, Lopez-Riera et al. (2018) validated six miRNAs (miR-34a, -192, -27b, -122, -197, and -30c) that were associated with NAFLD severity or fibrosis.
Future Perspectives
A biomarker or multibiomarker diagnostic panel with a perfect performance for staging fibrosis in NAFLD patients still does not exist. One compromise is to have biomarkers that could have a crude dichotomous differentiation of patients into no or modest (F0–2) and severe (F3–4) fibrosis. This may be sufficient, from a broader public health standpoint, to identify and stratify patients for better clinical management or treatment of patients with NAFLD. On the contrary, studies have shown that a diagnostic error greater than one stage of fibrosis, by sampling errors alone, occurred in as high as in 33.1% of the biopsy samples from patients (Regev et al., 2002). Nonetheless, biopsy was often used as the gold standard for the assignment of fibrosis into different stages for the comparisons of the performance of biomarkers in staging fibrosis.
However, it is unrealistic to expect a biomarker to perform much better than the accuracy of the biopsy itself, which stands around 70–80% depending on the hospital or the pathologist. Now is the right time to think about innovative ways that may perhaps replace biopsy as a gold standard for comparisons, and come up with novel metrics to evaluate fibrosis biomarkers, or better yet, establish completely new standards such as measuring fibrosis progression speed and directions rather than forcing static staging of fibrosis. For example, a time series measurement of fibrosis of the same individual might serve as a more comprehensive way to monitor fibrosis progression or regression.
A compromise to consider is to limit (or focus) the scope of biomarker application as a decision aid to minimize the number of liver biopsies needed. In this scenario, a biomarker test with a high PPV or a high NPV could help to identify patients who do not need biopsy. In this regard, a step-wise algorithm seems to work better than those using all biomarkers at the same time as a composite score.
For example, Sebastiani et al. (2006) applied a step-wise algorithm of APRI and FibroTest to identify patients with significant fibrosis (F > 2) among HCV carriers with elevated alanine aminotransferase (ALT), and showed over 94% diagnostic accuracy while the algorithm reduced the number of liver biopsies needed by about 50%. In addition, Demir et al. (2013) showed that a step-wise combination of FIB-4 and BARD increased diagnostic accuracy in NALFD patients to allow 67% of cases to be correctly classified without missing a single case of advanced fibrosis.
Novel technologies such as proteomics and systems biology might offer further innovation in stratifying patients by fibrosis status or progression speed. For example, Decaris et al. (2015) used tandem mass spectrometry to directly measure fibrogenesis in terms of the protein turnover rate of hepatic type I and III collagens. Patients with chronic liver diseases were provided with daily oral doses of heavy water (2H2O) for up to 8 weeks and liver biopsy and plasma samples were collected.
The amount of incorporation of deuterium (2H) into newly synthesized proteins indicated the new protein synthesis rate, which could be measured by liquid chromatography/tandem mass spectrometry. They showed that type I collagen synthesis rate was significantly correlated with the severity of liver fibrosis (p < 0.5). The quantity of newly synthesized type I and III collagen was about threefold higher in patients with advanced fibrosis (F3–F4) versus those with none to medium (F0–F2) fibrosis (Decaris et al., 2015).
In conclusion, NAFLD is a growing global public health concern that warrants long-term funding, research, and training of scholars across the fields of public health diagnostics, systems sciences, nutrition, hepatology, and clinical oncology.
Footnotes
Acknowledgments
This work was supported by grants from the National Science and Technology Major Project of China (2018ZX10302205), the National Key R&D Program of China (2016YFC1303401), and the National Natural Science Foundation of China (81572909).
Author Disclosure Statement
B.L. is a cofounder of the Hangzhou Proprium Biotech Co. Ltd.