
Abstract
Introduction
Porphyria, a pathological condition found in humans and animals, is characterized by a marked increase in the formation and excretion of porphyrins or their precursors. 10 –12 Clinically, this condition usually involves cutaneous manifestations, as well as neurological and gastrointestinal dysfunction. 15,16 Excessive amounts of δ-aminolevulinic acid (ALA), porphobilinogen, and other precursors of protoporphyrin IX (PpIX) are found in the urine and feces of individuals with acute intermittent porphyria or erythropoietic protoporphyria (EPP) 15,16 ; the latter condition is also characterized by marked photosensitivity and the presence of areas of fluorescence during acute crises. These crises can be intensified by environmental factors as well as diet deprivation, infections, hormones, and stress. 16,17
We have previously shown that the Harderian gland of Wistar rats, located in the inner corner of the eyes, is rich in PpIX, lipids, and melatonin. 4,18,19 This gland contains large amounts of porphyrins and δ-aminolevulinate synthase (ALA-S) and low ferrochelatase activity, which accounts for its very high rate of porphyrinogenesis and elevated content of PpIX. The production of porphyrins by the Harderian gland is influenced by the level of melatonin, which is in turn modulated by the animal's circadian rhythm. 20 In a review article on animal pigments, Rimington 21 described the Harderian gland, the intense secretion of PpIX, and its excretion through the naso-lacrimal duct into the nasal cavity. The passage of PpIX from the nose into the digestive tract could account for the relatively large amounts of this compound found in rat feces. PpIX may also account for the red secretion seen around the eyes and nose.
Changes in the circadian rhythm can result in stress, thereby increasing or decreasing the amount of melatonin secreted by the Harderian gland, and this in turn can influence the metabolism of this gland. 22,23 Stressful conditions, such as food restriction and alterations in the circadian cycle or housing conditions, greatly increase the gland's activity and PpIX production 22 –24 ; this enhanced production is reflected in the PpIX content of various organs and is commonly seen as “red tears.” 19,25 This enhanced production of PpIX suggests that rats may be good models for experimental EPP.
The aim of this study was to investigate the red fluorescence found in the digestive tract of Wistar rats stressed by a restrictive liquid diet containing only 5% glucose and maintenance in total darkness during the whole experiment (up to 120 h). These conditions are known to be stressful to the animals. 19,22,24,25 The level of skin fluorescence was monitored during administration of the diet and in the subsequent recovery period, and the changes observed were correlated with those associated with transitory EPP.
Material and Methods
This study involved two experimental protocols in which a total of 65 male Wistar rats (specific pathogen free; average weight 250 g) were used. The rats were maintained under normal environmental conditions in an animal laboratory at the Center of Experimental Medicine and Surgery of the Faculty of Medical Sciences, UNICAMP. The experimental protocols were done in accordance with international guidelines for the care and use of experimental animals. This project was approved by the institutional Committee for Ethics in Animal Research (State University of Campinas–UNICAMP), Protocol n 587-1 in accordance with the ethical principles for animal research established by the Brazilian College for Animal Experimentation (COBEA).
Fluorescence was stimulated with an innocuous ultraviolet (UV) lamp (Phillips TL 4W/08, 365 nm emission, UVA range) and the resulting spectra were recorded with a plug-in spectrometer (PC2000-S, Ocean Optics Inc.) that had an optical resolution better than 1.7 nm in the red region. The spectra were recorded by positioning the optical fiber about 5 mm from the UV-illuminated region, and the spectrometer was adjusted to the required sensitivity as shown in Fig 1. All measurements of fluorescence intensity were relative, with no attempt to make absolute measurements although taking care to minimize errors from setup geometry. The excitation UV lamp and optical fiber positions relative to an animal were unchanged during experiment. The solid angle of light excitation and collections were kept constant.
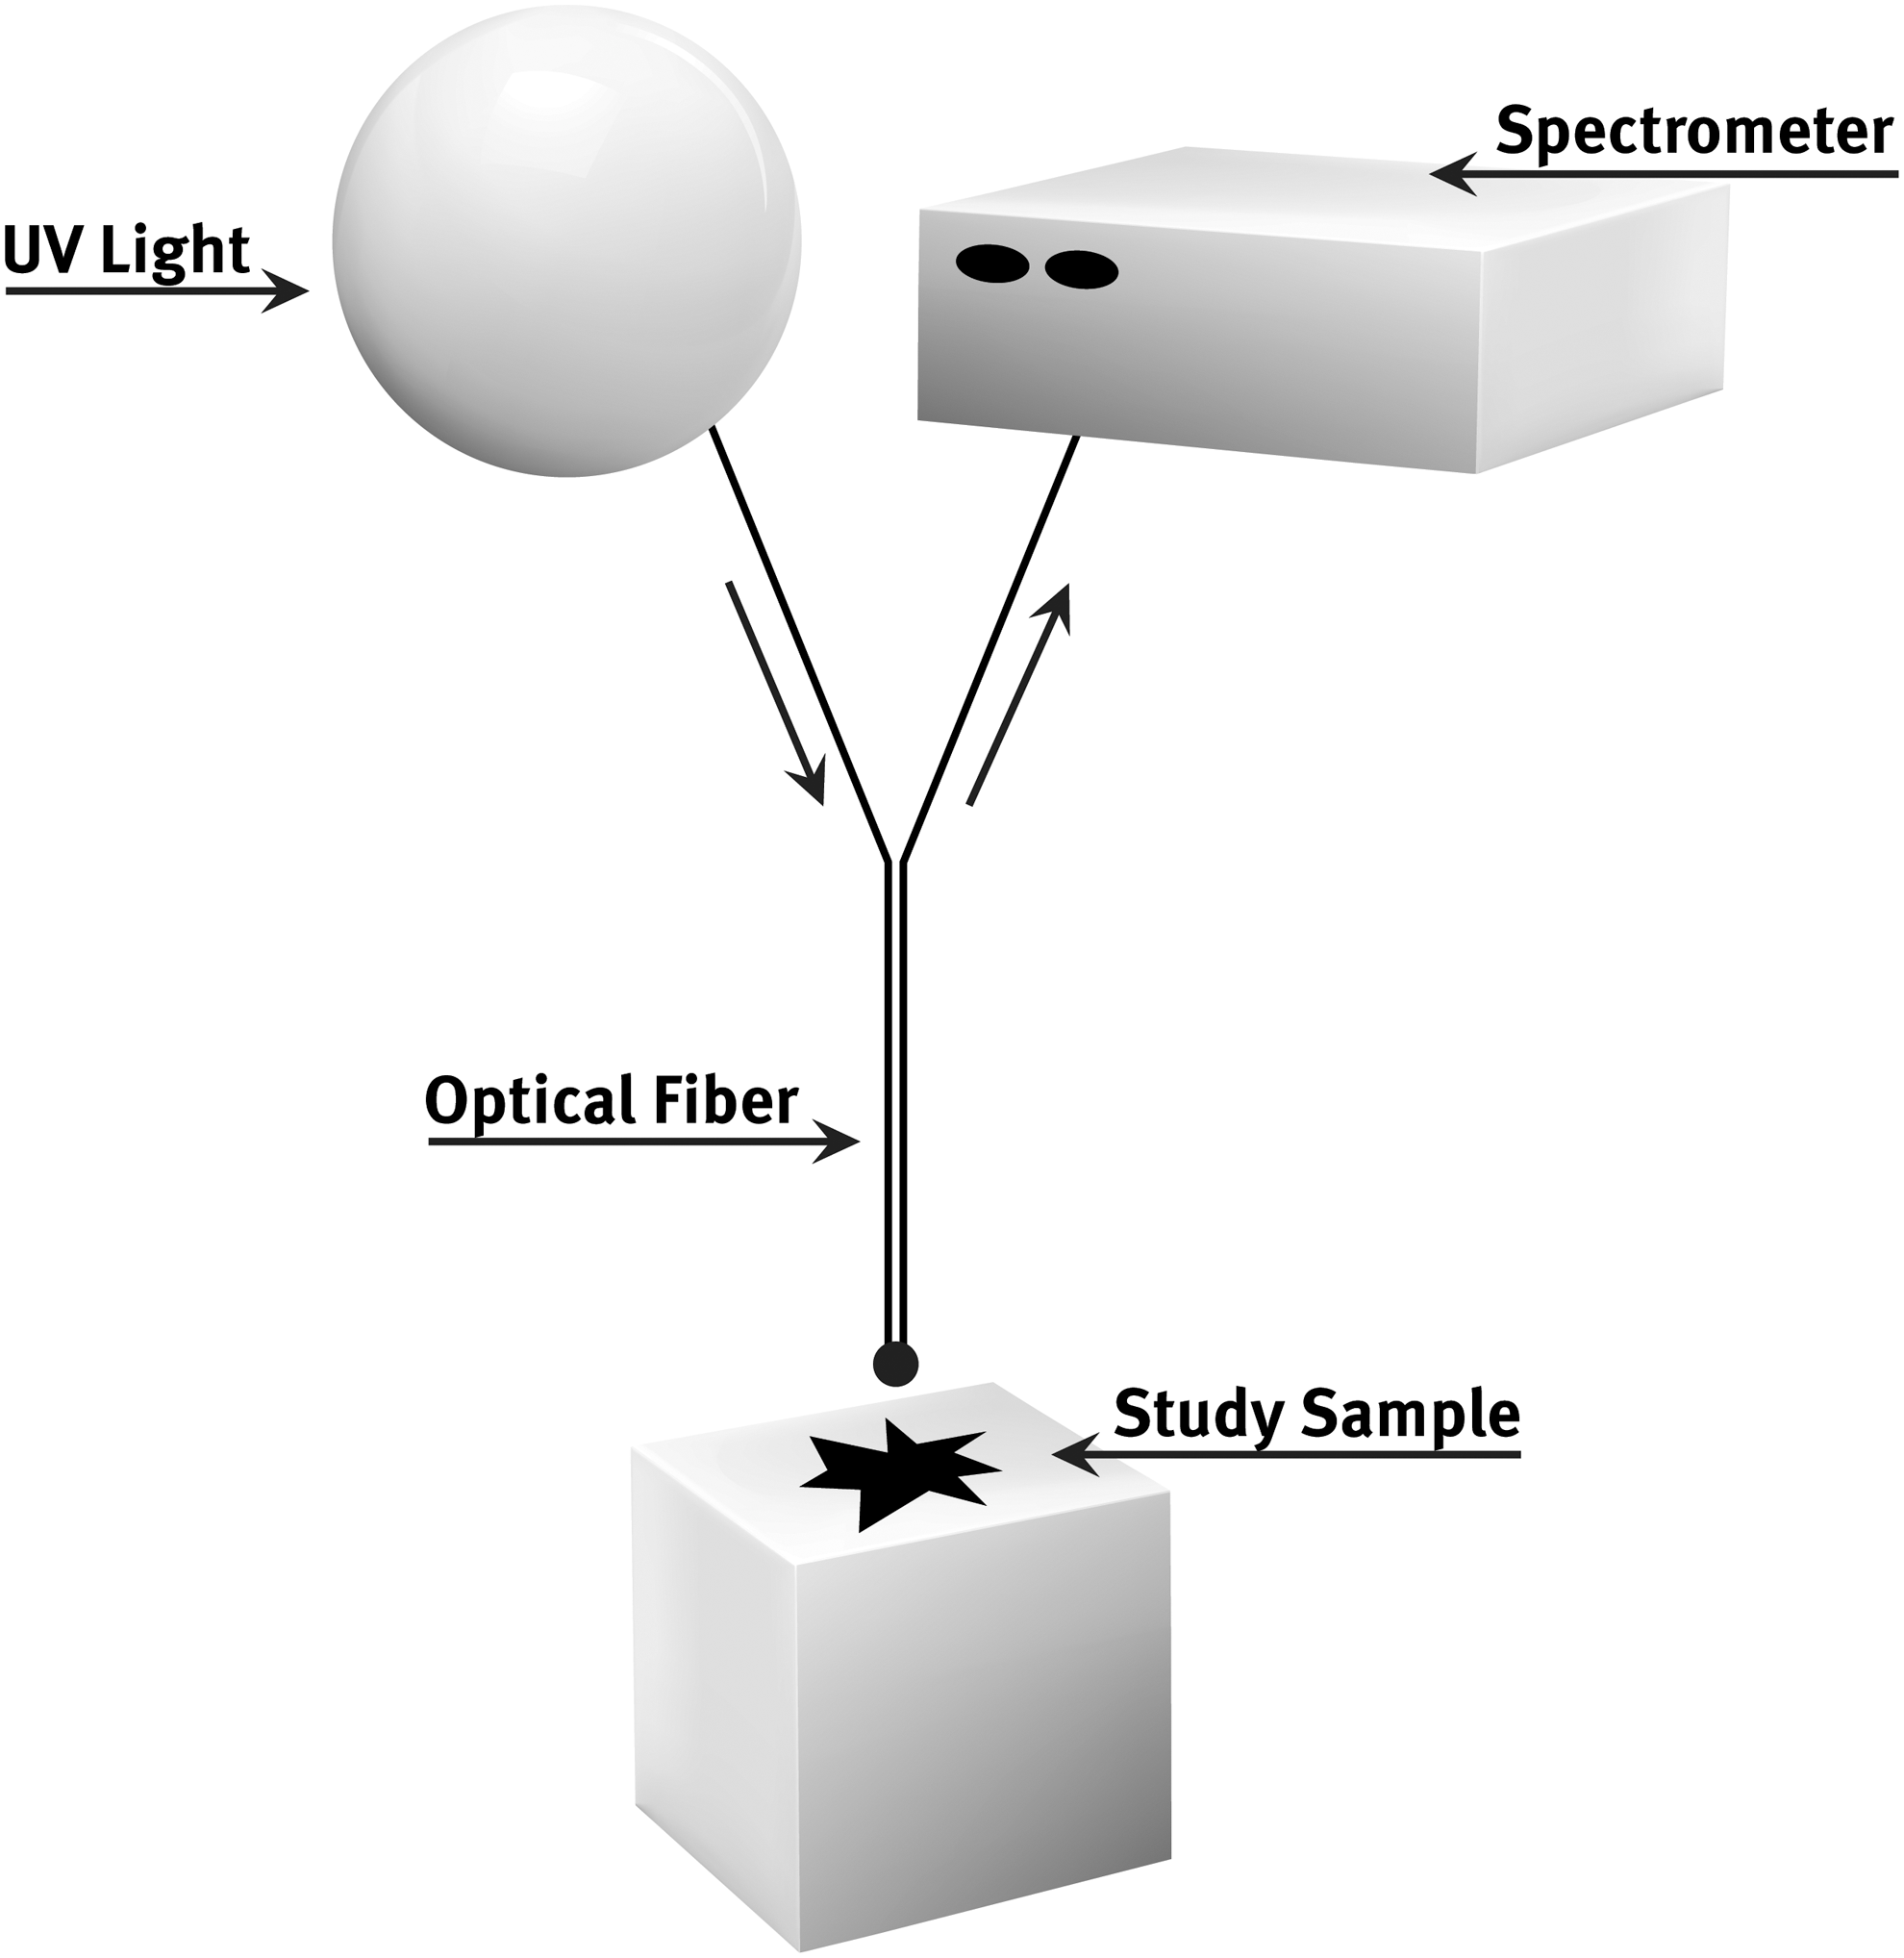
Block diagram showing the setup of the equipment used for data collection.
The subjects were always photographed with a high resolution camera (Nikon D50). The pictures were meant to register exactly what was seen with the naked eye, so no color filters were used. The Nikon D50 is a conventional RGB camera, and it was set to ISO 400 sensitivity. The pictures were taken in the dark and only UV illumination was used. According to Photomedicine and Laser Surgery recommendation, the pictures were converted to the CYGM color system.
Experiment I
Thirty-five rats were randomly allocated to seven groups (1–7; n = 5 each). Group 1 (Fig. 2a) served as the control and received a normal diet whereas groups 2–5 (Figs. 2b–e) received a liquid diet of 5% glucose for 48, 72, 96, and 120 h, respectively. At the end of each period, the rats were anesthetized (sodium thiopental, 25 mg/kg, intravenously) and the intestinal tract was surgically exposed and photographed, and fluorescence spectra were obtained. Since the intestinal wall was approximately 480 μm in thickness, 26 the UV light (365 nm) could penetrate the wall and stimulate the porphyrinic content of the intestine, thus allowing data acquisition.
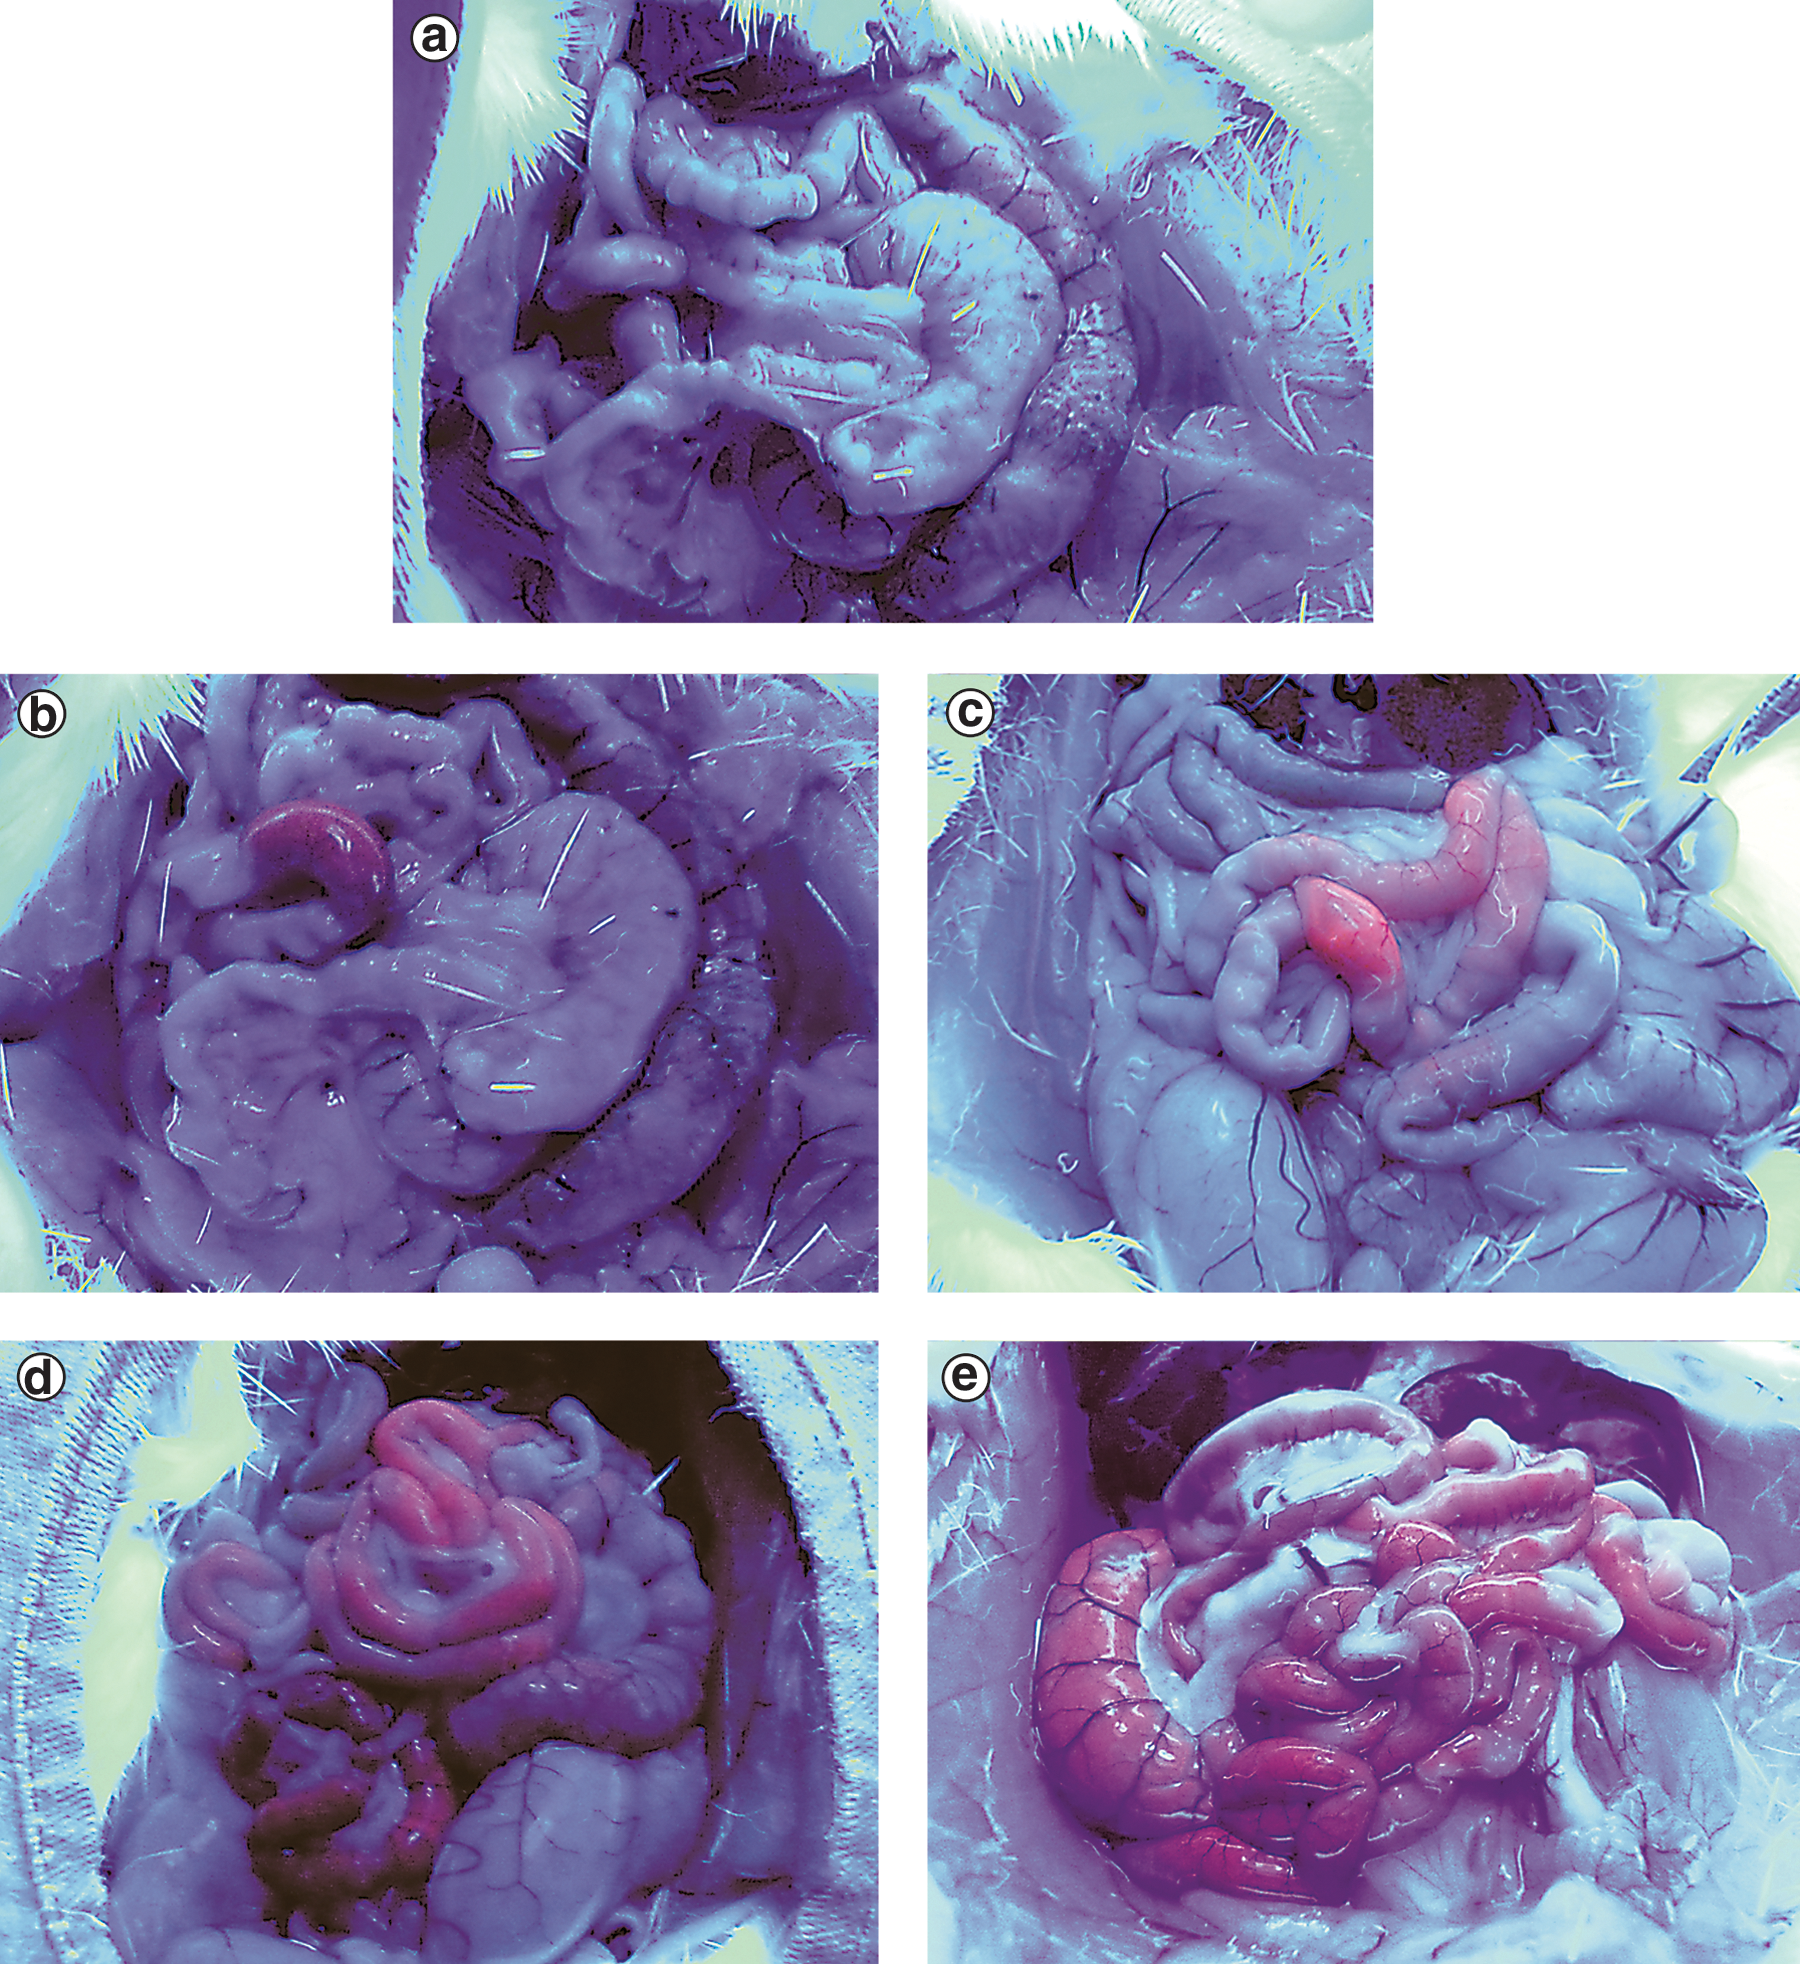
The evolution of red fluorescence under ultraviolet (UV) light, seen by the naked eye in the intestinal tract of Wistar rats fed the liquid 5% glucose diet:
After being fed the glucose diet for 120 h, animals of Groups 6 and 7 received a normal diet for 24 and 48 h, respectively. They were then anesthetized and analyzed in order to investigate a possible recovery following the return to the normal diet. In Group 6 scant fluorescence could be detected, similar to animals of Group 2 (Fig. 2b), while in Group 7 no fluorescence was found.
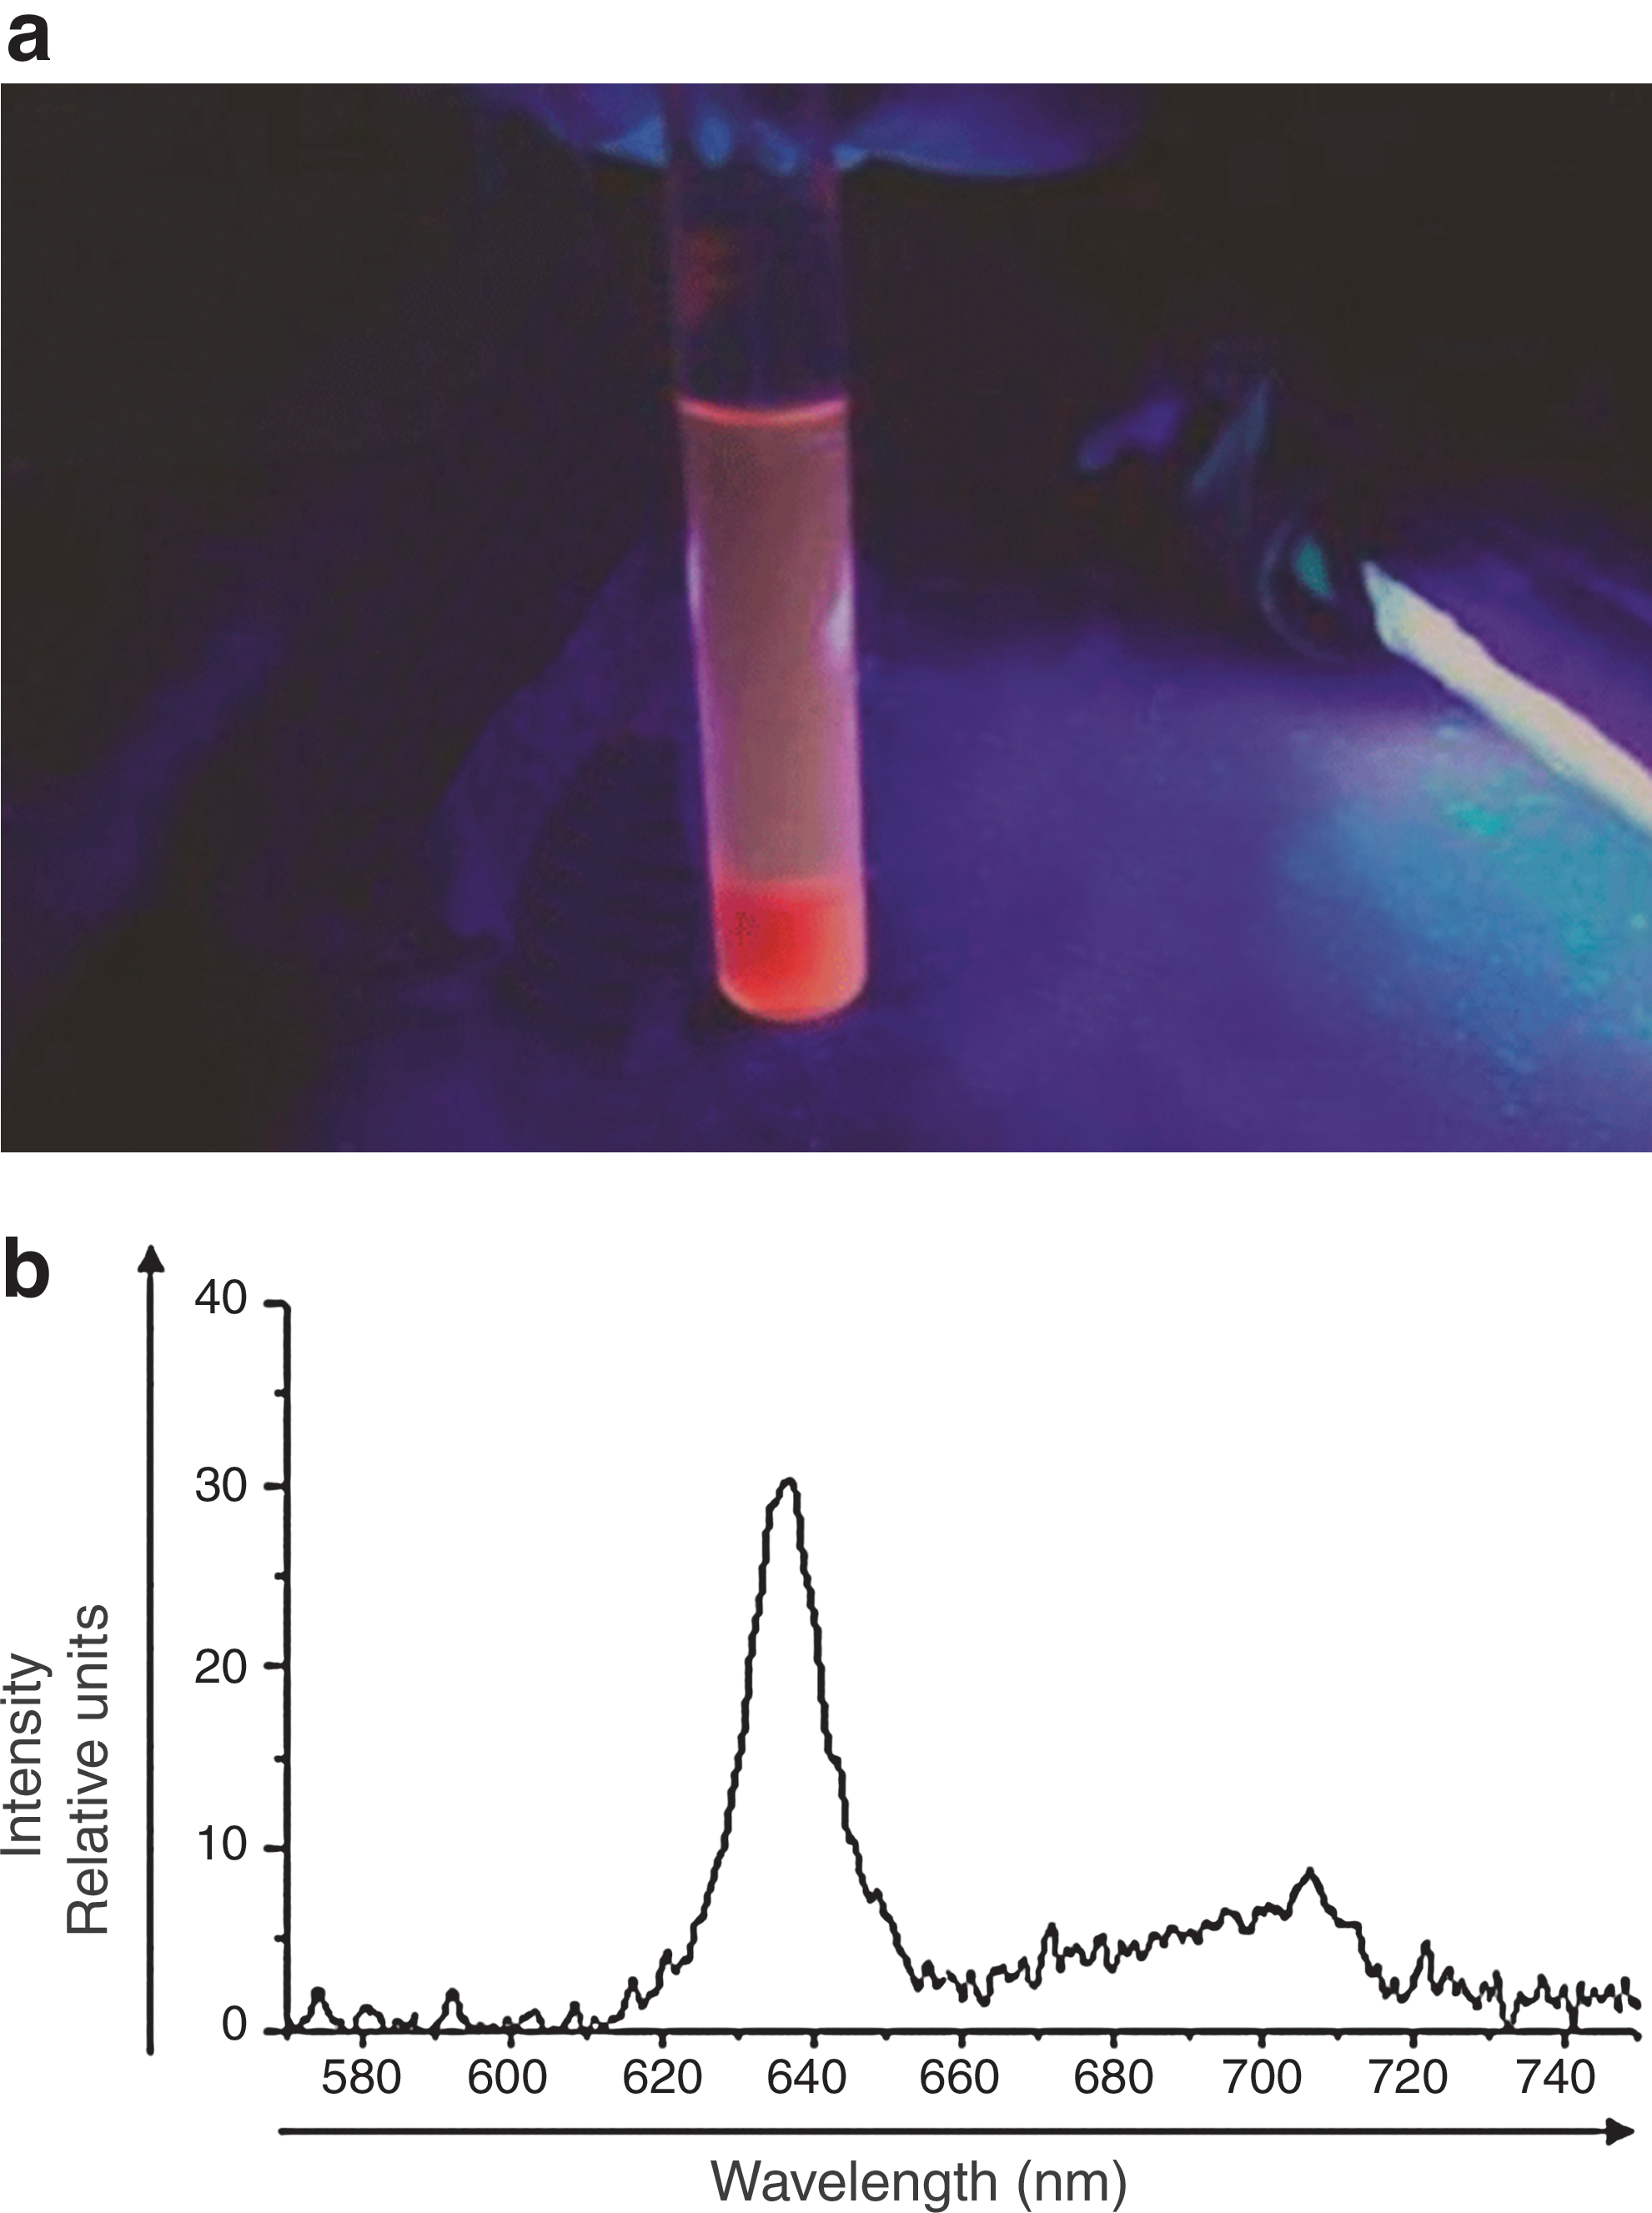
The fecal porphyrin level for the different groups was determined by using a simple qualitative procedure described by Eales et al. 27 A small lump of feces was collected and mixed with 1.0 mL of glacial acetic acid. The suspension was mixed thoroughly with 5.0 mL of ether and centrifuged. The supernatant was decanted and 1.0 mL of 1.5 N HCl was added. After thorough shaking, the acid phase and ether phase were separated. A positive test was indicated by red fluorescence in the acid phase, signalizing the presence of PpIX (Fig. 3a and 3b).
Experiment II
Thirty rats, divided into six groups of five animals each, were initially fed a normal diet and examined for UV fluorescence (as described for Experiment I) in the nose, scrotum, tail, and foot. These are the areas where the fluorescence is more intense to the naked eye as illustrated in Fig. 4. Each group (five rats) were then transferred to individual metabolic cages, kept in the dark and were fed the liquid diet of 5% glucose for up to 120 h. At the beginning of the experiment and at intervals of 48, 96, and 120 h, the rats were anesthetized and the spectra of the four external areas were recorded. The normal diet was then re-established and new spectra were obtained after 24 and 48 h. This procedure was repeated for all six groups.
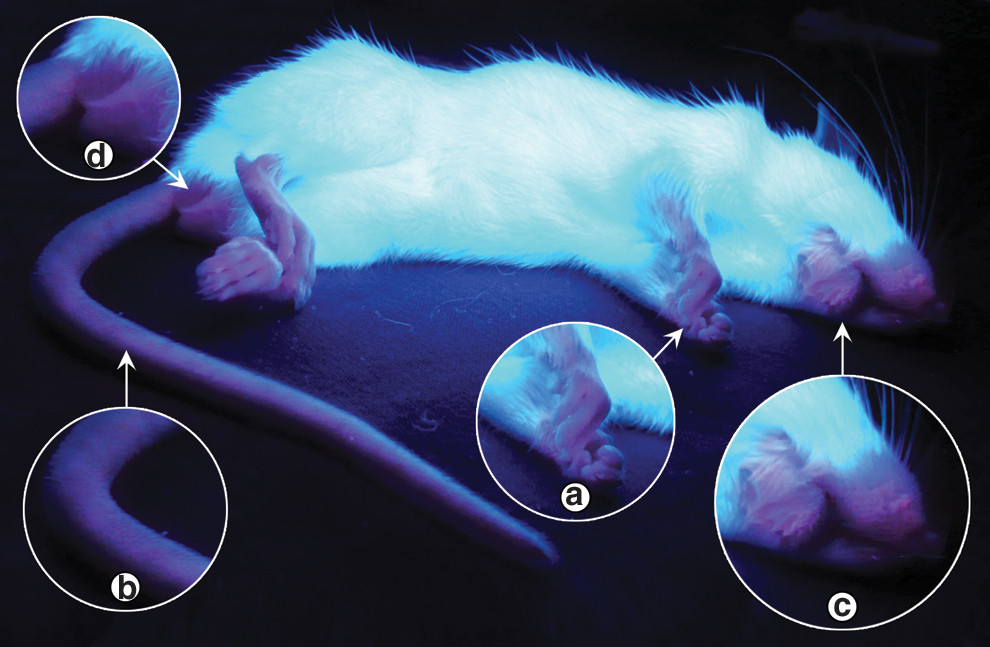
A rat from Experiment II on a liquid 5% glucose diet for 120 h presented significant red fluorescence in the four areas selected for study:
Results
Experiment I
Figure 2a–e shows examples of the UV fluorescence seen with the naked eye in the intestinal tract after different periods of glucose diet (0 [control], 48, 72, 96, and 120 h, respectively). Figure 2a shows no fluorescence at all, while the other pictures, corresponding to different time points of the glucose diet, show significant increases in fluorescent areas of the intestinal tract. In Fig. 2e (120 h) the red fluorescence is present in all intestinal extensions. By experience, 120 h is the limit time for keeping rats on the glucose-only diet. After that, it is not certain that the animals will recover.
The fecal porphyrin content of the intestinal material collected from the different groups of rats was assessed as described by Eales et al. 27 Figure 3a shows the macroscopic appearance and the fluorescence of this material, diluted in 10 mL of water in a quartz tube, from rats fed a diet of 5% glucose for 120 h; Fig. 3b shows the fluorescence spectrum of the same material. This spectrum was similar for all of the groups in this experiment, with a well-defined peak at 635 ± 1.7 nm and a band from 660 to 720 nm, characteristic of PpIX.
Experiment II
When illuminated with UV light rats given the 5% glucose diet for 48 h up to 120 h showed red fluorescence in many parts of their body where the fur is not dense, like paws, tail, nose, and scrotum (Fig. 4a–d) and near existing scars. The intensity of this fluorescence is very weak as compared with the broad band, centered on ± 480 nm, resulting from the combination of the fluorescent spectrum of many components of normal tissue as described by Dhingra et al. 28 and Fiorotti et al. 1 Figure 5 shows the plots of the mean values and normal deviation of fluorescence intensity at 638 nm for the paw, tail, nose, and scrotum of rats fed a normal diet (before the experiment, day 1) and fed a 5% glucose diet for 48 h (day 3), 96 h (day 5), and 120 h (day 6), with additional evaluations at 24 h (day 7) and 48 h (day 8) after reintroduction of the normal diet.
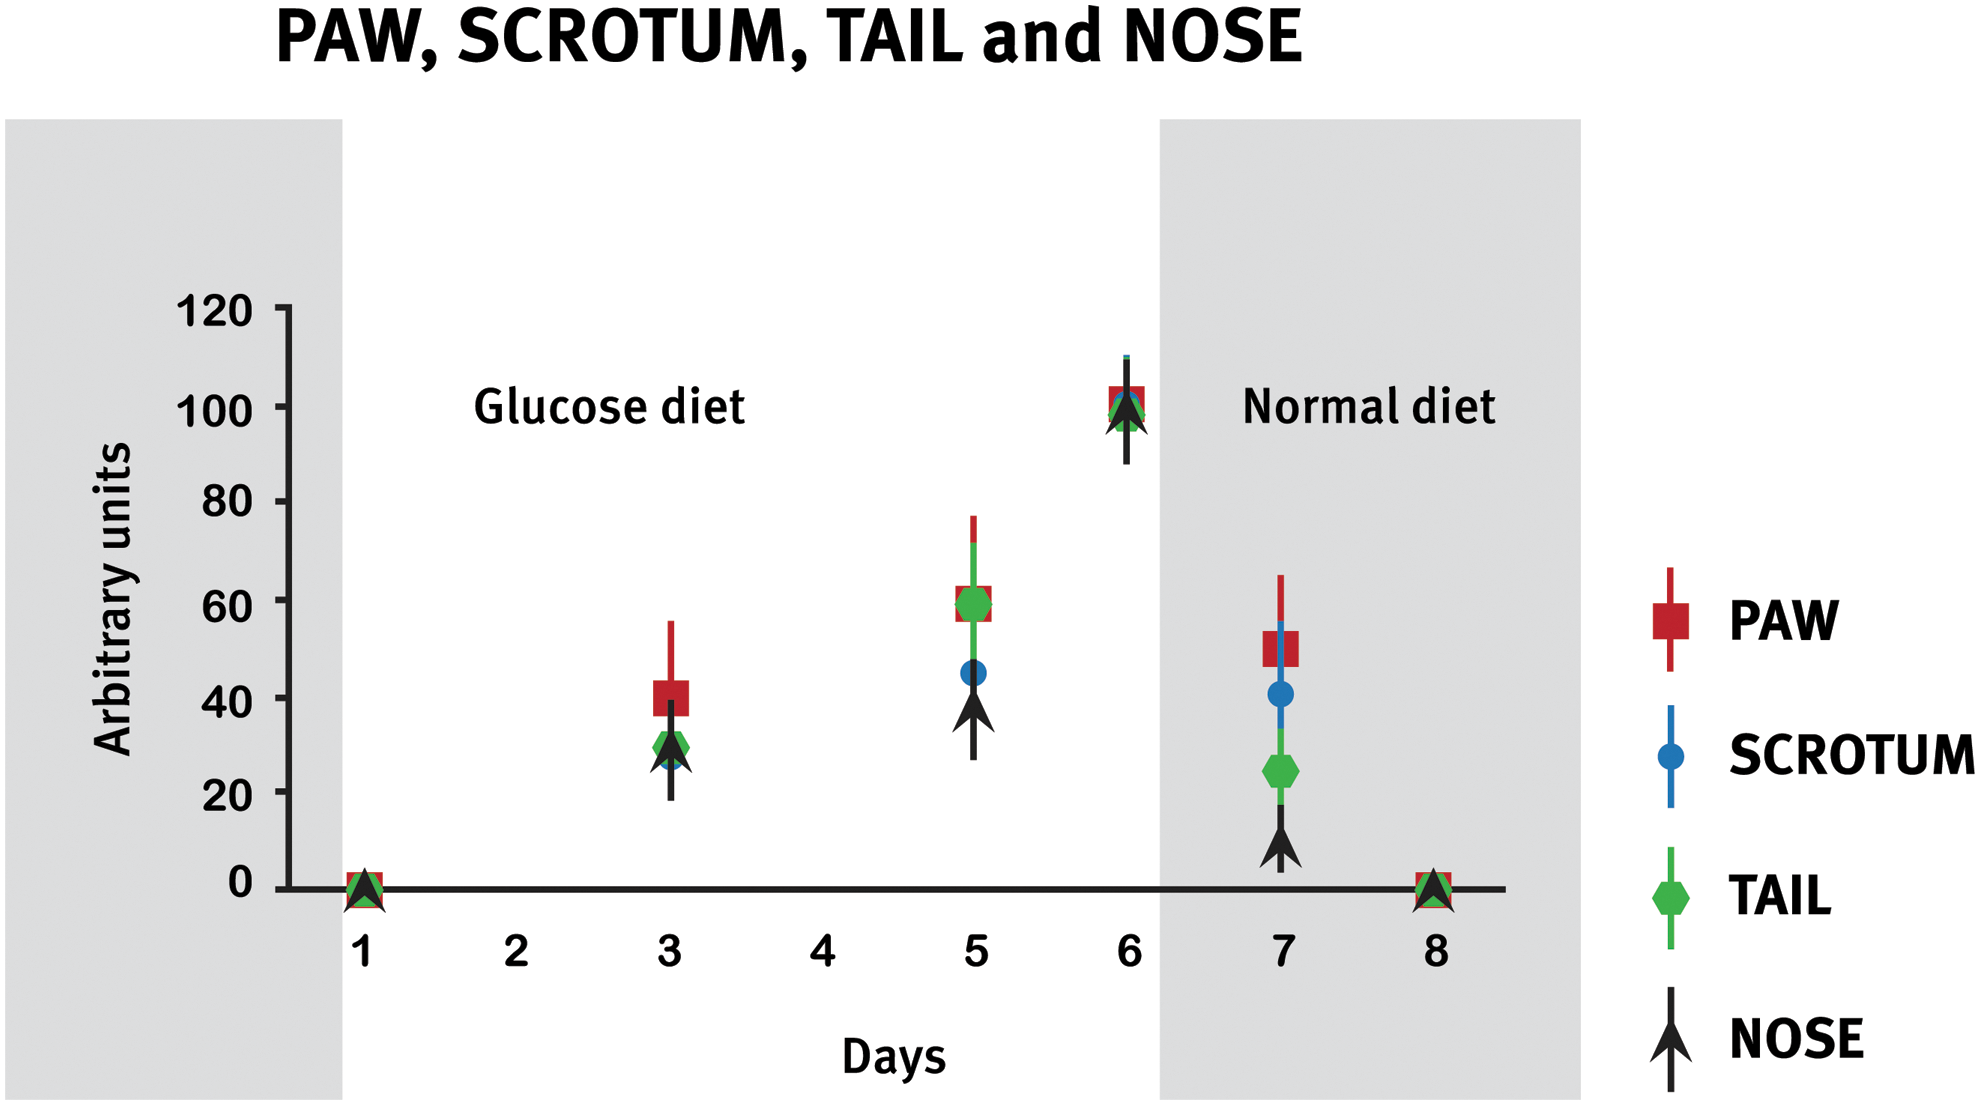
Time-dependent changes in fluorescence spectra of the four studied areas: paw, scrotum, tail, and nose.
By the naked eye this fluorescence is easily detected only at the end of the glucose diet period. Figure 4 shows the red fluorescence after 120 h.
Discussion
In a pilot study using Wistar rats, intense red fluorescence was detected in some external areas and in the intestinal tract when the rats were maintained on a restricted solid diet for >48 h. 29 As shown here (Experiment I), there was a marked increase in the luminal content of porphyrin (seen as an increase in UV fluorescence) in the intestines of rats fed a 5% glucose diet for up to 120 h. In agreement with this, the Eales test indicated the presence of porphyrin or its precursors in fecal samples and the UV spectrum identified the substance as PpIX. 27 The spectral analysis of four external areas showed a progressive increase in fluorescence with the duration of the glucose diet (up to 120 h) (Experiment II). However, this fluorescence gradually decreased during the 48 h after the re-introduction of a regular, solid diet (no fluorescence after 48 h). These findings agreed with the content of red material detected in the intestinal lumen described in Experiment I.
Dietary restriction, confinement, and changes in living habits associated with alterations in the circadian rhythm can lead to stress and marked metabolic and functional alterations. 22 –25 The Harderian gland is particularly susceptible to these alterations and responds with changes in melatonin secretion and PpIX production. 19,20,22 –24 As shown here, rats that were fed a restricted diet and kept in the dark responded with an exaggerated production of PpIX, which was mainly detected in the intestinal tract. Since the liquid diet helped to clean the intestinal lumen, it most likely facilitated the detection of fluorescence and determination of the corresponding spectra.
Stressful conditions can also raise PpIX production by alternating melatonin levels, 22 and this could have contributed to our results. The red fluorescence seen in several external regions of rats that were fed the 5% glucose diet indicated that the enhanced production of PpIX resulted in a greater content of this compound in other organs or parts of the body, in a situation reminiscent of EPP. 14 –16 The increased red fluorescence was reversed when the rats were returned to a normal diet.
Conclusions
Based on these results, we conclude that the stressful conditions used here (liquid 5% glucose diet and total darkness) greatly enhanced PpIX production by the Harderian gland of Wistar rats and resulted in experimental EPP. These findings also suggest that measuring the intensity of red fluorescence may be a reliable, noninvasive method for monitoring the porphyrin content of various tissues.
Footnotes
Acknowledgments
This work is part of the Ph.D. thesis of J.W.R. Hernandez and was advised by Professor J.H. Nicola who passed away January 2, 2010. The authors very much regret this early loss. J.W.R.H. thanks Rickson C. Mesquita and Zenner Pereira for help with data acquisition. This work was supported in part by grants from FAEPEX (UNICAMP).
Author Disclosure Statement
No competing financial interests exist.