
Abstract
This article reviews the population health improvement initiative of a Midwest regional hospital employer. Services included health risk assessments, health education, and motivational health coaching conducted telephonically. Outcomes categories for this program evaluation comprised participation rates, participant satisfaction, health status and behavior change, productivity change, health care claims savings, and return on investment. Participation rates varied widely with incentive structure, although retention of participants in coaching programs averaged 89%. The participant satisfaction rate for the last 14 months of interventions was 96%.
Four years of population health status and behavior trending showed significant improvements in smoking status, dietary fat and fiber intake, exercise, mental health (ie, stress, effects depressive symptoms in the past year, life satisfaction), readiness to change (ie, diet, exercise, stress, smoking, body weight), perceptions of overall health, an index of good health habits, sum of lifestyle health risks, and sum of risks and chronic conditions. Body mass index showed nonsignificant improvements during the years of greatest participation (years 2 to 4). Indicators of productivity demonstrated improvements as well. These gains were noted for employees across all health risk statuses, which suggests population health improvement strategies can influence productivity even for healthy employees.
Program year 3 was evaluated for health care claims savings using a 2-stage multivariate regression approach. Stage 1 was a computation of propensity-to-participate scores. Stage 2 was an estimation of per member per month (PMPM) claims savings for participant cohorts using a propensity score-weighted linear regression analysis. Participants averaged $40.65 PMPM savings over the control population. Program return on investment, including incentive costs and vendor fees, was 2.87:1. (Population Health Management 2010;13:163–173)
Introduction
Successful programs, Goetzel and Ozminkowski argued, drive high and sustained participation rates, are flexible in communication and coaching methods, rigorously evaluate and report outcomes, and document health improvements and related costs. Moreover, employers that excel provide environmental supports to employees—attending to cultural elements that affect the health and therefore the productivity of the workforce, reducing discrepancies between wellness policies and norms, demonstrating senior management support for wellness, and ensuring confidentiality of workers' personal health information.
Methods
Organizational profile
The Midwest regional hospital profiled in this case study has 4500 employees, including 1450 nurses. Forty-four percent of employees work full time, 36% work part time, and 20% work as needed; 83% are female and the average age is almost 42 years.
The hospital employer began to address environmental and cultural aspects of employee wellness in 1999. Senior management demonstrated their financial commitment to employee wellness by hiring full-time health and productivity staff. To help ensure consistency between policy and norms, senior management also incorporated culture of wellness principles into their business strategy and corporate values statement.
Employee wellness initiatives have included a smoke-free environment policy, offering healthy cafeteria choices, and team exercise challenges in which senior management demonstrate their support by getting “out in front.” Other health promotion services include free fitness center memberships, Weight Watchers at Work, and free flu shots. Since its inception, the employee wellness program has averaged 30% participation.
Intervention
In the fall of 2004, the hospital employer added to its suite of wellness initiatives a population health improvement strategy administered by Onlife Health (then Gordian Health Solutions). Not only did management believe it to be the right thing to do—a holistic approach to professional development and employee quality of life—they also made the business case. Management believed the comprehensive strategy could help prevent injuries, enhance morale, improve recruiting and retention, increase productivity, and, perhaps most importantly, achieve cost containment for health care expenses by helping employees delay, if not prevent, the onset of chronic medical conditions.
Now approaching its 5th year, the hospital employer's population health improvement program through Onlife includes annual health risk assessments (HRA) with personal health analysis reports as well as telephonic educational and motivational health coaching for the following lifestyle health risks: tobacco use, osteopenia, prediabetes, stress, lack of exercise, elevated bodyweight, blood pressure, and serum cholesterol. Of the first 4 years of intervention, the latter 2 included nicotine replacement therapy for smoking cessation program participants, while all 4 years included educational and motivational coaching. Coaching for osteopenia became available in program year 3, and a “graduate” coaching program became available in program year 4. This graduate program, called Living Healthier, was for prior coaching participants who were entering a health maintenance phase, or desired coaching that spanned multiple health categories and alternate health education opportunities.
Each program year lasted 12 months (eg, October 2004 through September 2005), which coincided with the hospital employer's benefits open enrollment cycle. Members who participated in the HRA received personal wellness reports that educate them about their health status, benchmark their healthy habit scores, and notify them of available coaching programs. Employees who took the HRA and who qualified for health coaching (83% on average) received as many as 2 letters and 2 telephone calls encouraging them to participate in coaching. Those who opted to participate in health coaching received calls and educational mailings in alternating months (ie, up to 6 outbound calls and 6 educational mailings per program year). Moreover, participants had unlimited telephonic access (toll-free) to coaching staff during hours of operation (7 a.m. to 10 p.m. Monday through Friday, and 9 a.m. to 4 p.m. Saturday, CST).
In the encourage-to-enroll process, health coaches took into account members' readiness-to-change as indicated on the HRA. Moreover, coaches assessed participants' readiness-to-change health behaviors during every call, tailoring motivational behavior change strategies to each person. Genuinely tailoring lifestyle coaching to the participant requires that goal setting be individualized. As such, goals varied widely across participants, even for those coaching programs that most people assume have only 1 goal (eg, smoking cessation). For example, with the help of their coach, participants might set short-term goals of identifying and controlling tobacco use triggers or halving the number of tobacco uses daily, even if their long-term goal is to quit using tobacco (smokeless, cigarette/pipe/cigar) within the next 6 months. Coaches also leveraged other resources available to members whenever possible; for example, encouraging participation in on-site programs such as team exercise challenges or Weight Watchers at Work.
All of the hospital's employees were eligible for these services—those enrolled and those not enrolled in the company medical plan. Spouses of employees who were enrolled in the medical plan also were eligible for these services.
Incentives for participation
The hospital employer wanted to introduce the program slowly, building trust by ensuring confidentiality of personal health information and promoting the program as a new resource to help employees improve their health. Thus they offered $30 for completing the HRA, and 2 installment payments of $25 each for ongoing health coaching participation, for a total potential incentive of $80 for the first program year. Spouses who were eligible for the program were not offered incentives to participate in any of the first 4 years of the program.
Incentives offered to employees in the 3 subsequent years, however, were more aggressive—as much as $500 for those enrolled in the medical plan, and up to $175 for those not enrolled in the medical plan. Figure 1 shows this incentive structure. Incentives paid to non-plan members were cash investments by the hospital employer; however, premium contribution changes for those enrolled in the health plan were, in fact, reductions from a higher contribution (than was actuarially recommended). Hence, nonparticipants enrolled in the medical plan provided cost recovery. One incentive type thus produced program cost while the other produced funds to apply toward the direct costs of administering the program. For program year 3, evaluated here, these incentive costs offset one another.
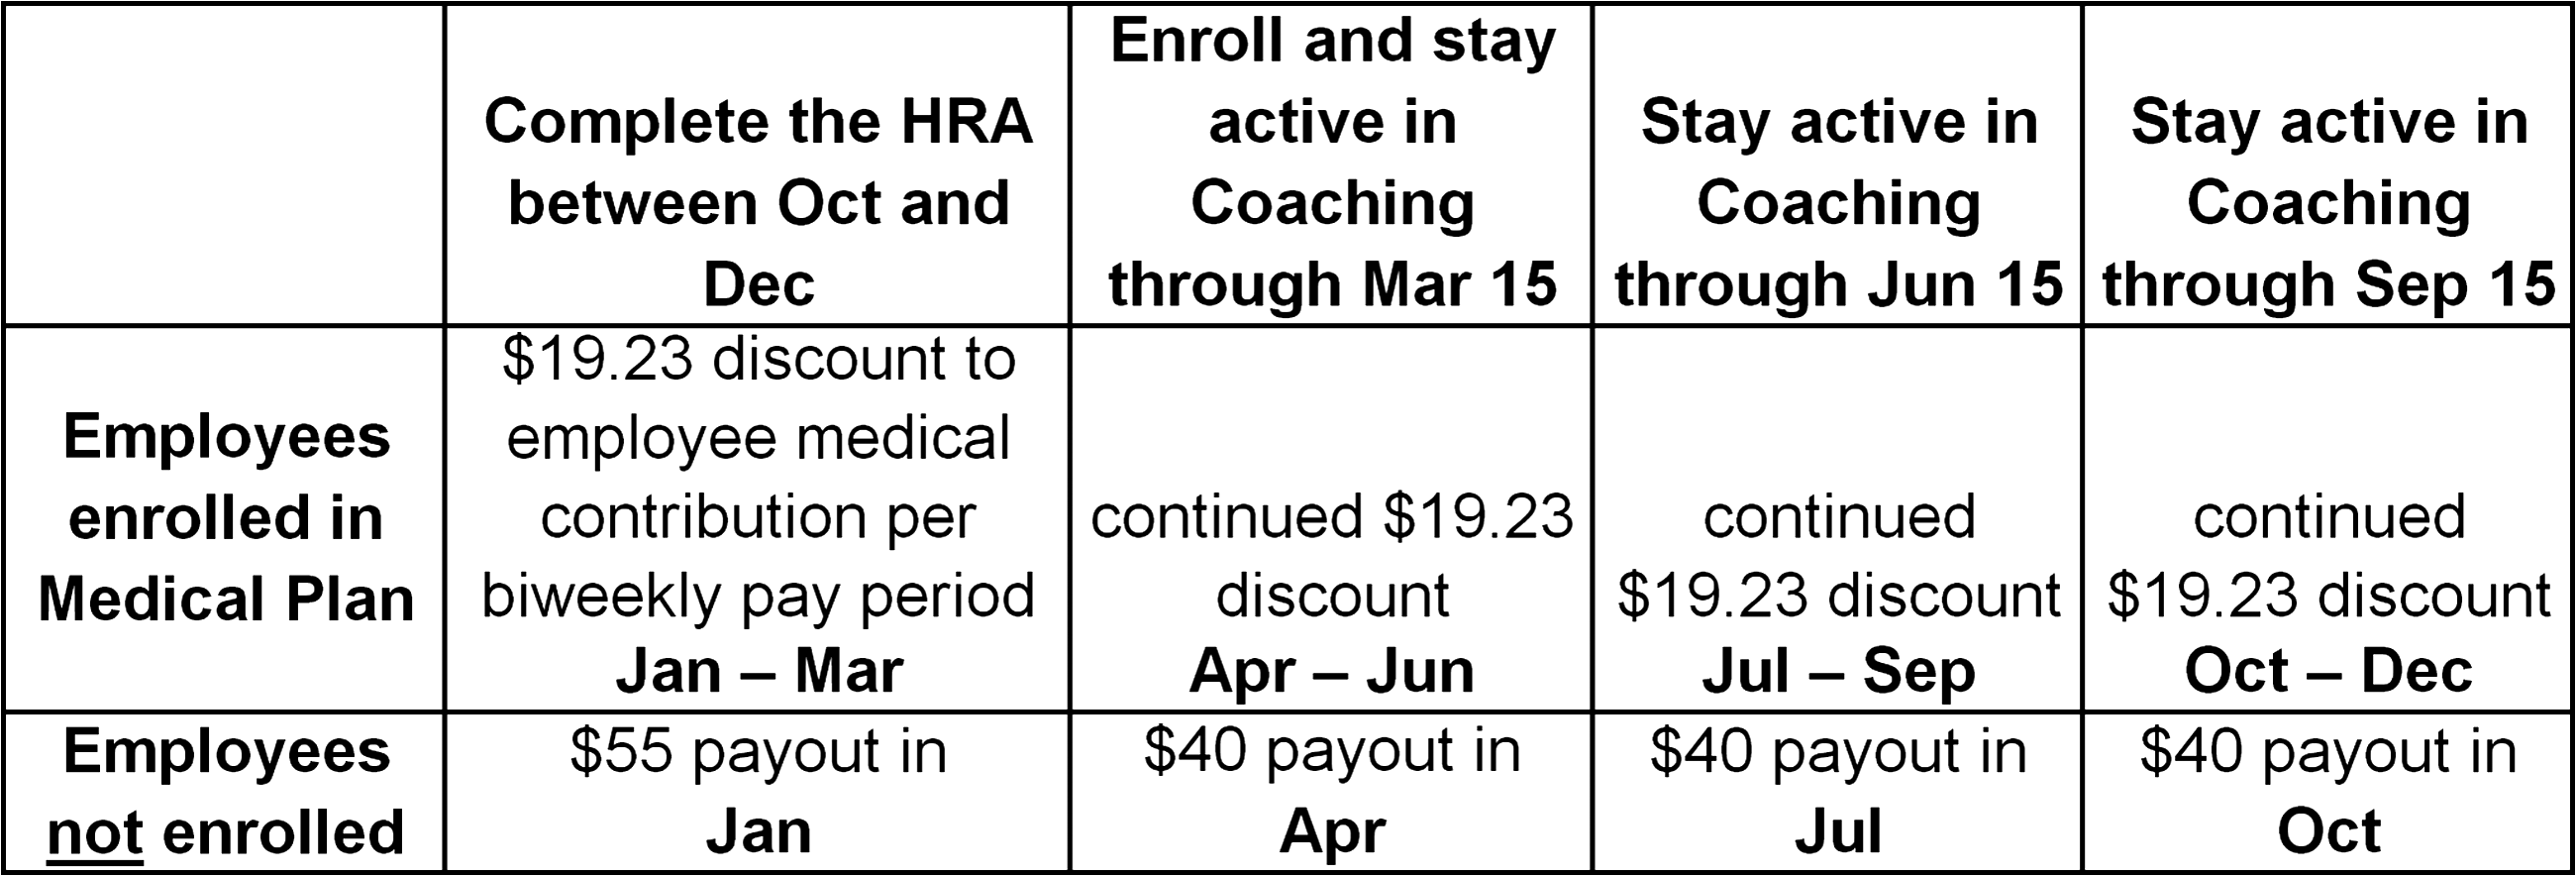
Incentive strategy for program years 2-4 for encouraging participation in health promotion program.
Results
Participation
Health risk assessment
Incentives offered to different members who were eligible for the program had profound effects on HRA participation. Eligible spouses of employees, for example, averaged less than 12% HRA participation. As Figure 2 demonstrates, incentive differences among employees who were enrolled and not enrolled in the medical plan produced great differences in HRA participation rates. For program years 2-4, the company averaged 80.4% HRA participation among employees enrolled in the medical plan, but just 34.1% among those not enrolled in the medical plan. Of the 4402 members who took HRAs during this 4-year period, 784 took it all 4 years, 969 took it 3 of 4 years, 957 took it 2 of 4 years, and 1692 took it just 1 year. This multiyear HRA participation should be seen in light of the fact that HRA rates were lower in year 1, and because 37.1% of members eligible for the HRA at any time during this 4-year period were no longer eligible by the end of program year 4.
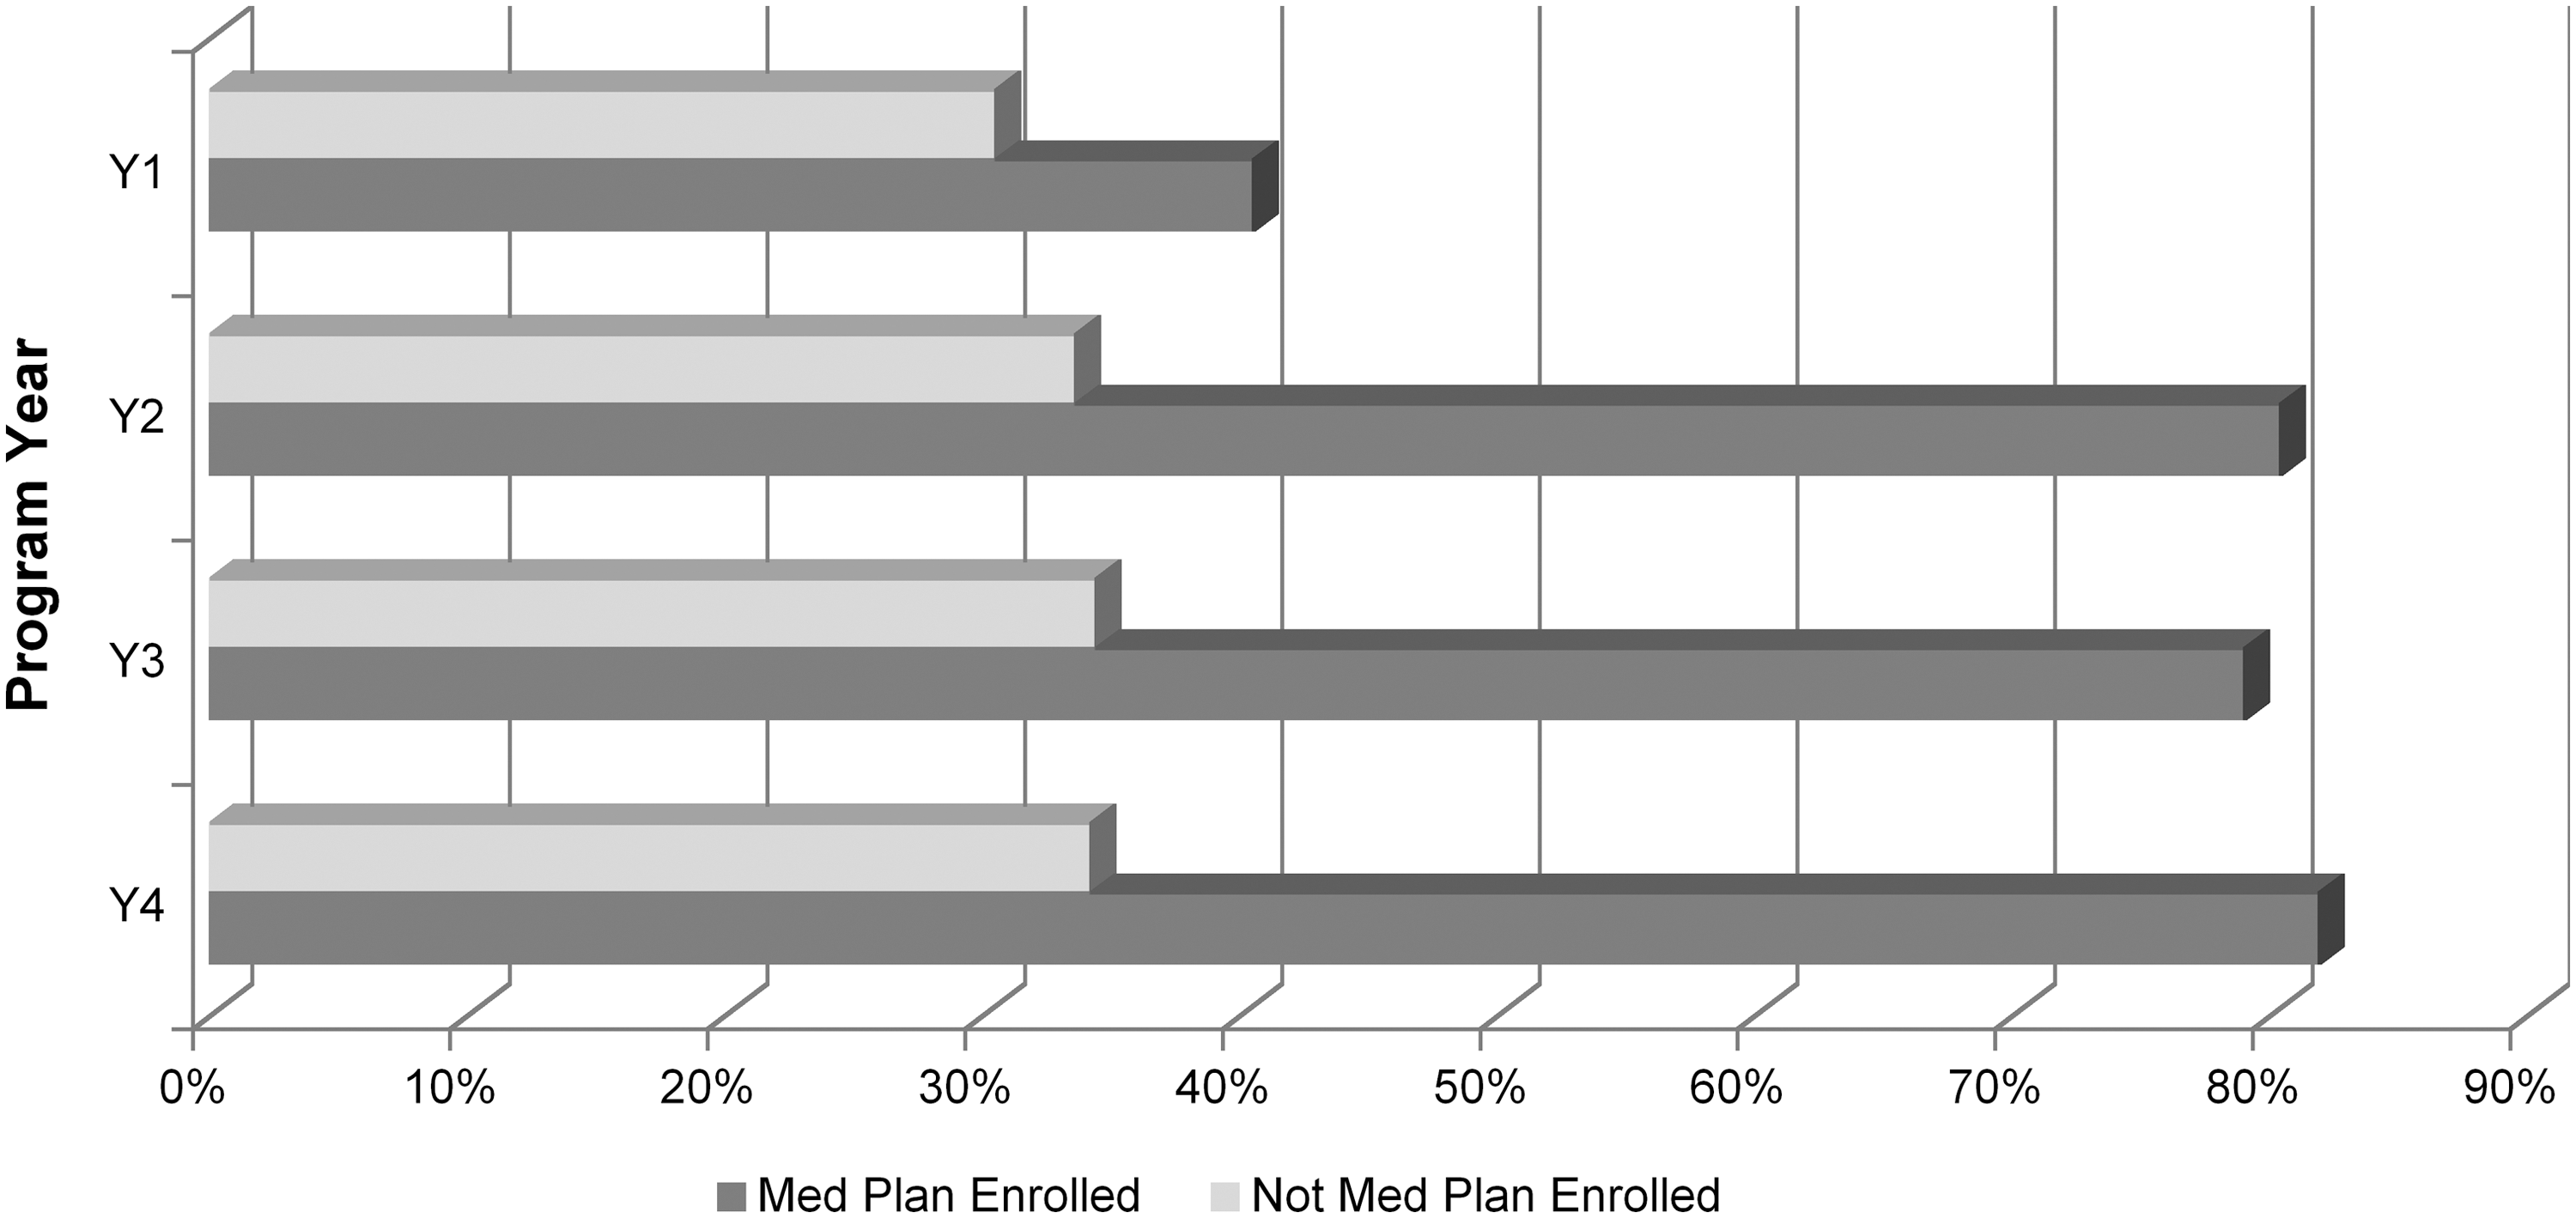
Health risk assessment participation rates among eligible employees enrolled and not enrolled in the company medical plan by program year.
Health coaching
Only those who took the HRA and stratified for 1 or more lifestyle programs were eligible for educational and motivational health coaching. Coaching qualification/stratification rates averaged 83% but decreased year-over-year (Y1 = 88.4%; Y2 = 85.7%; Y3 = 82.1%; Y4 = 79.2%). Coaching enrollment rates among those qualified also varied with incentives albeit not as much as that noted with HRA rates. For example, employees (offered incentives) and spouses (not offered incentives) differed by as much as 70 points (eg, 80% vs. 10%) in HRA completion rates, but differed less in coaching enrollment rates (see Figure 3). Of the 3069 members who enrolled in health coaching during this 4-year period, 248 participated all 4 years, 737 participated 3 of 4 years, 758 participated 2 of 4 years, and 1326 participated just 1 year. Over 89% of coaching enrollees who remained eligible for the wellness benefit stayed engaged throughout their respective program year.
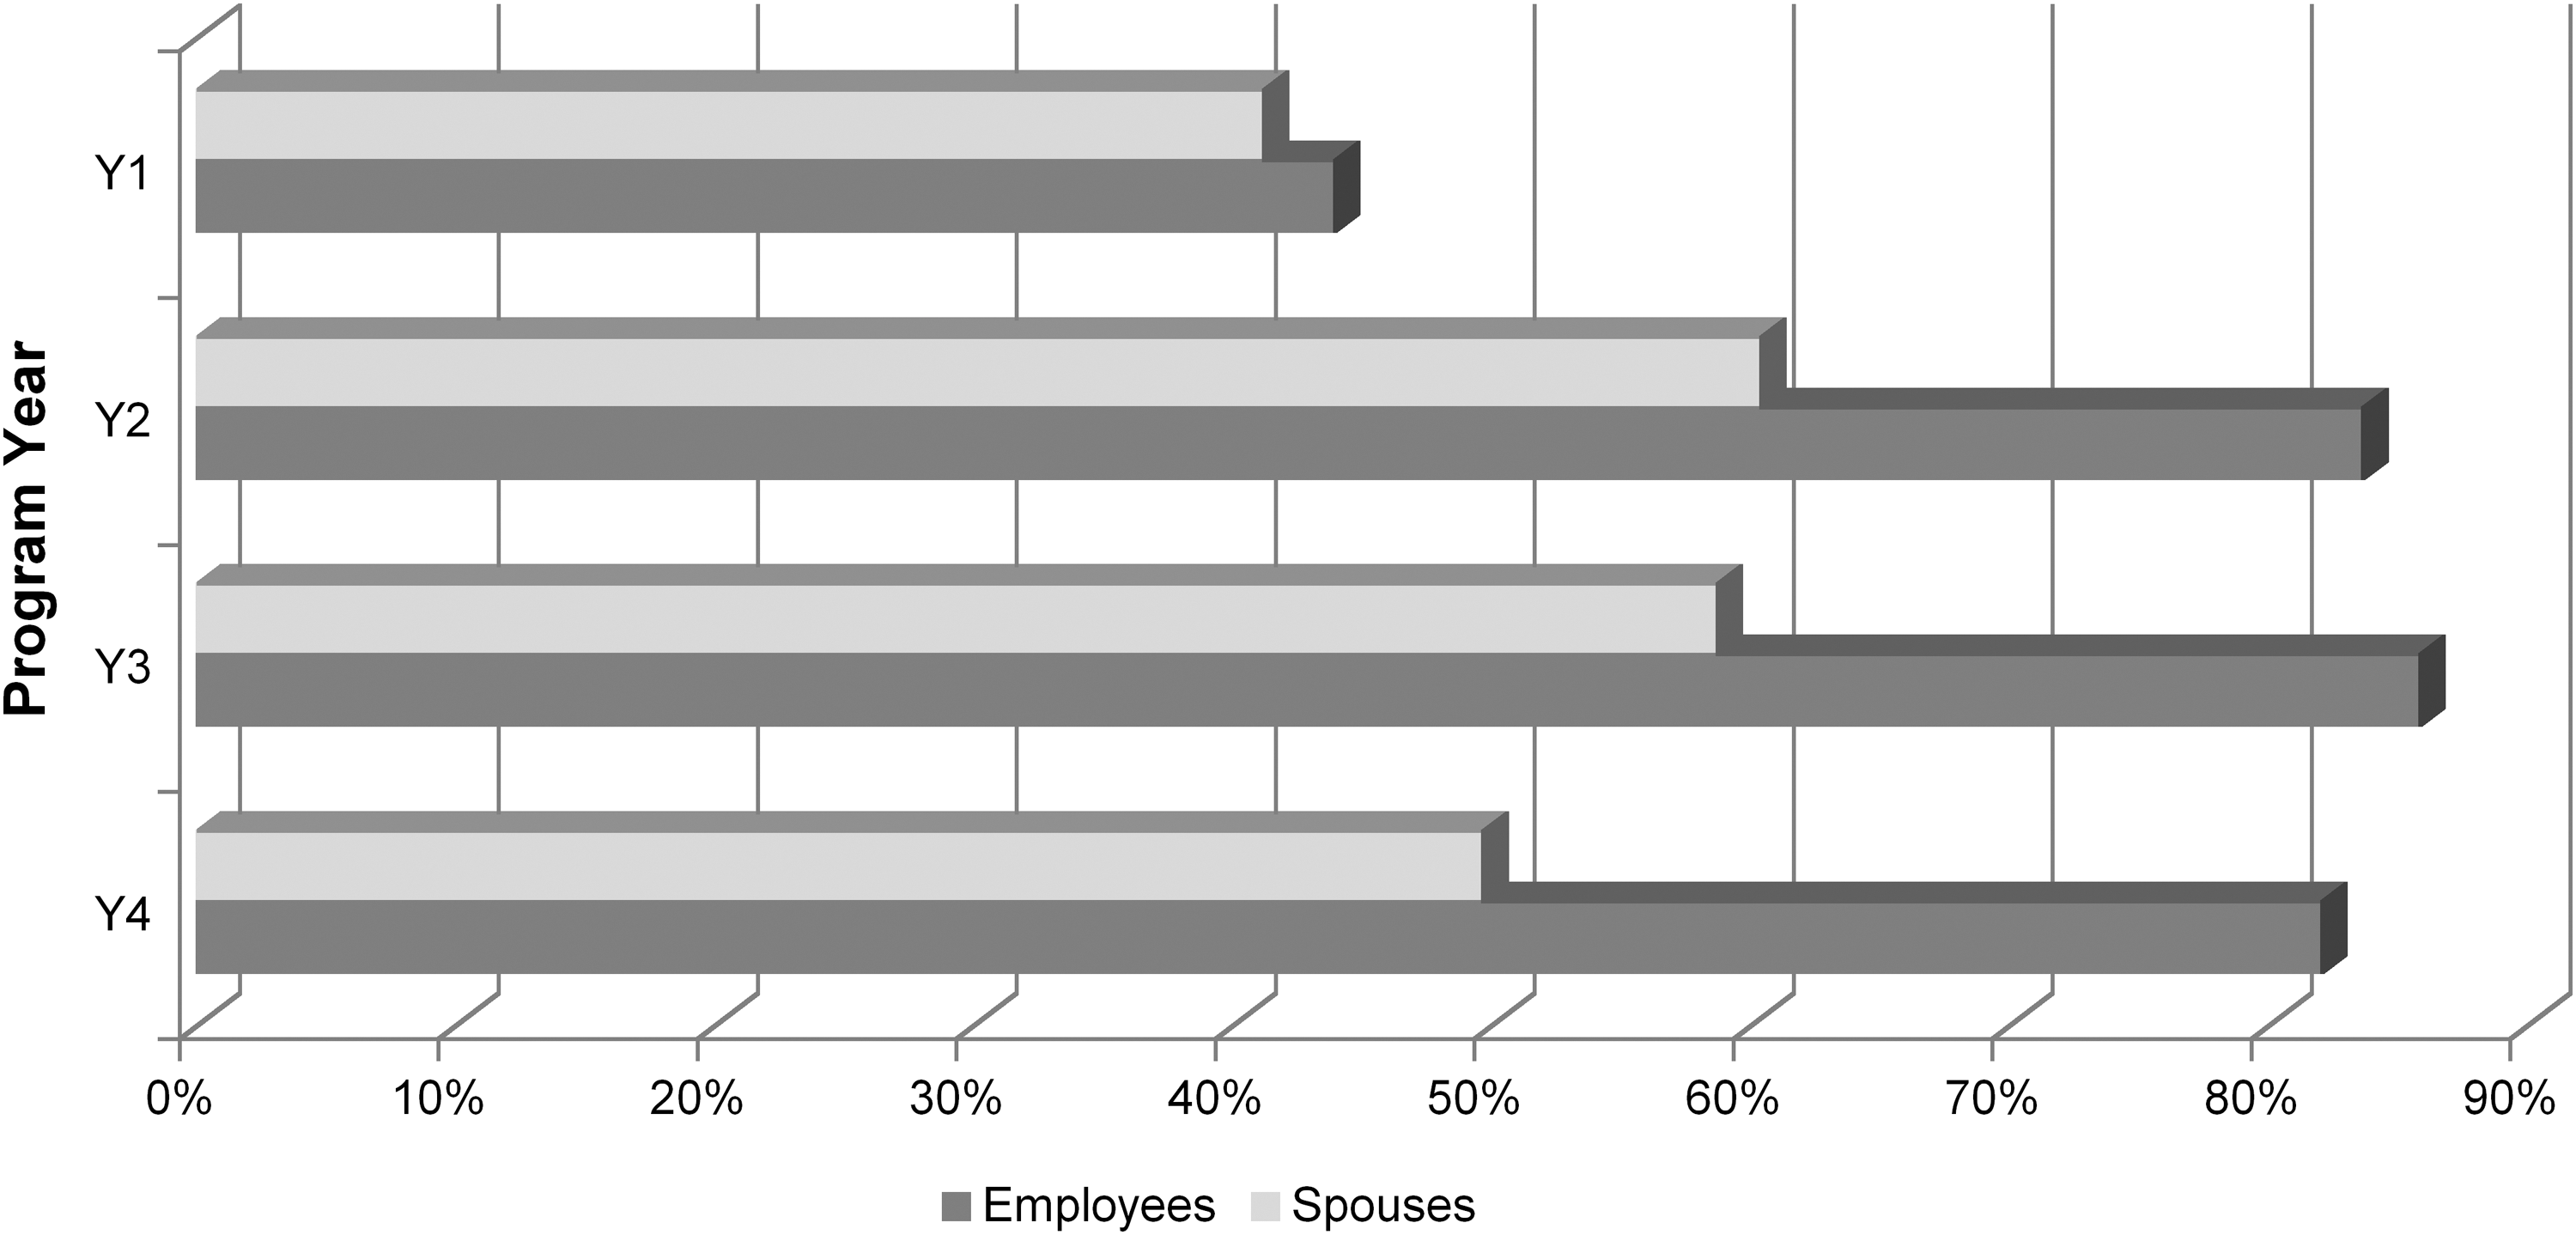
Health coaching participation rates among those stratified/qualified from health risk assessment by relationship status and program year.
Participant satisfaction
A new methodology for gauging participant satisfaction was initiated in April 2007. A survey vendor (independent of Onlife) randomly telephoned coaching participants until a statistically valid random sample was achieved. The vendor computed the number of completed surveys needed to achieve 90% + 5% confidence that results were representative of participants who were eligible for the survey, then made outbound calls until reaching this level of confidence or until exhausting the maximum number of call attempts (8). Survey data collected since inception of this method (14 months) showed that 95.9% of respondents agreed with the statement, “Overall, I am satisfied with the Health Coaching Program.”
Goal progress and achievement
Because of the highly personalized nature of goal-setting and progress tracking in this coaching program, generalized assessments of progress made or goals achieved were conducted by coaches during follow-up calls with participants. Figure 4 demonstrates that coaching participants made progress toward or achieved their lifestyle health change goals 89% of the time. Note, however, that these results were generated 3 months before the end of program year 4 for those still engaged in health coaching; hence, we expect to see goal progress and perhaps even goal achievement rates increase further for year 4.
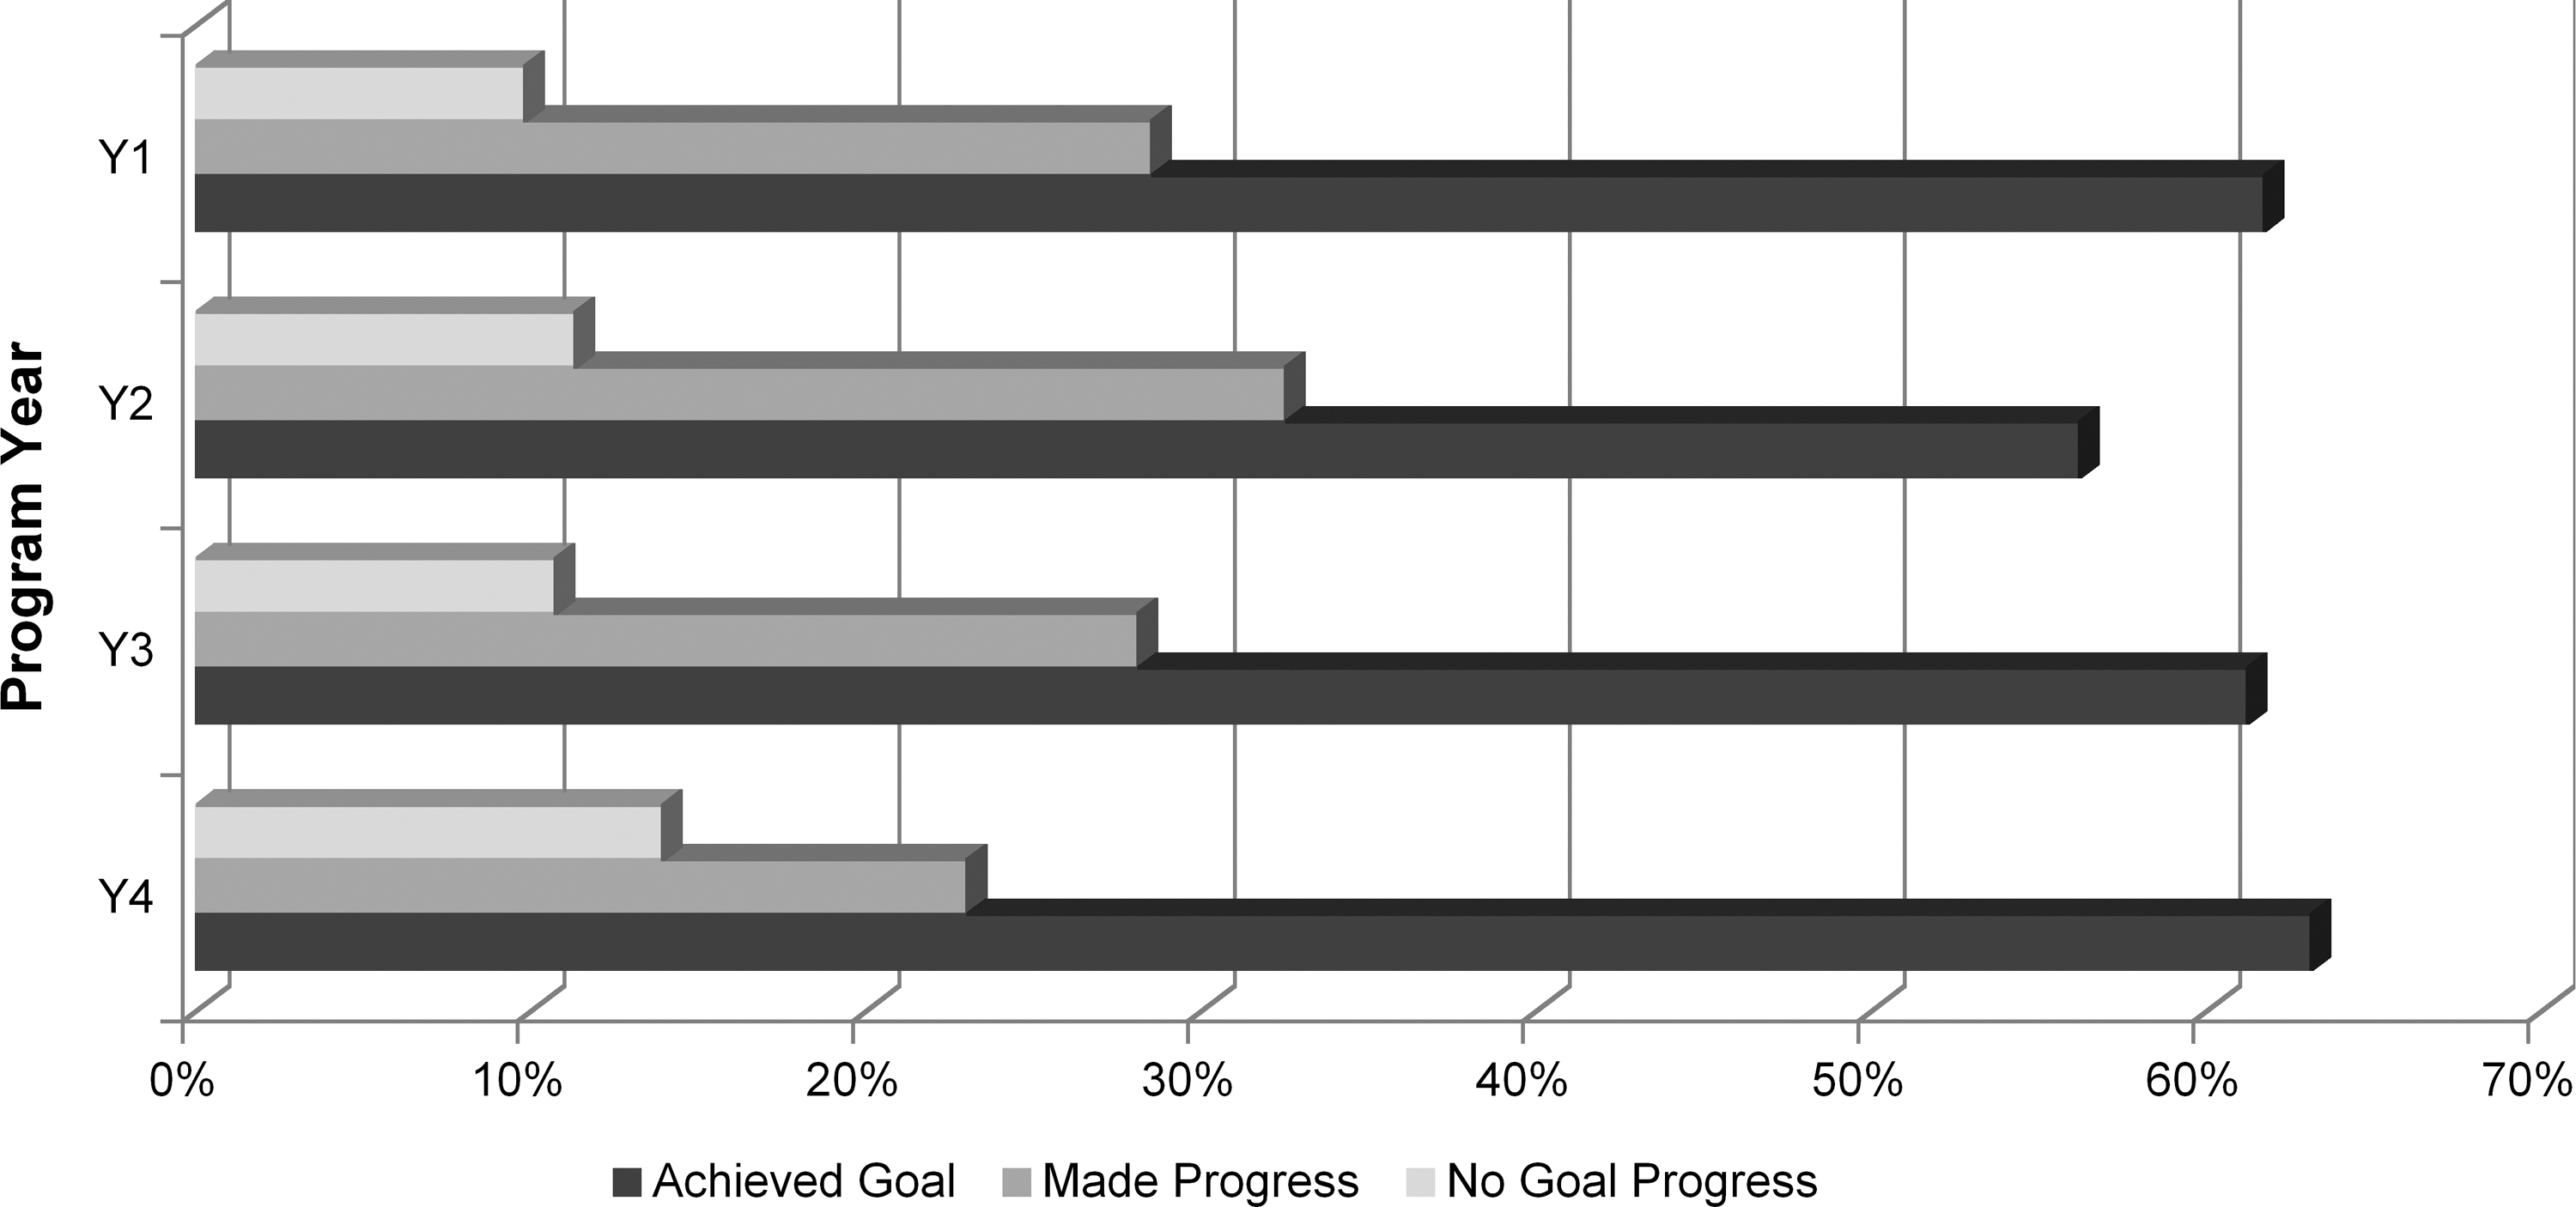
Lifestyle health change goal progress among health coaching participants who responded to goal progress survey (as of 3 months shy of Y4 coaching program end date).
Health status and behavior change
The hospital employer did not offer biometric screenings as part of their population health improvement initiative through Onlife Health. They did, however, offer screenings internally, assessing total cholesterol, low- and high-density lipoproteins (LDL, HDL), triglycerides, blood glucose, blood pressure, resting heart rate, and body weight. Screenings were voluntary and not linked to incentives. Employees were encouraged to attend the screenings if they had not completed an annual physical or did not have recent blood work. An average of 25% of eligible employees participated in the annual biometric screenings each of the 4 years of this evaluation.
For the intervention and this evaluation, the HRA thus served as both a coaching stratification tool and a health change tracking tool. Although HRA data were self-reported, employees were encouraged to have their screening results accessible when completing their assessment. In circumstances such as these with high participation rates, HRAs can demonstrate population trends that are meaningful and suggest improving or declining trends in health status and behavior.
Table 1 displays 1-way analysis of variance (ANOVA) statistical results for all available HRA data for all 4 years of survey administration. Because of employee turnover and, therefore, significant changes to the survey pool year over year, these analyses capture genuine population trends. Hence, instead of parsing HRA changes by coaching participant groups, for example, these analyses capture changes to the total population (of HRA takers), which has greater relevance to the overall (actuarial) risk of the population.
Notes: All means changes were improvements, even the non-significant ones. Displayed are within-group degrees of freedom; between-group degrees of freedom for all analyses was 3 given that each analysis compared 4 (annual) data points. Self-reported lifestyle risks counted: smoking, lack of exercise, stress, prediabetes, osteopenia, overweight, blood pressure risk, cholesterol risk. Self-reported chronic conditions counted: gastroesphageal reflux disease, asthma, heart disease, diabetes, obesity, hypertension, hyperlipidemia.
ANOVA, analysis of variance; df, degree of freedom; RTC, readiness to change; HRA, health risk assessment.
Table 1 displays the results of both single-item measures and computed indexes. a All the essentials of lifestyle health behaviors are represented: smoking, diet, exercise, mental health, body weight, readiness to change, sum of risks and conditions, and a composite metric capturing healthy habits controlling for age and sex (Good Habits Index). Every statistically significant metric displayed demonstrated highly linear improvements from year 1 to year 4 (eg, reductions in dietary fat intake and sum of lifestyle risks and chronic conditions; increases in activity level, perceptions of life satisfaction and overall health). The 2 statistically non-significant measures (body mass index [BMI] and sum of chronic conditions) were curvilinear. Figure 5 displays this trend for BMI. Although the improving BMI trend from years 2 to 4 are encouraging, these are nonetheless statistically nonsignificant.
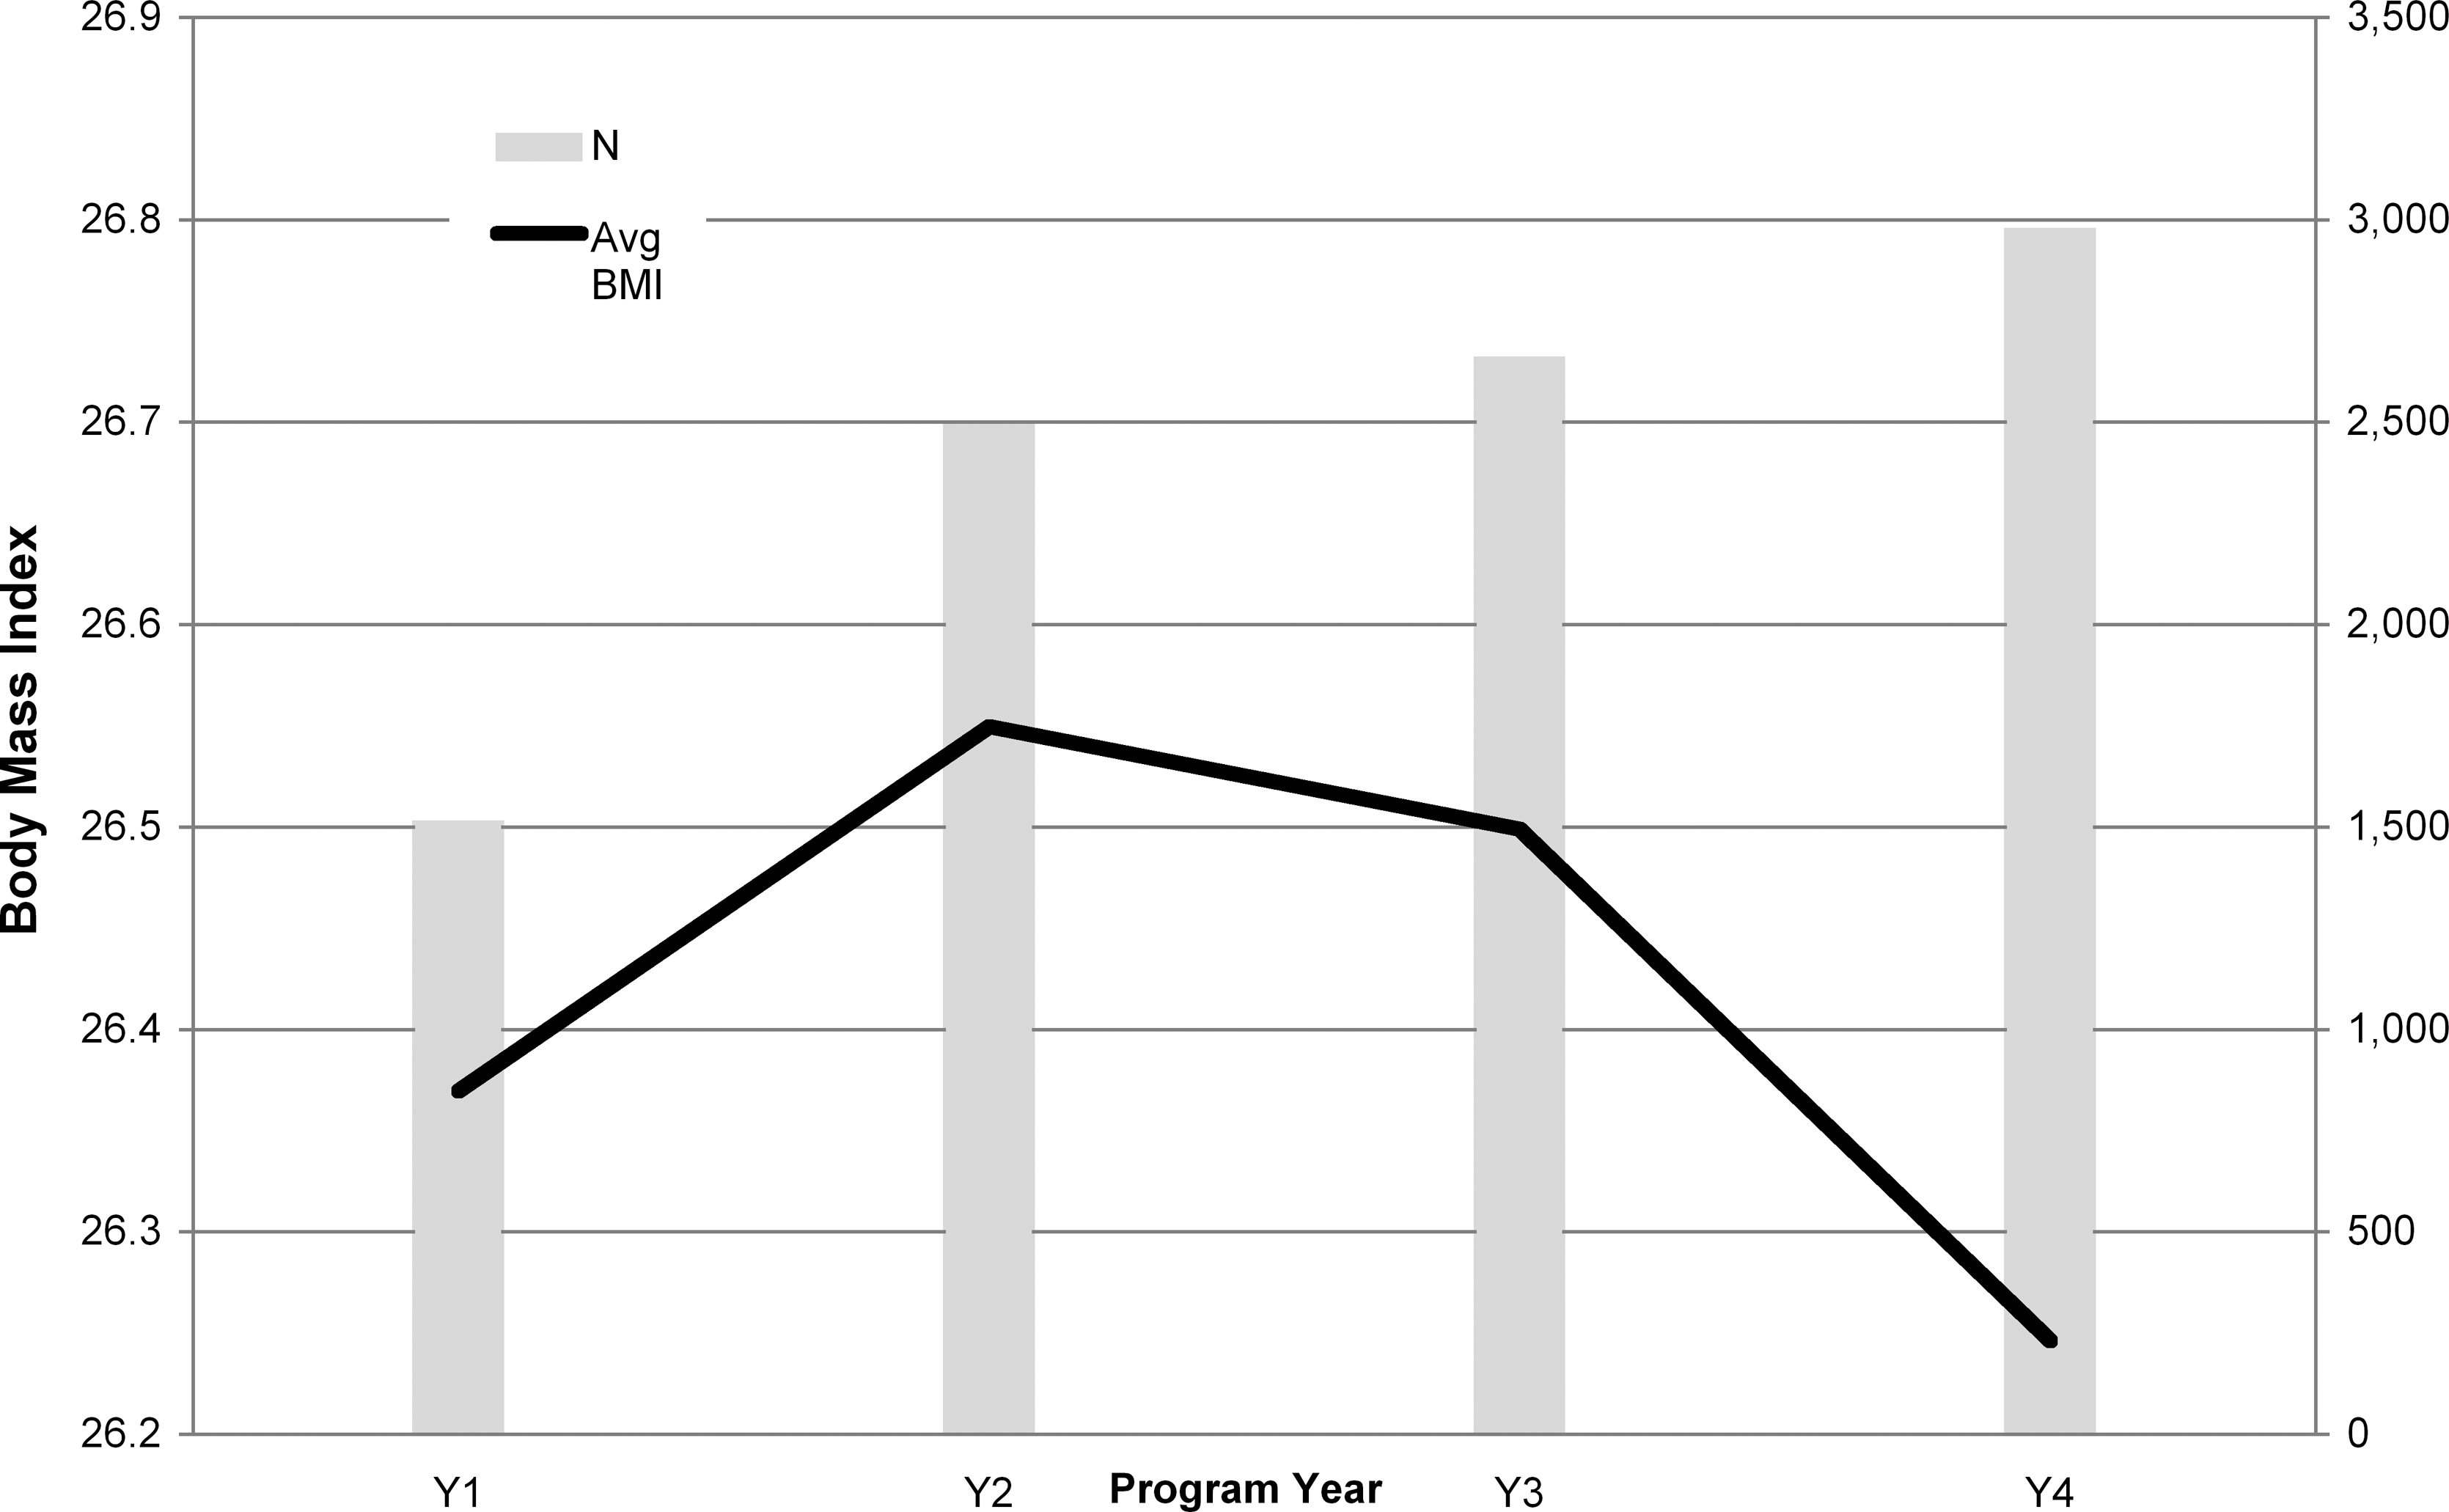
Average body mass index for the population of HRA takers each of four years.
Productivity change
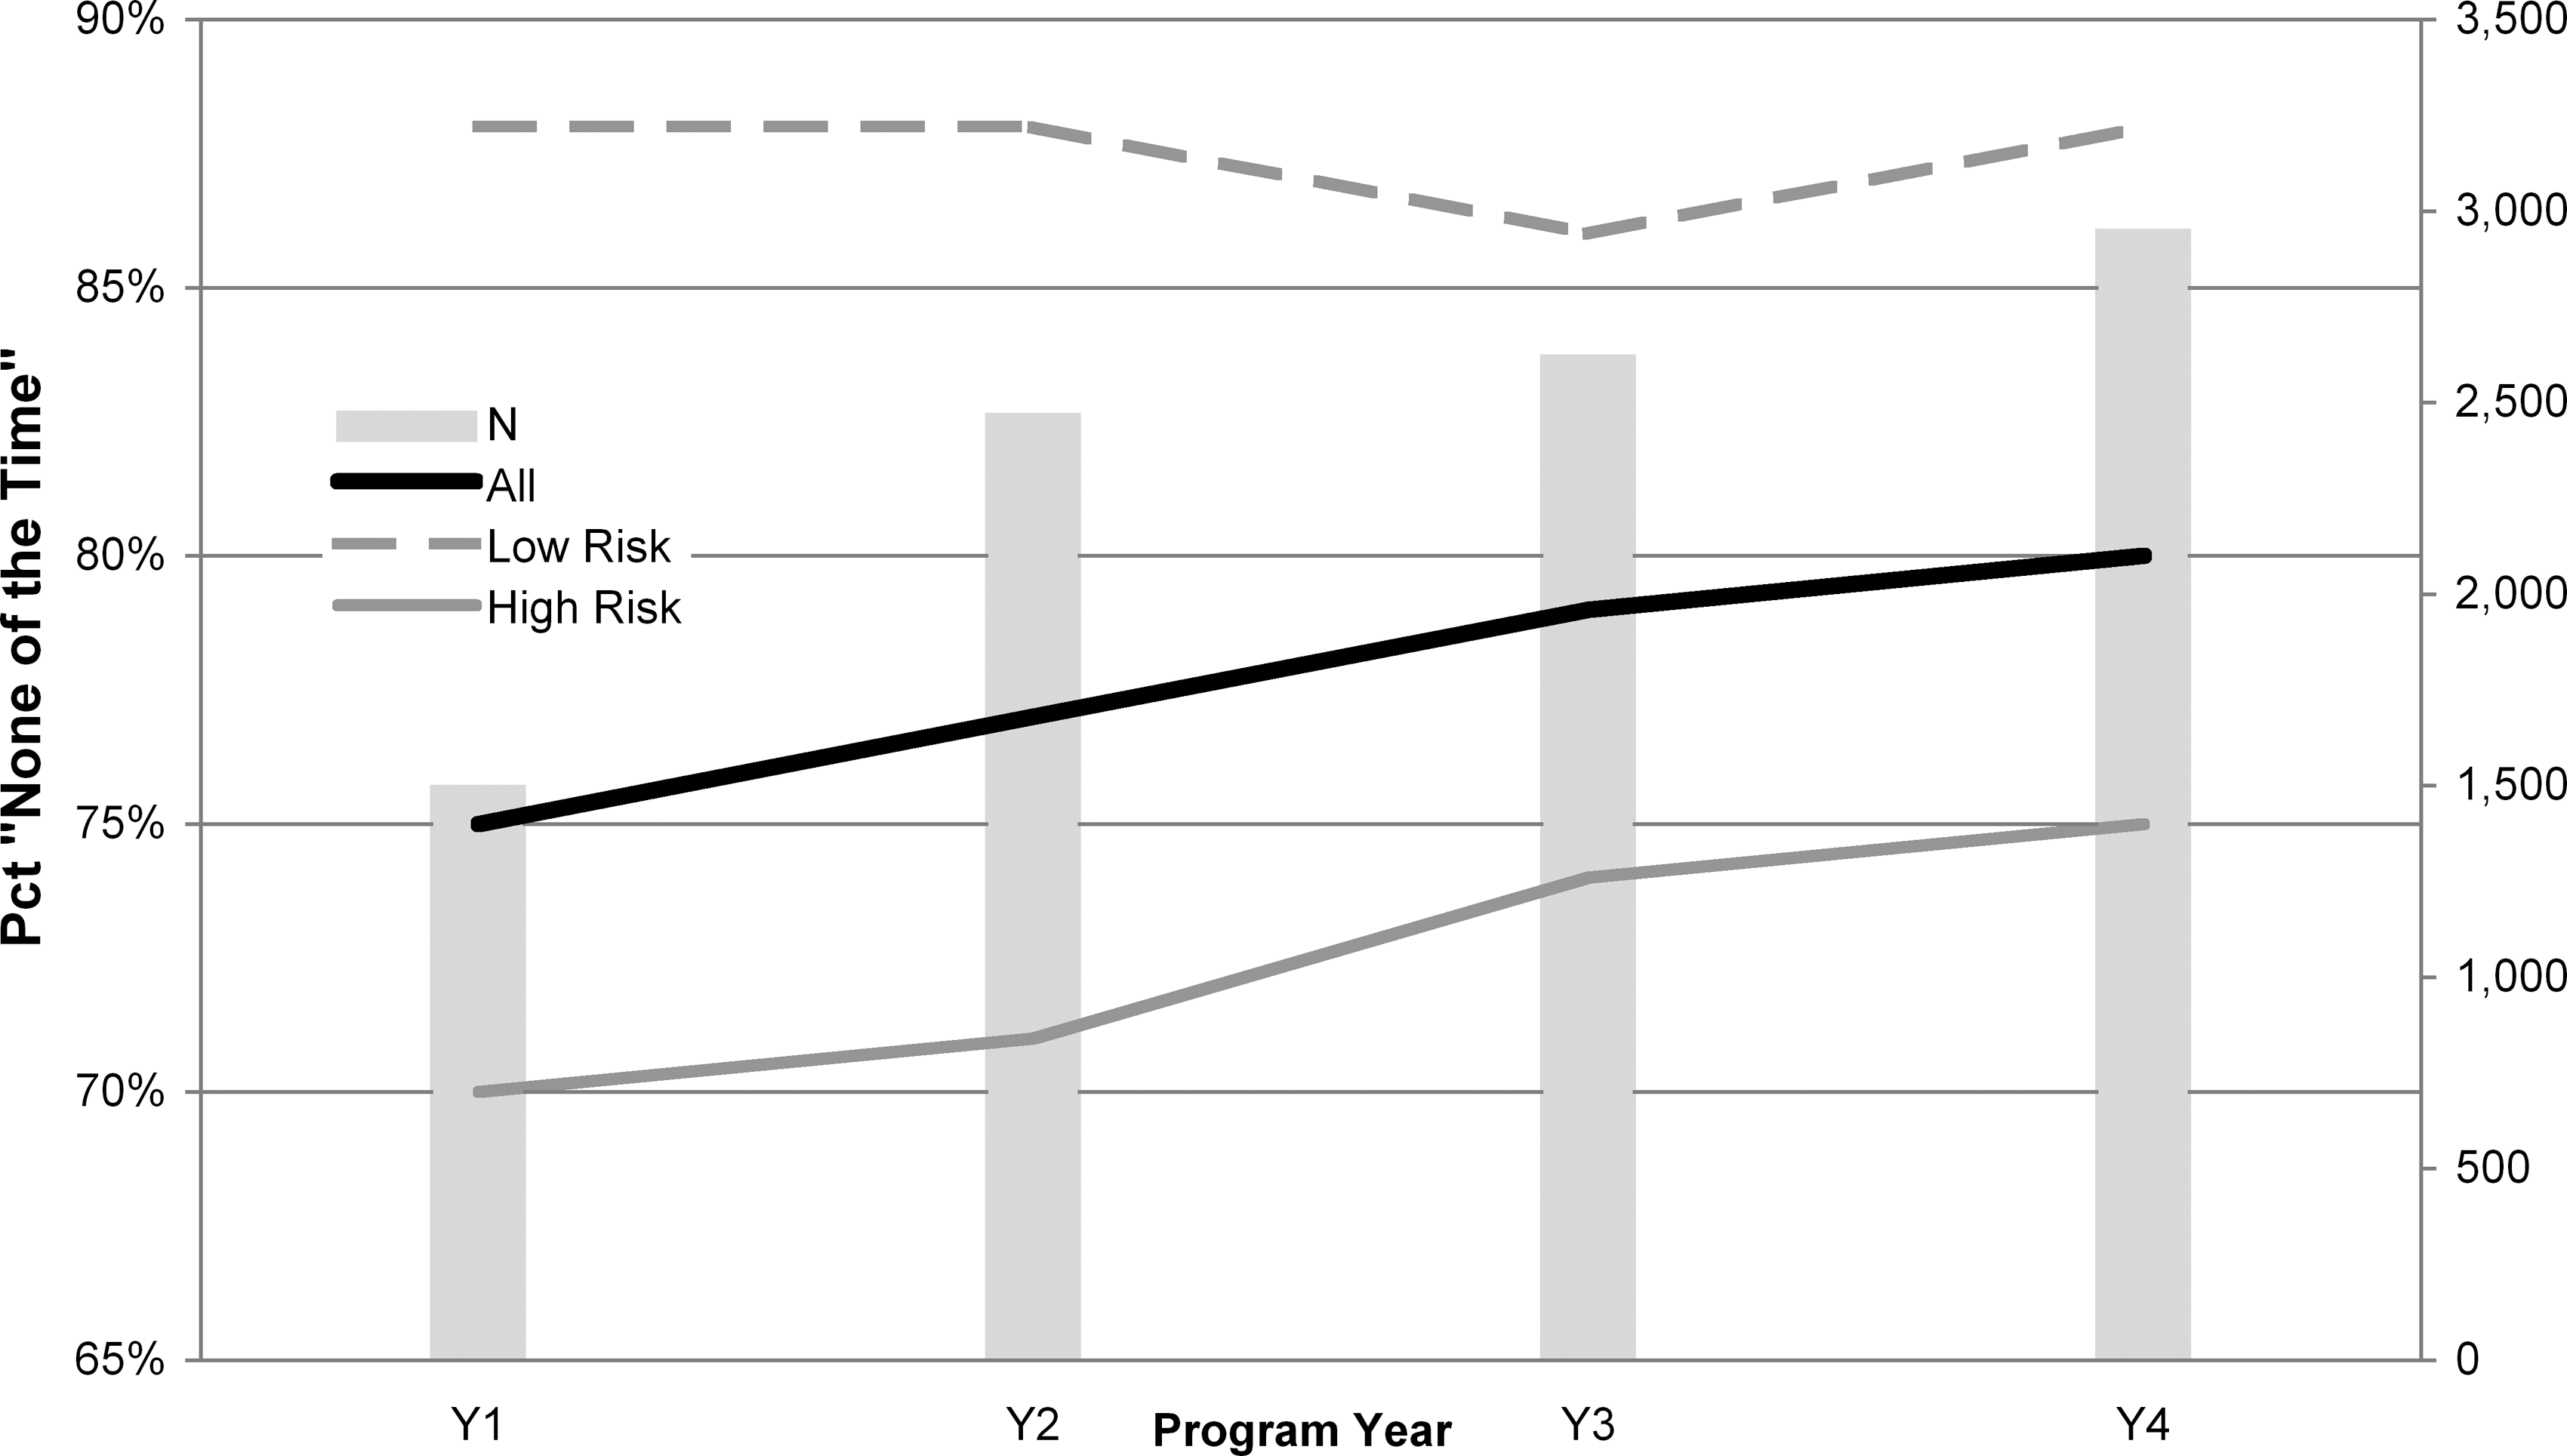
A few custom questions were added to the hospital employer's HRA in an attempt to assess indicators of worker productivity. Because these items are not standardized or validated elsewhere, it is not possible to convert outcomes to reliable estimates of dollar savings for productivity improvement. Nonetheless, as Figures 6 to 9 demonstrate, there is a clear indication of productivity improvement among the population who took the HRA (ie, these results summarize all responses to these questions, not just the responses of those who answered the question on all 4 HRA administrations). General patterns noted among these results are that those at low 10-year mortality risk self-report better productivity than those at high risk, but also that the population that took the HRA is improving year over year in indicators of productivity (comparing low- and high-risk members, Chi-square statistics [df = 3] for all 4 productivity effects [Figs. 6 –9] ranged from 93.40 to 96.94, P < .001).
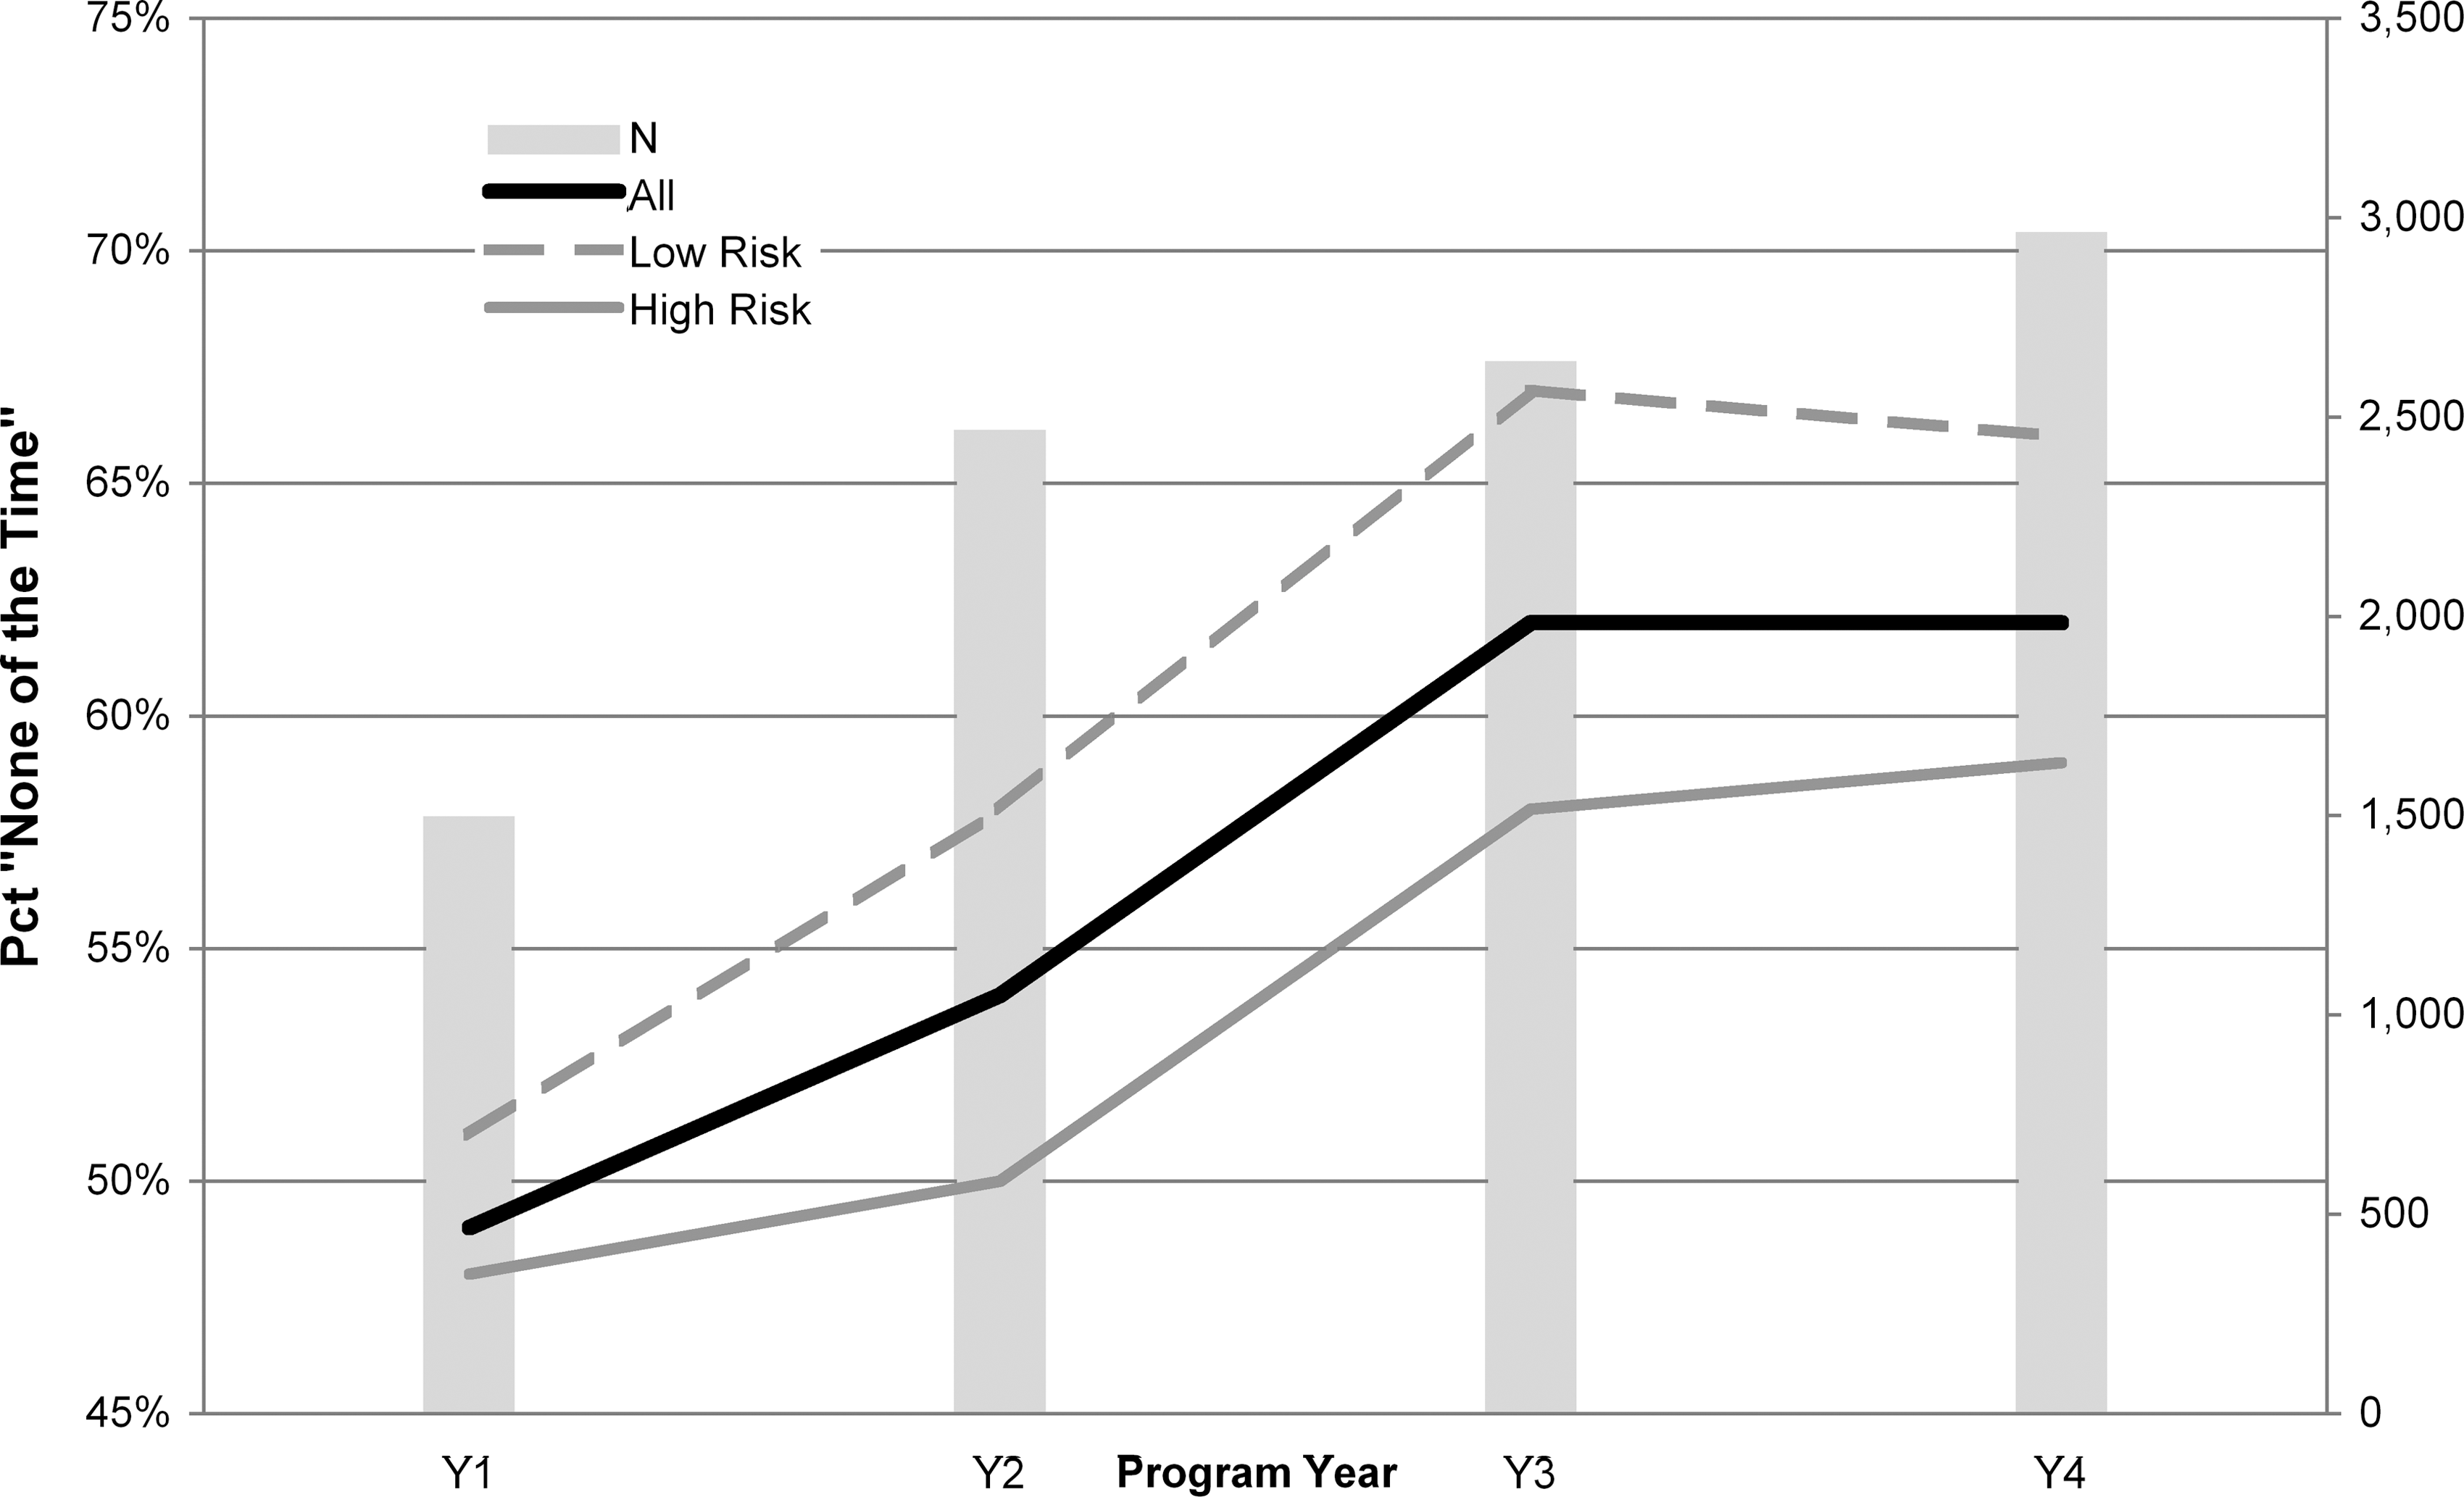
Percent of total survey takers (N) who responded “None of the Time” to the question, “How often did you find yourself not working as carefully as you should?” (All = all survey respondents; Low Risk = subgroup of those with low 10-year mortality risk; High Risk = subgroup of those with high 10-year mortality risk).
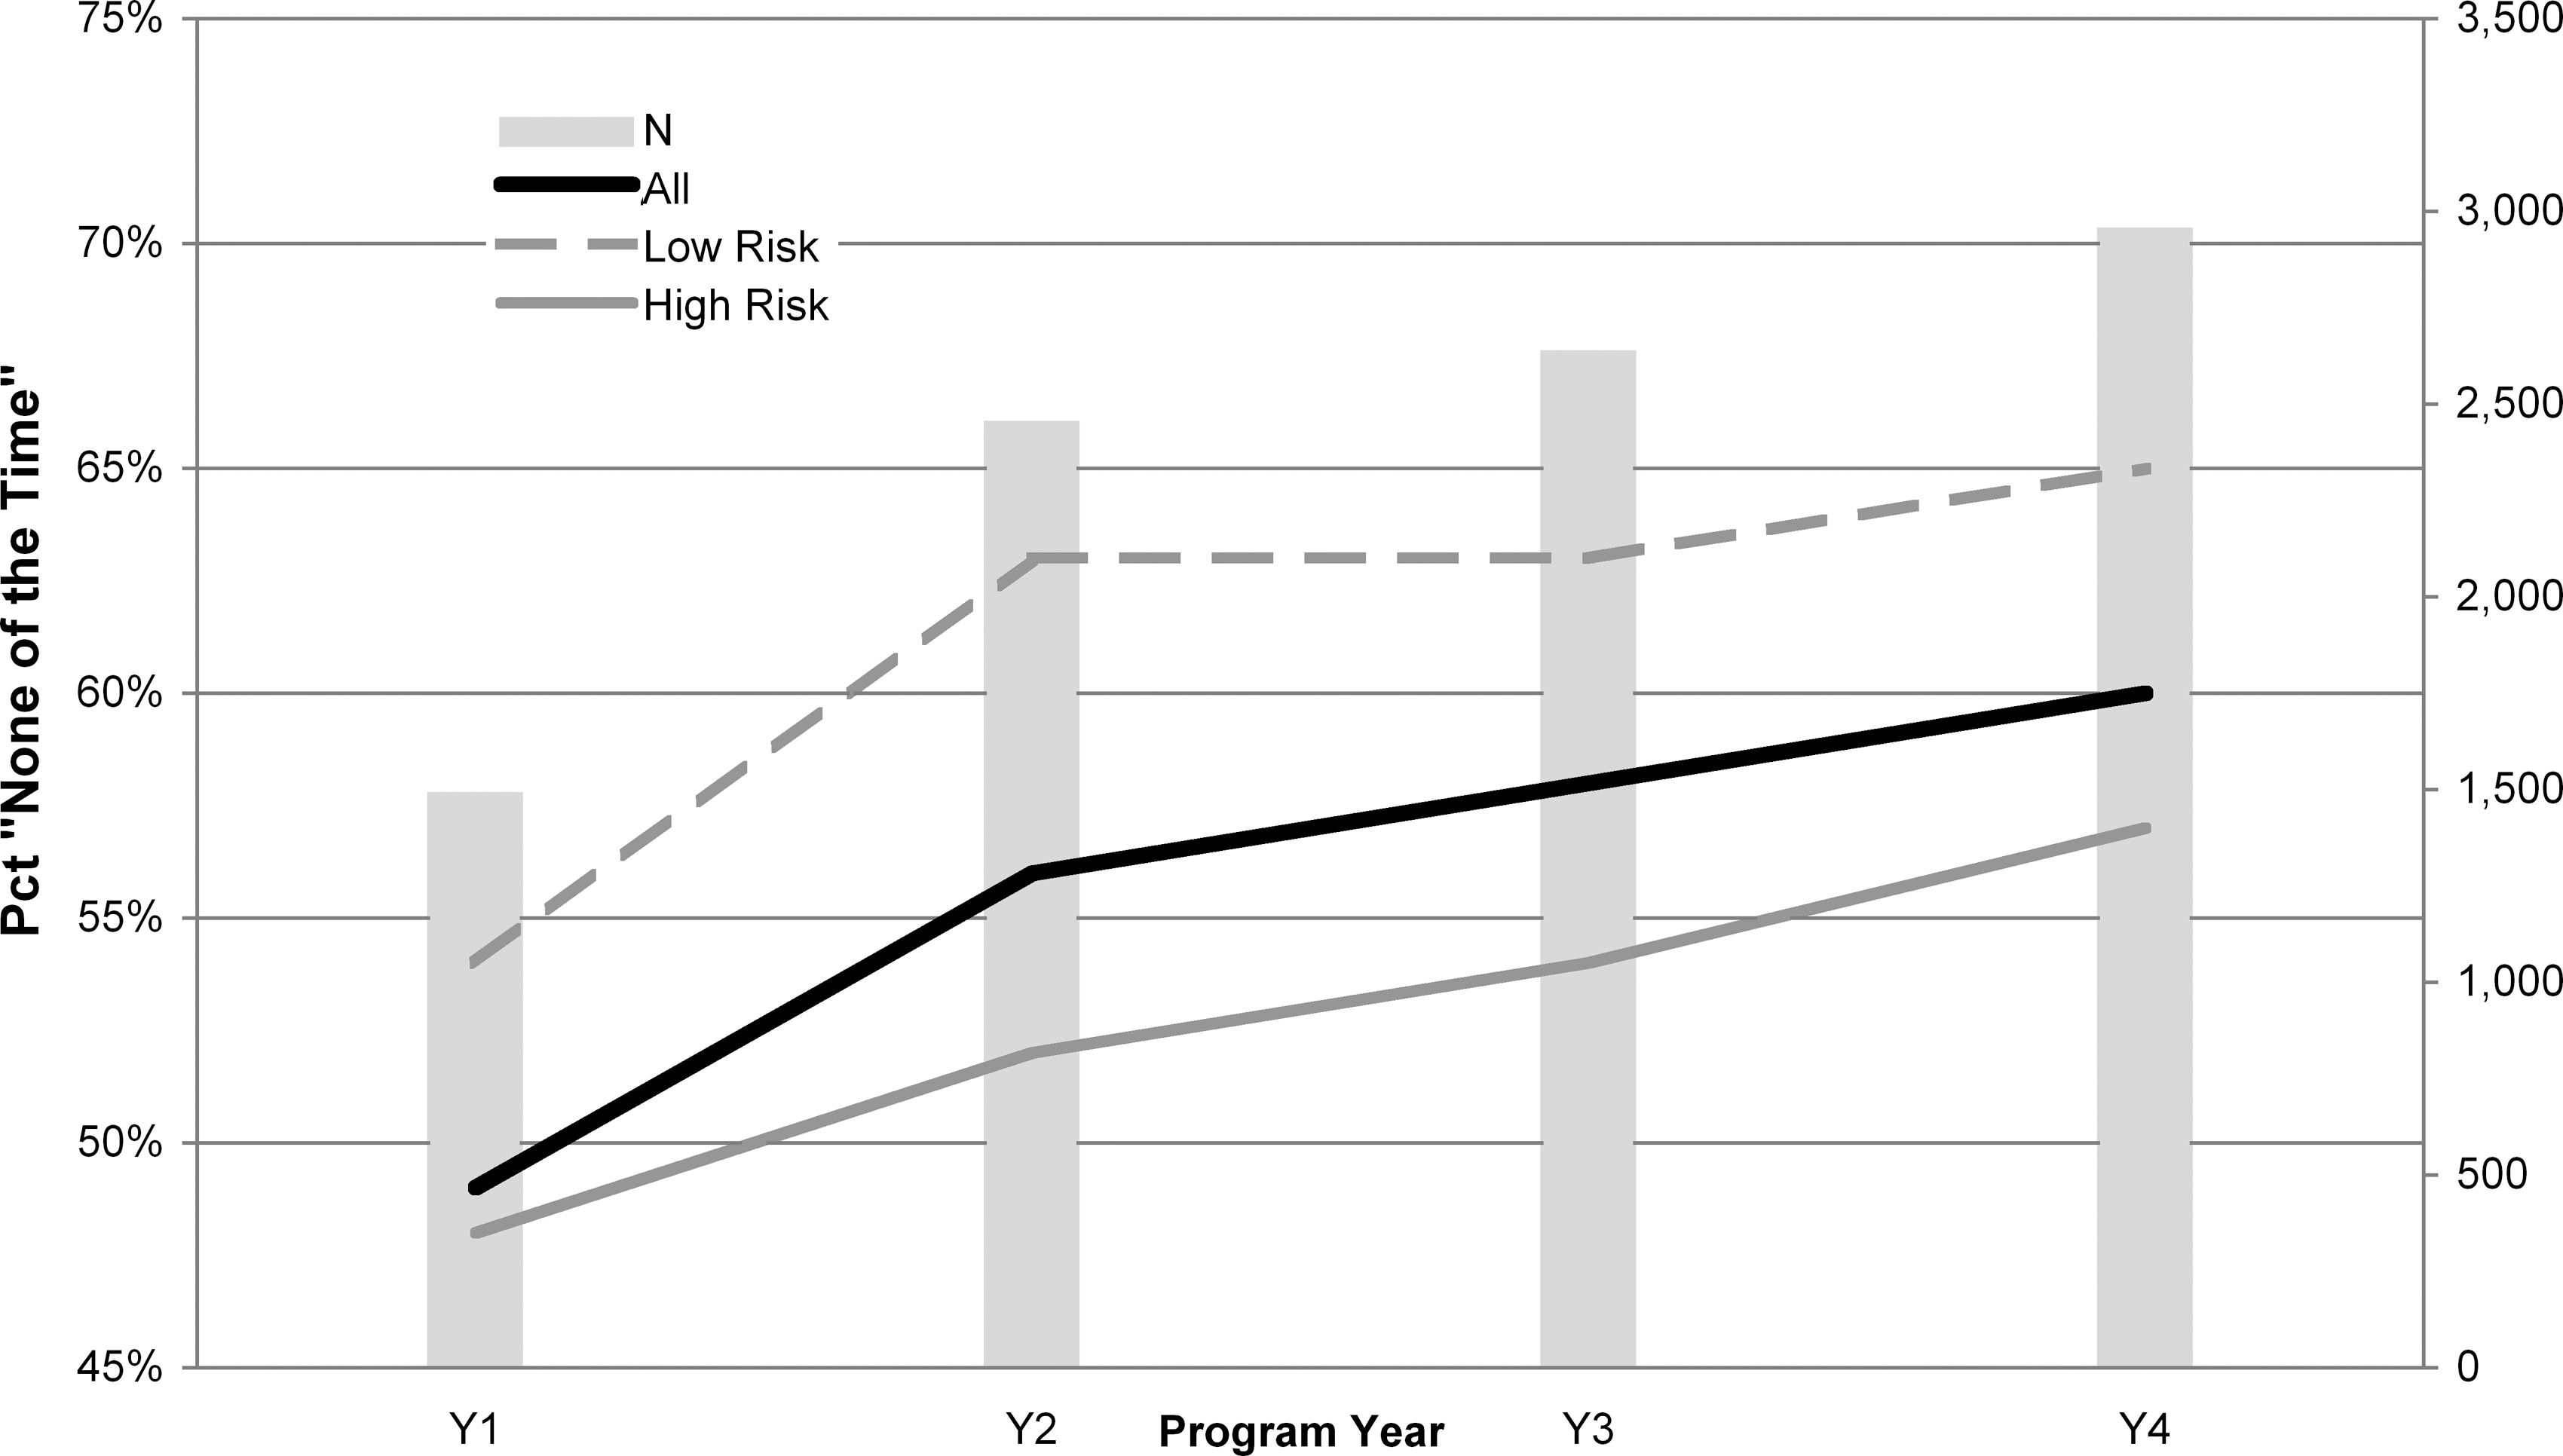
Percent of total survey takers (N) who responded “None of the Time” to the question, “How often was the quality of your work lower than it could have been?” (All = all survey respondents; Low Risk = subgroup of those with low 10-year mortality risk; High Risk = subgroup of those with high 10-year mortality risk).
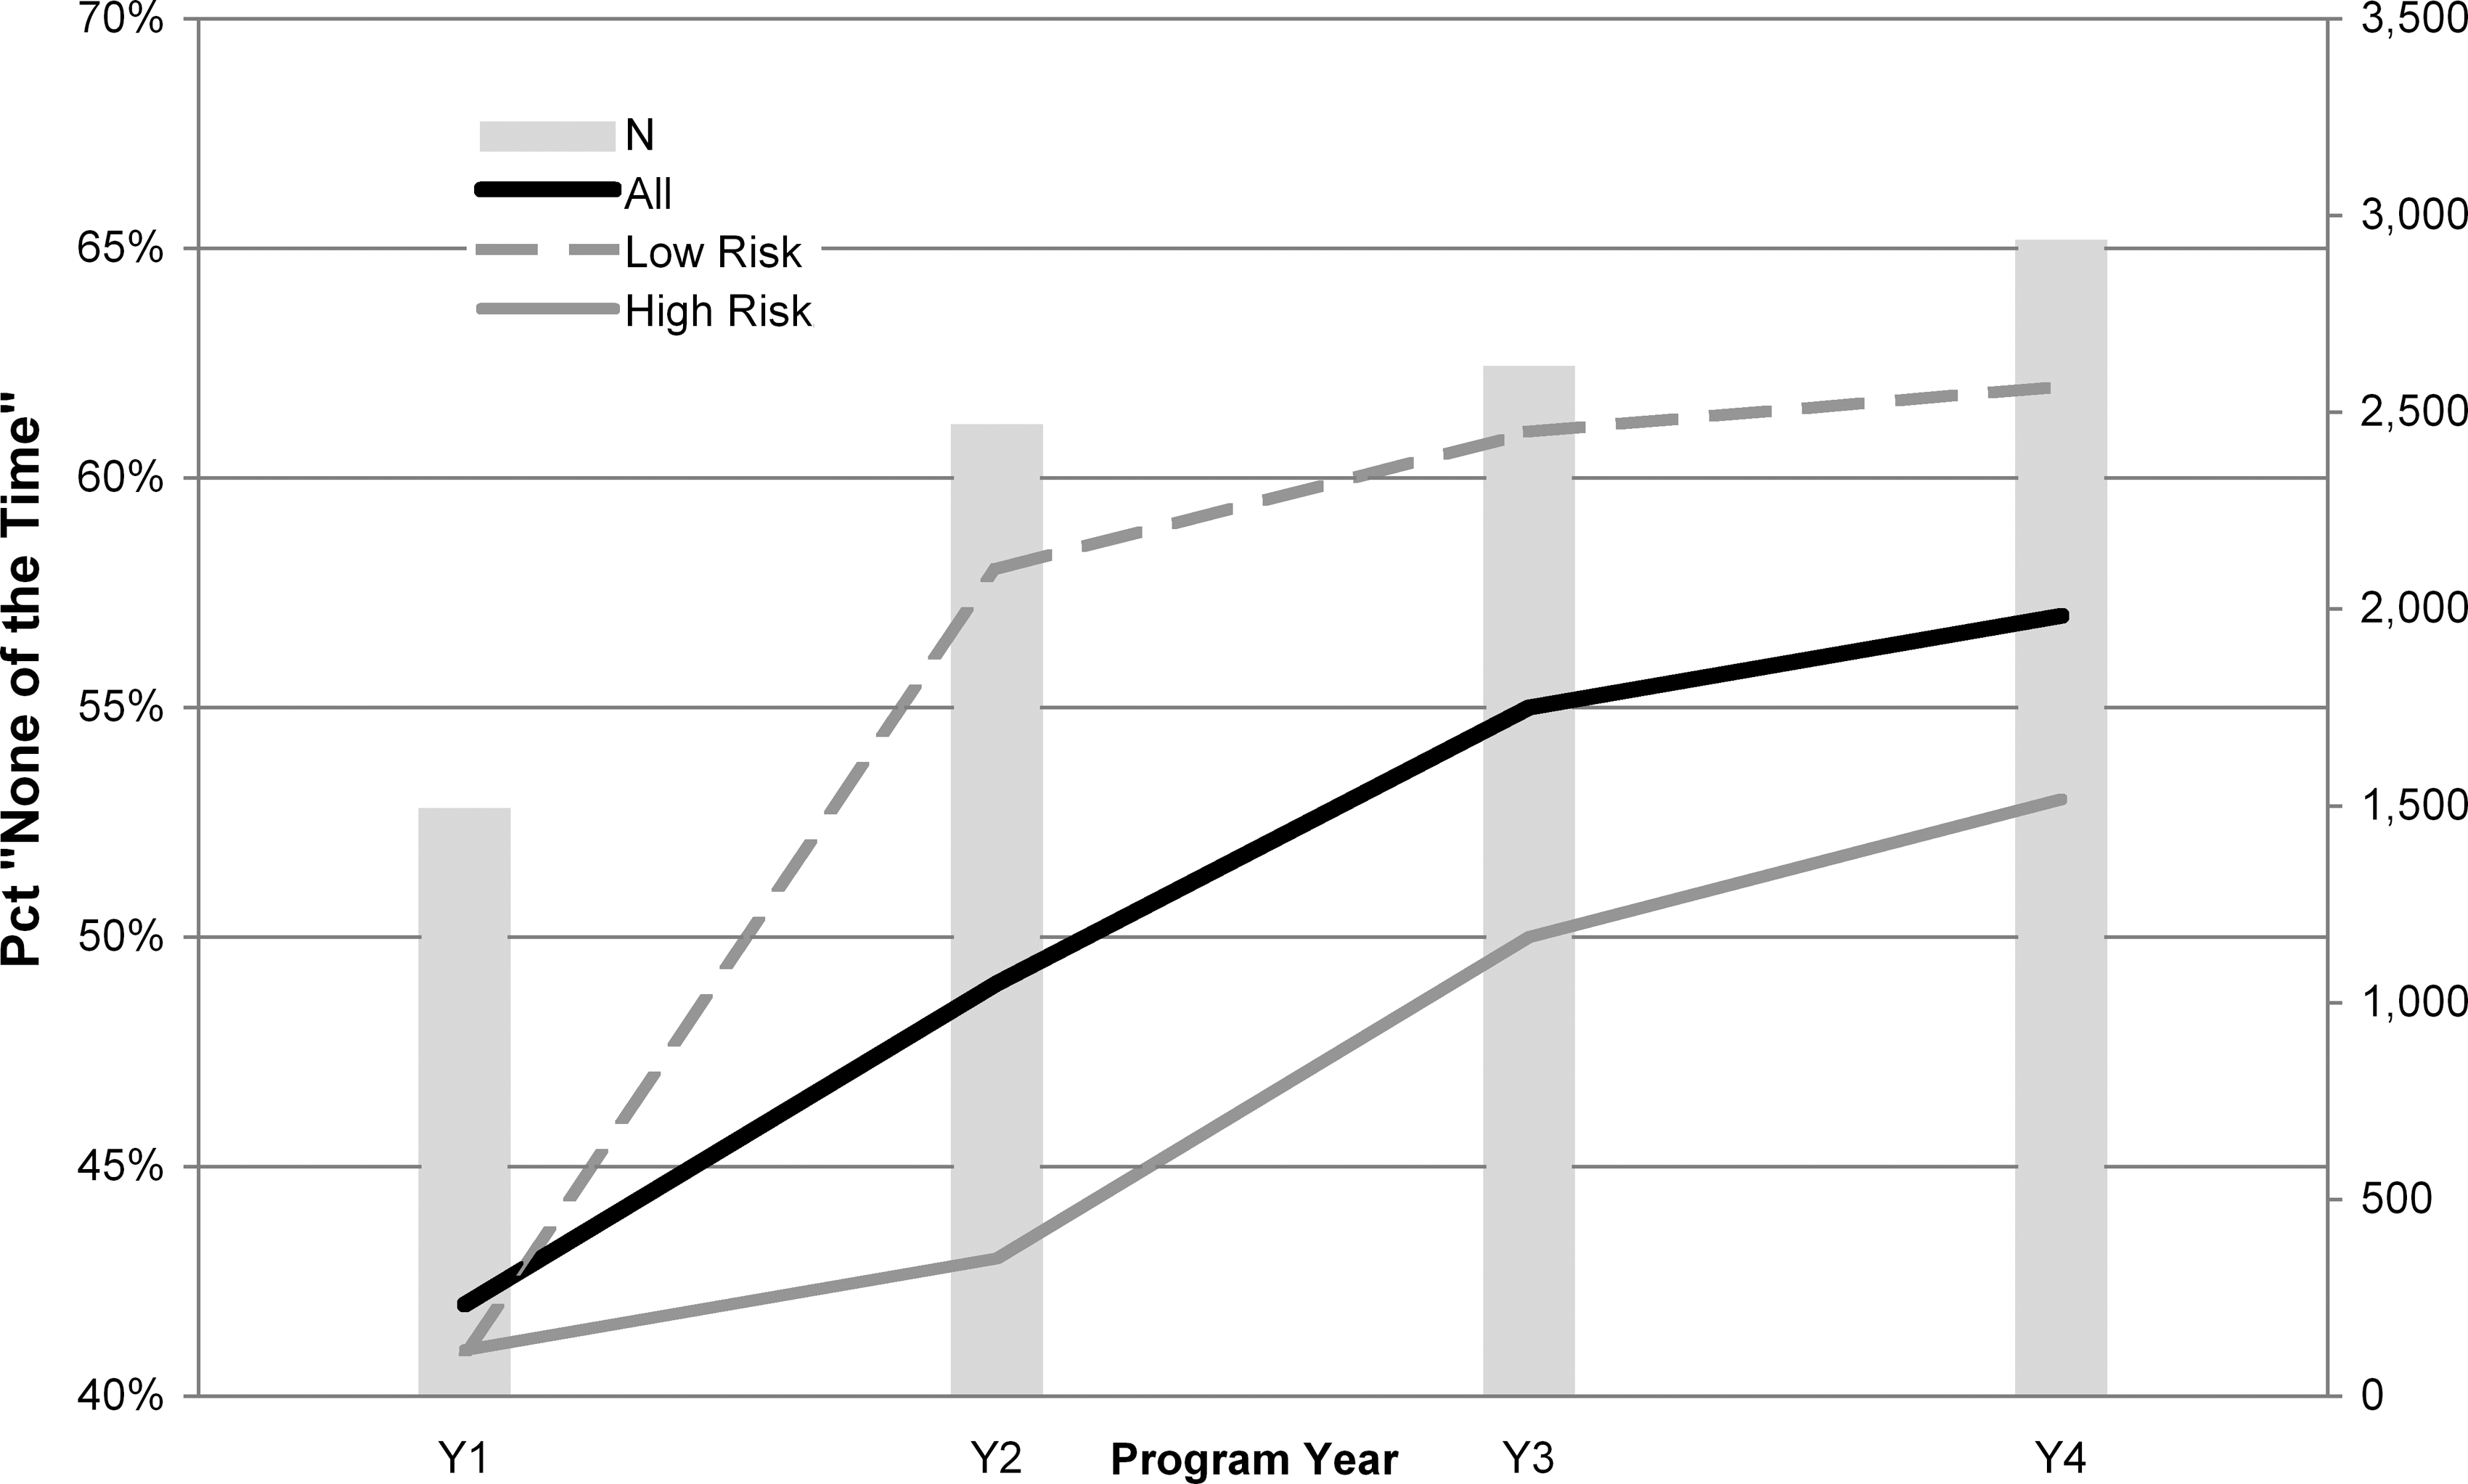
Percent of total survey takers (N) who responded “None of the Time” to the question, “How often did you not concentrate enough on your work?” (All = all survey respondents; Low Risk = subgroup of those with low 10-year mortality risk; High Risk = subgroup of those with high 10-year mortality risk).
Percent of total survey takers (N) who responded “None of the Time” to the question, “How often did health problems limit the kind or amount of work you could do?” (All = all survey respondents; Low Risk = subgroup of those with low 10-year mortality risk; High Risk = subgroup of those with high 10-year mortality risk).
Claims savings and return on investment (ROI)
The hospital employer was fully insured for medical expenses through the end of 2005. Because of an inability to acquire health care claims data in fully-insured circumstances, savings resulting from differences in expected and actual medical and pharmacy claims for program years 1 and 2 could not be evaluated. b However, using 2006 mature claims paid by the hospital employer c as the baseline and 2007 mature claims as the follow-up period, it was possible to evaluate claims savings for program year 3. d Using calendar years for evaluation accommodated the expected lag between program ramp-up (HRA and coaching enrollment happening largely in the October to December 2006 time frame) to anticipated claims impact.
Used for this analysis was the 2-stage multivariate regression method demonstrated by Ozminkowski and colleagues. 2 This is a rigorous quasi-experimental method comparing participants' per member per month (PMPM) health care claims (medical and pharmacy) cost trends to similar nonparticipants' PMPM claims cost trends. e In so doing, the effect of Onlife's intervention was evaluated while controlling for other environmental influences and cohort differences.
In the first stage of this 2-stage design, logistic regressions were used to estimate members' propensity to participate in year 3 of these voluntary programs. Separate regressions were used to predict members' likelihood of participating in each of the 4 mutually exclusive categories for year 3: eligible nonparticipant HRA participant who did not qualify for a coaching program HRA participant who qualified for a coaching program but opted not to enroll HRA participant who qualified for and enrolled in a coaching program
The same predictors were used for each of these logistic regressions: age, sex, relationship (employee/spouse), health plan eligibility for 2007 (yes/no), health plan type for 2007 (eg, dummy variables for PPO Plus, PPO Basic), whether the member took the HRA in year 1 and/or year 2, and numbers of participating months (if any) in year 1 and/or year 2. f For each member eligible for year 3 programs, 4 predicted probabilities of participating were computed. However, each member's propensity score was the predicted probability of their actual year 3 participatory status (eg, the predicted probability that a year 3 nonparticipant would indeed be a nonparticipant). Propensity scores (after transformation as demonstrated by Ozminkowski et al 2 ) were then used to weight the stage 2 regressions for estimating savings.
The purpose of using propensity score weighting is to control, as best we can, for selection bias. All employees and most spouses had the opportunity to participate, but only some of them did so. Those who did not participate did so passively (ie, did not complete a HRA, which was the program entry point). Observable differences between participants and nonparticipants can be (and are) controlled statistically in the stage 2 analysis. However, unobservable differences—some of which may correlate with decisions to participate or not participate—constitute an unknown that can be controlled for only via randomization to intervention and control groups. This intervention is, of course, nonrandomized, requiring a quasi-experimental evaluation design that controls for selection bias via propensity score weighting, giving us the highest (albeit imperfect) level of confidence that unobservable differences are held in check.
The stage 2 analysis for estimating claims savings for participants over controls was an ordinary least squares (OLS) weighted regression. The outcome was PMPM claims cost trend per member. Predictors of greatest interest were dummy variables for 3 different levels of contact: HRA, No coaching Y3. HRA, Lifestyle coaching Y3. Lifestyle coaching Y1 or Y2, nonparticipant Y3.
The third category served 2 purposes: it assessed the lagged impact of prior year(s) coaching, and avoided contaminating the control population with prior exposure to interventions. In addition to the participatory dummy variables, the OLS regression included covariates that helped balance the intervention and control groups preintervention. Covariates included those used in stage 1 as well as baseline PMPM claims costs and number of baseline diagnosed claims for cancer, diabetes, depression, heart disease, maternity, and respiratory disease. g
This final, stage 2 OLS regression was, in fact, computed 4 different times – once with all available member data, and then 3 more times removing outlier claimants. Outliers were variously defined as members whose pre-post claims cost change exceeded ±$25,000 (N = 46, of whom 31 were participants), ±$35,000 (N = 33, of whom 21 were participants), and ±$50,000 (N = 16, of whom 8 were participants). h Reporting results of models with and without outliers provides a range of estimates and helps us understand the effect of outliers in explaining the outcome.
Table 2 displays statistical results of these four stage 2 weighted regression models as well as PMPM claims cost savings estimates. From these, calculations of program year 3 claims savings across all participant categories are computed, and cost-benefit ratios are estimated with and without incentive costs/cost recovery. All 4 models explained large proportions of variance in the outcome (from 88.5% to 91.1%) and were statistically significant. The model excluding members whose claims cost change pre-post intervention exceeded ±$25,000, however, had the best statistical properties and thus represents our best understanding of the impact of the intervention.
Statistical significance of omnibus model and beta coefficients: †P < .05; *P < .01; **P < .001.
Participant-level OLS regression coefficients reflect PMPM inflation-adjusted trends compared to similar nonparticipants. Hence, the negative coefficient indicates trend is, for example, $38.12 lower than control.
Computed as Vendor fees plus Cash incentive costs Y3.
Computed as Claims Savings Estimate plus Program adherence incentive cost recovery Y3.
PMPM, per member per month; ROI, return on investment; HRA, health risk assesment.
Beta coefficients estimating PMPM savings for participants (on the medical plan) over controls were statistically significant in all models for all participant groups. For our recommended model, weighted average PMPM savings were estimated at $40.65, for gross claims savings of $980,281.
The ratio of claims savings to vendor fees for the recommended model was 3.49:1. The hospital employer's incentive structure was costly for non-health-plan member participants (total year 3 incentive cost = $92,815), but also generated cost recovery from health plan member nonparticipants (total year 3 incentive cost recovery = $93,375), for a net incentive benefit of $560. Vendor fees totaled $280,685. The total program net benefit was $700,156, with a program year 3 benefit to cost ROI ratio of 2.87:1.
Conclusions
This evaluation of a Midwest regional hospital employer's population health improvement initiative may be deemed successful by published recommended standards. 1,3 Using financial, environmental, and cultural means, the hospital employer drove and sustained high participation rates, used flexible communication and coaching methods, documented health improvement and related costs, and rigorously evaluated and reported outcomes.
One premise of primary and secondary prevention programs like this one is that they will prevent or delay the onset of chronic medical conditions. Although the average sum of chronic conditions (per HRA taker) trended downward (years 1 to 4:
Changes in BMI also were statistically nonsignificant, although the trend was curvilinear, with increasing average BMI from year 1 to year 2, then declining average BMI thereafter (years 1 to 4:
All other key lifestyle health status and behavior metrics showed statistically significant, year-over-year linear improvements: smoking status, dietary fat and fiber intake, physical activity, mental health (eg, the effect of stress on life, depressive symptoms in the past year, life satisfaction), readiness to change (diet, exercise, stress, smoking, body weight), perceptions of overall health, an index of good health habits given one's age and sex, sum of lifestyle health risks, and sum of risks and conditions.
Tracking and reporting of health status could, of course, be improved by using widespread biometric screenings in addition to HRAs. Specifically, using the objectively collected screening results rather than relying on accurate employee transfer of those data to the HRA. And, to ensure equivalent amounts of HRA and screening data, screening could also be tied to incentives. Screening data could, of course, alert members to previously unknown health risks or conditions, thereby improving upon the efficacy of secondary prevention efforts. Screenings are costly to conduct, though, often accounting for 40% or more of similar population health improvement efforts, unless the screenings are targeted to members identified as especially risky. Hence, the decision to use population-wide biometric screenings is often a business decision as much as a health promotion one.
Significant linear improvements in years 1 to 4 also were noted for indicators of on-the-job productivity. These improvements were noted for those with high and low 10-year mortality risk, suggesting that interventions are reaching those at all levels of health riskiness and, therefore, health care costliness. A limitation of this study is that indicators of productivity came from nonstandardized measures. As a result, reliable conversion of these productivity improvements into financial terms was not possible. With those, the program return on investment (ROI) picture could have been computed with greater inclusiveness.
The hospital employer plans to move to the Work Limitations Questionnaire i (WLQ), a well-validated survey tool for measuring work loss, for program year 5. The WLQ allows for conversion of survey data into a metric of percent productivity loss over healthy control, which can then be converted – using average total compensation per employee – to reasonable estimates of financial productivity savings.
Although the hospital employer completed 4 years of this population health improvement initiative, only 1 of those program cycles—year 3—could be evaluated for health care claims savings owing to exposure to interventions. This was due to unavailability of claims data prior to 2006. And, with just 24 months of claims data (12 months baseline and 12 months follow-up), trend estimates (the outcome for claims savings analyses) were less normally distributed than if 3 or more years of claims data could be used. Weighted regression models nonetheless explained very large proportions of variance in the outcome – as much as 91.1% for the model excluding members whose claims cost change (increasing or decreasing) pre-post intervention was in excess of $25,000.
This recommended claims savings model estimated participant savings over control at $40.65 PMPM for 2007, and gross claims savings of $980,281. Program ROI, after including vendor fees, incentive cost recovery and incentive costs, was estimated at 2.87:1 for program year 3, which is consistent with published estimates of other programs. 5
Here, as with other population-wide employer programs, all those eligible for the intervention were encouraged to participate (most via incentives). Those who chose not to participate may have differed from participants in unobservable ways, which could have biased claims savings estimates. The 2-stage regression modeling approach used here attempted to control for selection bias via propensity score weighting, but, because such differences are unobservable, randomization to intervention and control groups is necessary to achieve the highest confidence in claims savings results.
Where possible, interventions should use randomization to achieve the highest evaluation confidence. However, population health improvement requires engaging the highest proportion of the population possible, which generally requires financial incentives to achieve. To normalize the influence of incentives, employers can offer incentives to all members, whether they are or are not selected for intervention. Such an intervention design may prove more difficult to achieve ROI, though, because incentive costs are distributed broadly while savings are expected to derive only from the intervention group.
Not included in this ROI analysis were other benefits and expenses commonly associated with health promotion interventions such as savings due to decreased absenteeism, presenteeism, disability or workers' compensation claims, or expenses due to internal organizational (eg, administrative staff wages) or opportunity costs. Including all such benefits and expenses is, of course, desirable for better understanding total ROI. Where these data sources are made available to program evaluators, they should be used to assess program-attributable cost or benefit in a manner equally rigorous to the claims savings methodology employed here. Such studies will set new standards for program evaluation within the population health management industry.
Footnotes
Author Disclosure Statement
Paula Sheehan was employed by the regional hospital employer discussed in this article. Adam Long is employed by Onlife Health, the vendor providing wellness and health coaching services to the hospital employer. No other conflicts of interest or financial relationships exist.
a
Information about survey questions, response options, mean values per year per measure, etc, are available from the first author upon request.
b
Even if these claims could be made available, however, such savings would be to the benefit of the health insurance carrier rather than the hospital employer. Only if such savings resulted in reduced health insurance premiums would it have benefited the hospital employer.
c
Not included in this analysis are health care expenses incurred by the member (eg, coinsurance, co-pay) or administrative fees to the claims payer (third-party administrator). Thus, actual claims paid by the hospital employer constituted the savings opportunity.
d
Claims savings analyses for year 4 can be computed when 2008 mature claims are made available.
e
Trend, in this methodology, is the outcome of growth-curve analyses using claims year as predictor and inflation-adjusted employer claims-paid dollars (per member) as the outcome. Because only 2006 and 2007 claims data were available for this analysis, however, trend was little more than a 1-year residualized change in PMPM costs. (The benefit of using trend as the outcome in the 2-stage design is more apparent with more claims years because the outcome's distribution becomes more normal.)
f
Many employers make only those members enrolled in the medical plan eligible for such interventions. In those instances, it is appropriate to include predictors specific to preintervention claims data such as identified (comorbid) diagnoses. For the hospital employer, however, where employees not enrolled in the medical plan were also eligible for interventions, including claims-based data for propensity score creation would have biased estimates based on health plan enrollment. For example, members not in the health plan may be equally likely to have chronic conditions but we would not have identified them because there were no claims data.
g
Number of diagnosed claims served as a proxy for disease severity. Because each was measured independently, comorbidities for these conditions were captured. Also note that, by using PMPM inflation-adjusted trend as the OLS regression outcome, and other claims-derived variables as covariates, employees who were not in the medical plan were, of course, dropped from savings analyses. This is appropriate because the hospital employer could only observe savings from those enrolled in the medical plan.
h
Outliers defined at higher thresholds were subsets of those defined at lower thresholds. For example, the 16 members defined as outliers from pre-post cost changes in excess of $50,000 were also identified as outliers when the threshold was set at $25,000.
i
Work Limitations Questionnaire, © 1998, The Health Institute; Debra Lerner, Ph.D.; Benjamin C. Amick III, Ph.D.; and GlaxoWellcome, Inc. All Rights Reserved.