
Abstract
The purpose of this retrospective cohort study was to examine the impact of the type of health plan (capitated vs. fee for service [FFS]) on outcomes (medication adherence and health care service utilization) in type 2 diabetes Medicaid enrollees. Subjects were 8581 Medicaid enrollees with type 2 diabetes who newly started oral pharmacotherapy and were followed for 6 months before and 12 months after the index antidiabetic medication to collect data on medication adherence and health care service utilization. Multiple log-linear regression analysis was used to predict medication adherence while negative binomial regressions were used to examine health care service utilization. Medication adherence was found to be significantly lower for patients in capitated plans (5%, P < 0.05). Moreover, patients in capitated plans were associated with 14% more hospitalizations and 16% increased odds of emergency room visits, but 27% fewer outpatient visits compared to those in FFS plans (all P < 0.05). Although Medicaid programs use capitated managed care plans primarily as a cost-containment strategy, these plans may not be cost-effective for the long-term management of chronic conditions such as diabetes. (Population Health Management 2010;13:209–218)
Introduction
The chronic nature of diabetes entails self-management and continuous medication adherence. Poor adherence to oral antidiabetic drugs (OADs) has been associated with the development of complications, disease progression, hospitalizations, premature disability, and mortality. 3 –5 Although medication adherence is crucial to achieve glycemic control, adherence rates to OADs were significantly low (ranging from 36% to 93%) and adherence rates to insulin therapy vary from 62% to 64% in the United States. 5 The costs associated with poor adherence have been estimated to approach $100 billion per year. 3
Several factors affect patient adherence to medications. Insurance coverage/type of health plan plays a key role in providing access to essential health care services. With no or limited insurance coverage, patients who use more drugs face increasing out-of-pocket costs, which may result in decreased adherence. 6 –8 The access to pharmaceutical innovation is also mediated by the patient's primary source of health insurance coverage. Patients with public insurance (Medicare and Medicaid) are less likely to receive newer medications for the management of diabetes. 9
Traditionally, Medicaid programs have paid providers primarily on a fee-for-service (FFS) basis. FFS is the financing method that pays physicians and hospitals for each service they provide. FFS health insurance plans typically allow patients to obtain care from physicians or hospitals of their choice, but in return for this flexibility they may pay higher co-payments or deductibles. 10 However, there has been an increasing trend toward managed care plans. 11 Although, there are different types of managed care programs, Medicaid is increasingly adopting capitated managed care plans as a cost containment strategy. 11 Capitation is defined as a method of payment wherein a fixed price is paid to providers to provide health care services to each enrolled client for a specified time period. 12
The literature has shown conflicting impact of capitated managed care programs on patient outcomes. Randomized clinical trials did not find any significant differences in health outcomes of chronically mentally ill Medicaid recipients in capitated vs. traditional FFS plans. 13 However, other studies showed that capitated health plans were associated with a significant reduction in hospitalization rates, length of stay, and associated costs when compared with FFS plans in Colorado, Utah, and California Medicaid programs. 14 –16 On the contrary, the Maryland State Medicaid program found that FFS coverage not only improved ambulatory care but also contained costs associated with avoidable hospitalization for pediatric populations. 17
Data are lacking on health outcomes for patients with chronic conditions (eg, diabetes) in capitated plans in the Medicaid population. 6,13,17 Particularly, the effect of type of health plan (such as capitation) on medication adherence and health care service utilization on type 2 diabetes patients is uncertain. Taking into account the limited amount of health care resources and growing health care expenditures, examining the effect of type of health plan on outcomes will be helpful to policy makers to make informed decisions regarding appropriate adoption of reimbursement policies and effective allocation of limited health care resources for this vulnerable population. Hence, the primary objective of this study was to examine the association between type of health plan (FFS vs. capitated) and economic outcomes (medication adherence and health care service utilization) in type 2 diabetes Medicaid enrollees.
Methods
Study design
This was a retrospective case-control study design comprising 8 State Medicaid data licensed from Thomson Medstat. The data were from 8 different states, including at least 1 state from each region of the United States. 18 The database consists of pooled health care utilization data for approximately 7.4 million Medicaid enrollees from 1999 to 2005. It includes medical (outpatient and inpatient services), drug, and long-term care claims, and eligibility records for these enrollees. The database is Health Insurance Portability and Accountability Act compliant and features encrypted member and service provider identification numbers. For the purposes of this study, the Medicaid database was updated and queried for the period of July 1, 2002 to December 31, 2005.
Study population
The following inclusion criteria were used: Patients between 18 to 64 years of age; A diagnosis of type 2 diabetes (International Classification of Diseases, Ninth Revision code 250.0x-250.9x, where x = 0 or 2) during July 1, 2002 to December 31, 2005; An OAD index medication fill (January 31, 2001, through December 31, 2004); Continuous enrollment during the follow-up period: patients were followed for 6 months before and 12 months after the date of the first OAD prescription fill (the index date); Moreover, patients were required to be OAD therapy naive (no fills for any OAD during the 6 months before the index date). OAD medications were grouped by therapeutic class, including metformin, sulfonylureas (SUs), thiazolidinediones (TZDs), alpha-glucosidase inhibitors, and meglitinides. Patients who used more than 1 OAD medication were classified as combination therapy.
The following exclusion criteria were used: Patients who were on insulin therapy at any time during the follow-up period (ie, 6 months pre- and 12 months post-index), which also includes patients who started insulin at any time after the index claim for an OAD. These patients were excluded because the claims data set does not provide sufficient information to calculate medication adherence for insulin therapy, making it impossible to examine the primary objective (adherence to insulin) in patients on insulin therapy. Medication adherence for patients on insulin therapy also is substantially different from those on oral medications because of the complexity of the dosing regimen. Additionally, these are high-risk patients whose level of severity is higher compared to those on oral therapy and, thus, they do not make a comparable cohort. Patients with diagnosis of type 1 or gestational diabetes; Patients who switched from one type of health plan to another (eg, from capitated to FFS or vice versa) during the follow-up period.
The final breakdown of sample size after applying all inclusion and exclusion criteria is illustrated in Figure 1.
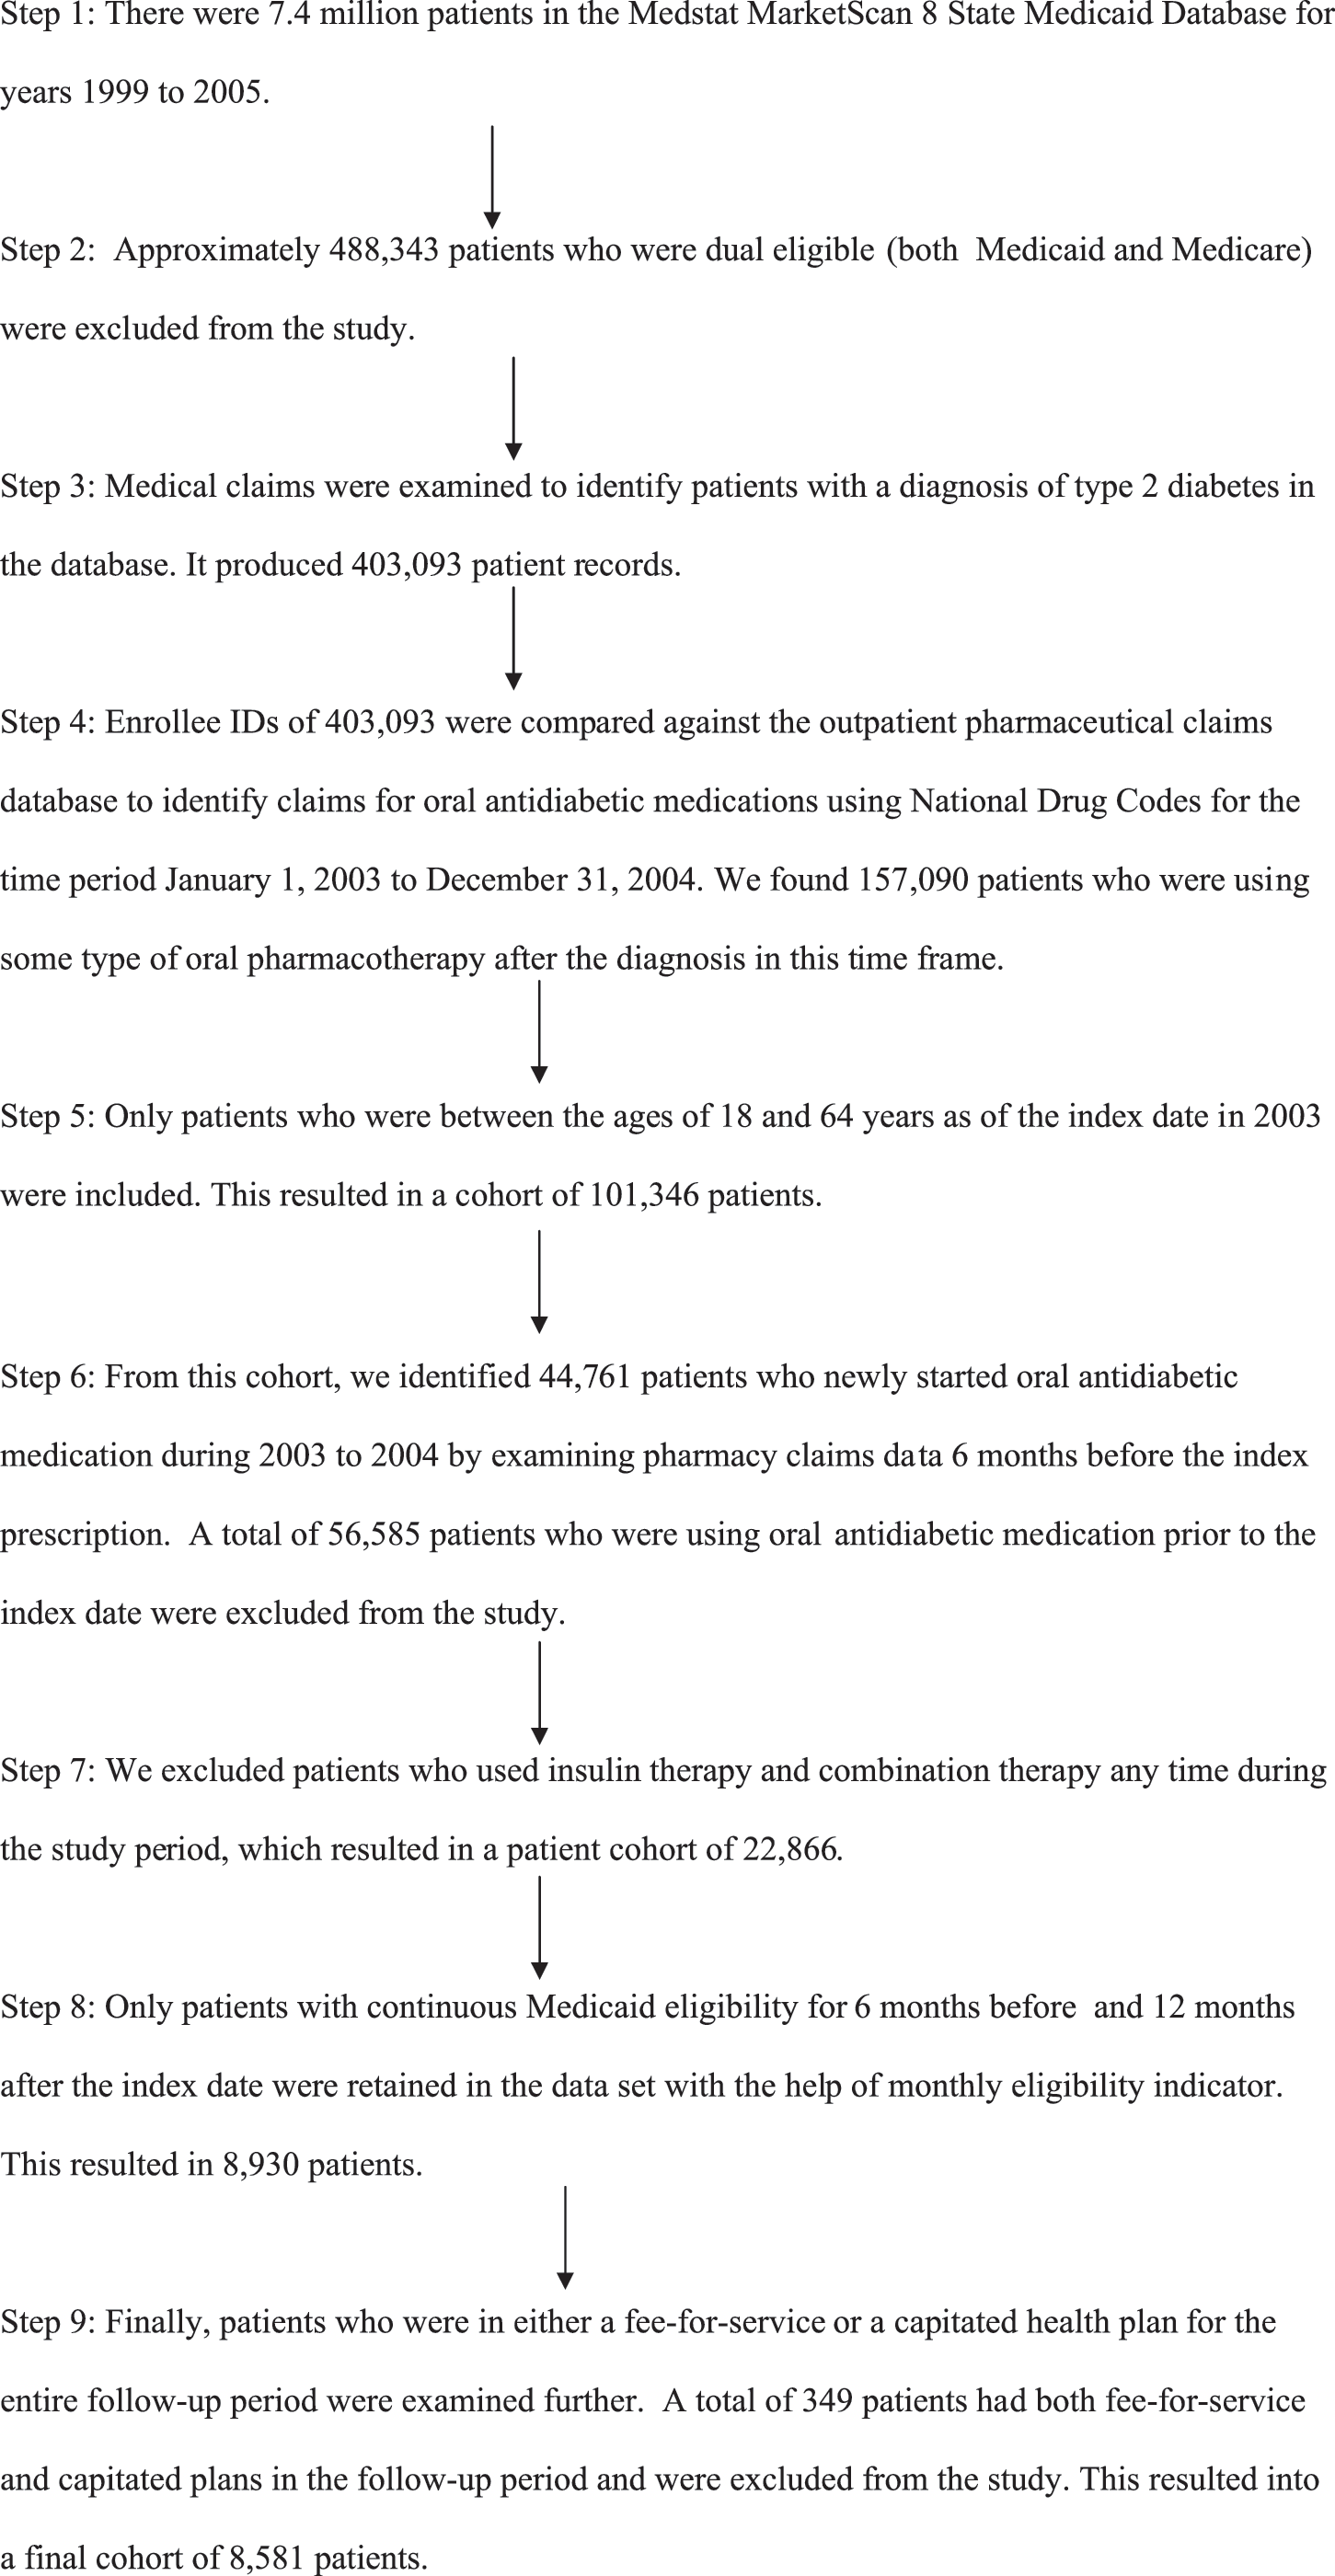
Steps involved in the creation of final study cohort (after applying all inclusion and exclusion criteria).
Measurement and outcomes
Medication adherence
Pharmacy records have shown predictive validity as a measure of cumulative exposure and gaps in medication supply 19 ; hence, prescription refill patterns were used to derive measures of medication adherence. Medication possession ratio (MPR) was used to measure medication adherence. MPR was calculated as the days of OAD medication supply dispensed divided by the number of days in the observation period. 19 –21 The observation period for this study was 12-month follow-up period. The number of days a person was in a hospital was subtracted from the denominator because any drug taken during this time is provided by the hospital and is not captured in the pharmacy records. Information on all filled prescriptions was extracted from the pharmaceutical claims data file. Each record contains information on the medication dispensed including date of dispensation, quantity dispensed, and days supply of medication.
MPR = # of days supply of OAD medication in the post-index period/# of days in the study period (365 days).
Type of health plan (FFS vs. capitation)
The MarketScan Medicaid database provides a patient-level indicator variable for the type of health plan each patient is enrolled in. Medicaid has classified plans into 2 groups
18
: Capitation: represents capitated managed care plan in which managed care organizations receive a fixed amount of payment per enrollee per month. All or some services offered by managed care organizations are paid on a capitated basis. Fee-for-service (FFS): represents health plans that pay providers or physicians on the basis of services rendered. There is no incentive for the patient to use a particular list of providers. Coverage is handled by only 1 policy, with a deductible and coinsurance. The patient-level variable is coded as 1 for capitation and 0 for FFS health plan.
Health care service utilization
Patients' complete health care service utilization was followed during the post-index period and events were identified using Current Procedural Terminology/ICD-9 codes and service codes. Health care service utilization was measured as the number of hospitalizations, the odds of emergency room (ER) visits, and the number of outpatient visits.
Demographic variables
Patient's age, sex, race/ethnicity.
Clinical variables: Diabetes/Comorbidity severity
Deyo modification of Charlson Comorbidity Index (DCCI) was used to measure severity of comorbidities. 22,23 This index is a simple, readily applicable method of estimating risk of death from comorbid disease. DCCI has been validated for several other health outcome estimations besides death. 24,25 Health care utilization in the pre-index period was used as a proxy for severity of diabetes. ER visits, hospitalization visits, and visits to endocrinologists in the pre-index period were captured from the medical claims.
Medication/therapy related variables
The number of prescription medications, number of therapeutic classes of medications, the class of index OAD medications prescribed, and the year the index medication was prescribed were also measured as covariates.
Statistical analysis
Descriptive statistics were performed to compare baseline characteristics. Continuous data were described by means and standard deviations, and nominal and categorical data were described by frequencies and percentages. Unadjusted demographic, clinical, and medication characteristic comparisons between groups were completed using independent sample t tests for evaluation of continuous variables and chi-square tests for categorical variables. The data were analyzed using STATA software version 9.2 (Stata Corp, College Station, TX). 26 All univariate, bivariate, and multivariate analyses were conducted at a set α priori level of significance (0.05).
The ordinary least square (OLS) regression was used to evaluate the relationship between the type of health plan and medication adherence after controlling for potential covariates. The primary independent variable was the type of health plan (FFS vs. capitation). Other covariates included in the model were demographic (age, sex, race/ethnicity), clinical variables such as DCCI, health care resource utilization in pre-index period (hospitalizations, ER visits), and therapy-related variables (number of prescriptions, therapeutic class of medications, class of index OAD medication, year of index medication prescribed).
The normality was determined using the Shapiro–Wilk test. 27 The heteroskedasticity was determined using the White test. The data were also examined for multicollinearity (ie, a linear relationship between predictor variables). A variation inflation factor of <10 was considered to indicate absence of multicollinearity.
The logistic regression model was used to determine the odds of ER visits. The standard negative binomial regression model was used to predict the number of outpatient visits while the zero-inflated negative binomial regression model was used to predict the number of hospitalizations. The adequacy of model was examined using the Vuong test. 26 The log retransformed value of the dependent variables used in the model, g*, was calculated using the correction by Halverson and Palmquist estimator with a modification by Kennedy. 28,29
Results
Patient characteristics (Table 1)
Chi-square test of independence for categorical variables; the independent sample t test for continuous variables.
ER = emergency room; FFS = fee-for-service; SD = standard deviation.
The study cohort consists of a total of 8581 patients with type 2 diabetes. Patients had mean age of 47.32 years (standard deviation [SD]: 10.93) and comprised 67.9% females (n = 5831). The majority of patients were white (60.3%) followed by African American (27.8%); only 2.6% were Hispanic. A total of 3763 (43.9%) patients were enrolled in capitated health plans and 4818 (56.2%) were enrolled in traditional FFS plans.
The bivariate analysis showed that the mean age of patients enrolled in capitated plans (46.06 [SD: 11.24]) was slightly lower than that of patients enrolled in FFS plans (48.30 [SD: 10.58]; P < 0.001). The proportion of females (72.7%) was significantly higher in capitated plans compared to FFS plans (64.2%; P < 0.0001). Capitated plans had a higher percentage of African Americans (36.8%) than FFS plans(20.8%; P < 0.001). When we looked at health care service utilization in the pre-index period, visits to endocrinologists were slightly higher in capitated plans than in FFS plans (1.4% vs. 0.2%; P < 0.0001). The number of ER visits was slightly lower in capitated plans compared to FFS plans (39.8% vs. 42.3%; P < 0.018); however there was no significant difference in number of hospitalizations.
Medication adherence (Table 2)
significance at 0.05 level, **significance at 0.0001 level, Reference groups: Age group 18–29 years; Male sex; All other races; Sulfonylurea users.
A multivariable logistic regression; ψAn ordinary least square regression; 95% CI = 95% confidence interval; ER = emergency room; MPR = medication possession ratio; OR = odds ratio; SE = standard error; OAD = oral antidiabetic drugs.
The OLS regression model showed that after adjusting for all covariates, patients in capitated plans had 5% lower medication adherence compared to those in FFS plans (P < 0.05). Other covariates in the model were also predictors of medication adherence. Patients ages 30–50 years and 50–64 years had higher medication adherence (55% and 73%, respectively; P < 0.0001) than those ages 18–29 years old. Females, African Americans, and patients with previous ER visits and hospitalizations had lower medication adherence (P < 0.0001). When categorized by the type of OAD therapy, biguanide users had 5% higher medication adherence as compared to SU users (P < 0.05). Alpha-glucosidase and meglitinide users had significantly lower medication adherence compared to SU users (47% and 36%, respectively, all P < 0.0001). There was no significant difference in adherence between TZD, fixed dose combination therapy, and SU users.
We also evaluated the effect of type of health plan on adherent (MPR ≥80%) and nonadherent groups (MPR < 80%) by performing logistic regression. Patients in capitated health plans had 11% lower odds of being adherent to medications compared to those in FFS plans after controlling for all the covariates (95% confidence interval [CI]: 0.82, 0.98). This analysis also confirmed that females (22%, 95% CI: 0.71, 0.86) and African Americans (33%, 95% CI: 0.61, 0.75) were less likely to be adherent to therapy. Patients who used alpha-glucosidase inhibitors (68%, 95% CI: 0.11 to 0.88) and meglitinides (65%, 95% CI: 0.22 to 0.56) were less likely to be adherent to therapy compared to those who used SU.
Estimation of hospitalizations across the health plans (Table 3)
significance at 0.05 level; **significance at 0.0001 level, Reference groups: Age group 18–29 years; Male sex; All other races; Sulfonylurea users.
A multivariable logistic regression; ψThe zero inflated negative binomial regression 95% CI = 95% confidence interval; OR = odds ratio; SE = standard error; OAD = oral antidiabetic drugs.
The zero-inflated negative binomial regression model revealed that patients in capitated plans were associated with a 13.9% increase in the number of hospitalizations when compared to patients in FFS plans (β = 0.13, 95% CI: 0.02, 0.23). Patients with prior ER visits (45%) and hospitalizations (75%) were associated with a greater number of hospitalizations compared to those without these events (95% CI: 0.40, 0.63 and 0.58, 0.82, respectively). A higher Charlson score and more therapeutic classes of medication used in the pre-index period was also associated with an increased number of hospitalizations (P < 0.05).
Estimation of ER visits across the health plans (Table 3)
A multiple logistic regression was employed to measure the association between type of health plan and the likelihood of emergency room visit, the results of which are illustrated in Table 3. Patients in capitated health plans were 16% more likely to have an ER visit than those in FFS plans (95% CI: 1.06, 1.28). Those who were in the age group 30–49 and 50–64 years were less likely to have an emergency room visit compared to those between 18–29 years (95% CI: (0.51, 0.73) and (0.33, 0.47), respectively). African Americans (28%, 95% CI: 1.15, 1.42) and patients with higher Charlson scores (7%, 95% CI: 1.04, 1.09) were also associated with an increased risk of ER visits.
Estimation of outpatient visits across the health plans (Table 4)
significance at p < 0.05 level, **significance at P < 0.0001 level, Reference groups: Age group 18–29 years; Male sex; Other races; Sulfonylurea users.
The negative binomial regression.
95% CI = 95% confidence interval; ER = emergency room; OAD = oral antidiabetic medications; OR = odds ratio; SE = standard error.
Table 4 shows that patients enrolled in capitated health plans had 27% fewer outpatient visits compared to those in FFS plans (P < 0.0001). Those ages 50–64 years had 23% fewer outpatient visits, while African Americans had 9% fewer outpatient visits (P < 0.0001). Similarly, patients who used meglitanides, TZD, and fixed dose combination therapy were associated with a higher number of outpatient visits compared to those who used SU (P < 0.0001).
Discussion
The study included type 2 diabetes patients between 18 to 64 years of age who used some type of oral pharmacotherapy in Medicaid settings. The study consists of a higher proportion of older adults (mean 47 years). The age distribution is consistent with the literature indicating a higher prevalence of diabetes with older age. 30 The database consisted of a higher proportion of female patients compared to other observational studies. The distribution of the type of health plans was uniform in this study population (44% FFS and 56% capitated plans). The findings are consistent with the literature that shows an increasing trend toward capitated managed care plans in Medicaid programs. According to the Kaiser Family Foundation, approximately 45% of Medicaid enrollees received services under capitated managed care. 31
The study found significant differences in OAD medication adherence by type of health plan. Patients covered by capitated plans had 5% lower mean OAD adherence compared to patients in FFS plans. The limited prescription drug benefits offered under capitation could be the primary reason for this finding. Although most Medicaid programs offer this type of coverage, it varies widely from state to state. Capitated health plans provide a fixed dollar amount per member per month for all pharmacy services. These caps allow health plans to provide some benefits to a large patient population at a predictable level of total expenditures for the plan in a market in which medication costs are increasing rapidly. Once that limit is reached, patients must pay all pharmacy costs out-of-pocket in order to get their medications.
The New Hampshire Medicaid program, which had imposed a cap on prescription benefits, experienced a 35% reduction in drug use when compared with the control group (New Jersey program without any cap). 32 Moreover, other studies showed that patients who exceed this cap were 2 to 3 times more likely to discontinue medications. 33,34 Hence, restricted prescription coverage offered under capitation could be associated with lower medication adherence by Medicaid beneficiaries compared with FFS. Conversely, coverage under FFS plans is based upon the type and number of prescription medications or any pharmacy services used. Patients generally pay some or no co-payments for medication. In Medicaid programs, co-payments are very low and generally range from $0.50–$3 per refill.
Patients in capitated health plans had a significantly higher number of hospitalizations and ER visits compared to those in FFS plans. Capitation may lead to undertreatment, substitution of inadequate health services, cost shifting to other service systems, and poor treatment, which in turn may result in poor patient outcomes and excessive use of health care resources. 35,36 Our study also showed that patients in capitated plans had significantly lower medication adherence, which could be further associated with significantly higher health care service utilization. Several studies have shown that poor medication adherence is associated with higher health care utilization and costs. 3,4,37
Patients in capitated health plans had a significantly lower number of outpatient visits compared to those in FFS plans. This could be due to inadequate capitation rates or it could take place when a medication cap is reached. The literature has shown mixed findings. Some studies indicate that access to specialty care or ambulatory care was decreased under capitated plans. 16,38 However, others studies showed improved outpatient visits after capitation 39 (Iowa 40 and Maryland 41 ). Capitation provides direct financial incentives to manage utilization, thereby motivating providers and health plans to use health care resources more effectively. However, this might lead to a shorter duration of treatment or limited patient follow-up or visits. 42 Several other research studies have shown that, under capitation, physicians tend to make more referrals to colleagues when the limit is reached. 43 Therefore, it could be that lower medication adherence and poor monitoring might be responsible for higher health care utilization for patients in capitated health plans. Improved medication adherence has been associated with better glycemic levels and a reduced risk of hospitalization and ER visits 3,44 and is therefore of paramount importance to patients with diabetes.
Limitations
These results should be interpreted with caution, taking into account the study limitations. The 8 State Medstat MarketScan database does not disclose the identity of the states that contributed the data. Hence, we could not compare differences in study outcomes across states. Moreover, the database does not provide any information on type or level of capitation or pharmacy benefit caps and, as a result, we could not examine variations across the different capitated health plans. Results may not be generalizable to other patient populations (eg, Medicare, commercial third-party). Furthermore, the observational nature of the study design does not permit causal inference of results.
The study could not examine the associations between certain sociodemographic characteristics (eg, education, income, socioeconomic status), clinical factors (eg, HbA1C, body mass index), behavioral factors (eg, social support), psychological factors (eg, patient health beliefs, perceived severity of disease, perceived benefits of treatment), and medication adherence because data were not available. However, health care utilization and Charlson Comorbidity Index scores in the pre-index period were used as a proxy for the severity of diabetes. The study excluded patients on insulin therapy because data were not available to adequately measure insulin adherence. This may introduce selection bias as these patients may be sicker or more nonadherent.
Cost data are not captured under capitated health plans, and hence the association between type of health plan and total health care cost could not be evaluated. To avoid potential misclassification bias resulting from billing or coding errors, total health care utilization was examined (captured as encounter data), such as hospitalizations and ER visits, as opposed to diabetes-specific utilization.
Implications
Despite these limitations, this study has some important implications for health care providers and policy makers. Insurance coverage plays a key role in providing access to essential health care services. All patients covered by Medicaid should receive equal access to health care services, especially all the necessary medications for the effective management of diabetes. In our study, patients in capitated health plans had significantly lower medication adherence to OAD therapy compared to their FFS counterparts. Medication adherence plays a critical role in the effective management of diabetes because it requires continuous medication use. Differences in medication adherence across type of health plan raise important concerns regarding benefits offered under capitated health plans. Further investigation is warranted to identify potential gaps in OAD adherence across plan type.
Capitated health plans must develop adequate strategies to improve access to health care services for patients with diabetes. Medicaid beneficiaries are low-income patients and, therefore, are very sensitive to increased out-of-pocket expenses. As a result, it is essential that clinicians actively identify patients with diabetes who are facing medication cost pressures and assist them by modifying their medication regimens, helping them understand the importance of each prescribed medication, providing them with information on sources of low-cost drugs, and linking patients with coverage programs. There is a need for policy makers to reconsider the guidelines for coverage under capitation.
Capitated plans must improve access to care by placing increased emphasis on outpatient care in order to reduce reliance on inpatient and institutionalized care. Disease management interventions are also required, such as the tailored medication regimens, lifestyle modifications, self-management, continuity of treatment and monitoring, and patient education over time. Physicians, nurses, pharmacists, and dietitians play a key role in providing these services to patients and effectively monitoring diabetes. However, restricted access to care and limited outpatient care may hinder these activities and further affect medication management and medication adherence.
The main goal of the capitated payment system is to provide incentives to reduce reliance on institutional and inpatient care in favor of outpatient care, and to increase emphasis on preventive care. The expected net result is to reduce, or at least stabilize, health care utilization. However, results from this study indicate that Medicaid capitated health plans fail to achieve these objectives. Disparities in medication adherence, access to care, and health care utilization warrant raising awareness of the health care gap among broad sectors including payers, policy makers, health care providers, patients, health plan purchasers, and society at large.
Conclusion
This study clearly indicates that patients with type 2 diabetes who are covered under Medicaid capitated managed care plans had significantly lower medication adherence compared to those in FFS plans. Additionally, these patients had significantly fewer outpatient visits, which further reflects limited access to health care services and continuity of treatment. Patients in capitated health plans were associated with a significantly greater number of hospitalizations and ER visits compared to patients in FFS plans, which reflects excessive use of health care resources. Although Medicaid uses capitated managed care plans primarily as a cost-containment strategy, they may not be cost-effective for the long-term management of chronic conditions such as diabetes. Policy makers and third-party payers should consider the unique needs of patients with type 2 diabetes and facilitate access to medications and care for better management of the disease.
Footnotes
Author Disclosure Statement
Drs. Pawaskar, Burch, Seiber, Nahata, and Balkrishnan, and Ms Iaconi disclosed no conflicts of interest.