
Abstract
The objective of this study was to assess the validity of 3 scoring techniques for presenteeism measures by exploring their relationship with patient activation, health, job satisfaction, and socioeconomic characteristics. The sample consisted of 631 employees from 2 predominantly white-collar employee groups in the northern Midwest. Employees completed the World Health Organization's Health and Work Performance Questionnaire, a wellness profile, and the Patient Activation Measure. Absolute measures reflect self-rated performance, while relative and stratified measures compare self-rated performance to that of co-workers. Multivariate analyses were used to validate scoring measures. All measures of presenteeism were positively correlated with being nonwhite, income, and smoking. The significance of age, employment, mental health, and patient activation depends on how presenteeism is defined. Practitioners must carefully consider which scoring method best addresses their program goals and objectives. Clearer measurement guidelines are needed. (Population Health Management 2010;13:297–307)
Introduction
Some of the instruments currently used to measure presenteeism are the World Health Organization's Health and Work Performance Questionnaire (HPQ), 3 the Stanford Presenteeism Scale (SPS), 4 and the Work Limitation Questionnaire (WLQ). 5 Because the direction, magnitude, and interpretation of these respective scales and scoring algorithms vary, the field lacks consensus regarding which instrument(s) best assesses the concept. This has led to the concept of presenteeism being referenced in conflicting ways and to confusion in the field regarding directional effects. For example, both the HPQ and the SPS refer to higher levels of presenteeism as a good thing, with higher scores indicating higher performance and job productivity. 3 The WLQ, however, refers to presenteeism as “sickness presenteeism,” when an employee goes to work “despite perceiving him or herself sufficiently ill to have legitimately called in sick.” In this case, higher scores for sickness presenteeism indicate lower productivity. 6
In this study, we measured employee productivity using the presenteeism questions from the HPQ. Developed by Kessler and colleagues, the HPQ is a short, self-reported instrument used to determine indirect workplace costs due to illnesses. It has been tested in a variety of industries and has been shown to be valid and reliable for assessing reduced job performance and sickness-related absences. 3
Using this instrument, higher levels of presenteeism are associated with higher levels of productivity. When employees lack presenteeism, the underlying assumption is that their (poorer) health status negatively affects their workplace productivity. Although it seems clear that chronic conditions such as arthritis and asthma impair worker productivity, 7,8 other chronic conditions such as chronic obstructive pulmonary disease, depression, ulcers, panic disorders, heart disease, and diabetes have also been associated with higher levels of absenteeism and lower levels of productivity. 8 Most research on presenteeism has focused on biological predictors of lost productivity, even though psychological factors such as life satisfaction or work satisfaction may predict greater productivity losses. 8
As an indicator of work impairment and lost productivity of those at work with health problems, presenteeism has been viewed as a vital new measure of the economic importance of maintaining good health. 7,9,10 The cost associated with the lack of presenteeism varies by job classification, type of workplace, type of industry, and structure of the workforce. 1,8,11 Studies to date indicate productivity losses from the lack of presenteeism of more than 30%, 8,12 sometimes exceeding the costs of absenteeism 10 and even surpassing the costs of absenteeism and medical treatment combined. 9 Measures of presenteeism are increasingly being added to the list of variables that establish the need for, and determination of, the economic benefits of employee health programs. 1,11,12 However, despite the potentially profound economic impact of presenteeism, it has been criticized as a construct that lacks consistent theoretical application or clear guidelines for when and how practitioners would use such measures. 11,13
Understanding the general relationships between health conditions and presenteeism provides only partial insight into the economics of these associations. According to Aronsson and colleagues, coming to work sick relates to personal circumstances such as poor health status, time pressure, and/or a poor financial situation. 2 Furthermore, presenteeism may vary with such externalities as weak economic times and corporate downsizing. 12,14 In turn, estimating the economic consequences of presenteeism is affected by how difficult the worker is to replace, whether there is a team to absorb the work, or whether the work can be postponed. 9,11 Similarly, variables such as higher co-pays for health insurance may lead workers to forgo necessary health care treatments which could, in turn, increase problems associated with productivity. 12 Innovative changes in the health care setting, as well as the unintended consequences of changes in health benefits, labor practices, or population health management practices may all affect the level of presenteeism exhibited by employee groups.
As employers increasingly shift health care costs to employees, it is essential that employees understand how to successfully navigate the health care system and use effective methods to reduce health care costs. In addition, employers must understand the effects of health promotion and the disease burden of an aging population on employee presenteeism and productivity.
The primary objective of this study was to examine how alternative methods of scoring (absolute, relative, and stratified) presenteeism and productivity affect the nature of their relationship with explanatory variables such as health. This research is intended to provide information to policy makers and practitioners who are interested in how presenteeism measurement alternatives relate to our understanding of health and productivity.
Methods
The present study derives from a randomized controlled trial comparing the effectiveness of an activated health care consumer intervention with traditional health promotion approaches to improve the health of employees. Data for this analysis were taken from a baseline survey and clinical information collected in 2 companies from March through June of 2005. These companies from the upper Midwest were participating in the ACTIVATE study, a randomized controlled trial designed to evaluate programs supporting employee health promotion. One employer is a health care system with approximately 7000 employees; the other is a national airline with approximately 20,000 employees. Organizational leaders promoted the study by encouraging their employees to participate and assuring confidentiality. All participants reviewed and signed a consent form affirming their voluntary participation. Consent forms emphasized data privacy and the data collection expertise of the external research organization responsible for the surveys. Approval of all forms, questionnaires, and protocols was obtained from the appropriate Institutional Review Board.
Sample size and composition
Recruitment staff worked with the human resources departments of the companies to encourage study participation. Invitations, consent forms, and questionnaires were mailed to a random sample of employees at their worksites (n = 1628; 832 in the healthcare system, 796 in the airline company). Employees were given a $15 incentive to attend on-site screenings where their clinical measures were collected. More than 80% of employees who completed the baseline questionnaires also completed the clinical screening. The final sample for this study consisted of 631 employees of 2 predominantly white-collar employee groups.
Measures
Study participants completed 3 questionnaires: the HPQ, the Patient Activation Measure (PAM), and a health risk assessment (HRA). The dependent measures of presenteeism and productivity come from the HPQ short form. 3,15 In the content and scoring rules developed by Kessler and colleagues, the authors note that limitations of the short form include the lack of memory priming questions and consistency checks that are available from the full HPQ. However, the scoring computations available from the HPQ result in 3 distinct methods to measure presenteeism and productivity, namely the absolute, relative, and stratified measures. These measures are described in the Scoring HPQ section of this paper.
Independent variables of interest were collected via 2 additional measurement tools that assessed health information seeking, health beliefs and knowledge, health risks, as well as sex, education, race and ethnicity, marital status, and family financial status. The first of these was the PAM, 16,17 a 13-item questionnaire designed to assess the participant's position along a continuum of consumer health activation. PAM assesses beliefs in the importance of playing an active role, knowledge and confidence to take action, ability to treat or maintain a health condition, and staying the course while under stress.
The second tool was an HRA that included both a self-report questionnaire and clinical measures. Self-reported health risks were collected using the Personal Wellness Profile (PWP), a 4-page, 39-item instrument that assesses lifestyle factors such as exercise, nutrition, stress, and tobacco use. 18 Details concerning risks definitions from the ACTIVATE study have been published elsewhere. 19 Clinical measures were collected through an on-site health screening. Procedures followed for blood sample finger sticks met Clinical Laboratory Improvement Amendment requirements and blood pressure measurement followed the Seventh Report of the Joint National Committee on Prevention, Detection, Evaluation and Treatment of High Blood Pressure measurement standards. Screening staff entered blood pressure, height, weight, and nonfasting blood laboratory values (using the “Cholestech LDX” analyzer for total cholesterol, high-density lipoprotein, and glucose results) into the PWP for inclusion in an overall health risk score.
Statistical procedures
We examined means, standard deviations, and ranges of dependent variables. We then conducted bivariate analyses to examine the effects of numerous factors (eg, sociodemographic characteristics, health risks, healthy behaviors) on dependent variables. For continuous independent variables, Pearson correlation coefficients were computed. For dichotomous independent variables, 2-sample t tests were used. Analysis of variance was applied if the independent variable had more than 2 categories. The robustness of the bivariate results was tested using multivariate regression analyses. All analyses were performed using SAS statistical software, (version 9.1, SAS Institute Inc., Cary, NC).
Scoring HPQ
The absenteeism questions used in HPQ ask respondents to recall their work experiences of the past 4 weeks and indicate the number of days they missed from work. In scoring HPQ, responses about missed days at work for health or other reasons can be computed in relationship to how many hours the respondents indicate they are expected to work. Other questions ask the respondents to rate their usual work performance and the usual work performance of their coworkers on a scale ranging from 0 to 10, with a score of 0 indicating the “worst” performance and a score of 10 indicating the “top” performance. (As stated previously, other presenteeism scales define a “high” score in presenteeism to be associated with low performance.) As outlined by Kessler and colleagues, these questionnaire items are used alone or in combination to define 3 HPQ presenteeism definitions.
Absolute Presenteeism
Indicates “how I rate my performance on the job,” defined by dividing the respondent's self-reported rating of “my usual performance” by 10. Scores range from 0 (lowest performance rating) to 1 (highest performance rating).
Relative Presenteeism
Indicates “how I rate my performance compared to how I rate the performance of others,” defined by self-performance divided by coworkers' performance. In this study, the observed scores for relative presenteeism range from 0.25 (lowest relative performance rating) to 2 (highest relative performance rating). A score of 1 means respondents have rated themselves equivalent to their coworkers.
To support additional questions about the relationship between presenteeism and our variables of interest, we created an additional scoring approach that we call stratified presenteeism, which is a 3-level categorical variable based on the value of relative presenteeism. If relative presenteeism is less than 1.0, the stratified presenteeism level is “underperforming.” If relative presenteeism is more than 1.0, the stratified presenteeism level is “overperforming.” Otherwise the stratified presenteeism level is “equal performing.” This new stratified presenteeism level is intended to provide other practitioners and researchers with another marker of the relative presenteeism measure to allow additional comparisons within and between workforce populations. In further investigations we may find, for example, that an “equal performance” of 50% is typical, or perhaps varies considerably by demographics or industry type.
The use of relative versus absolute scoring, according to Kessler and colleagues, should be based on well-conceived ideas about the relationships between health and presenteeism. When comparing differences between full- and part-time workers, for example, proportional differences may be more meaningful if you believe, as Kessler and colleagues do, that “workers with half-time jobs are likely to miss only half as many hours because of the flu as workers with full-time jobs.” Conversely, if employers want to understand how many actual work days are lost as a result of a particular health condition, the use of absolute presenteeism measures is more appropriate. 20
Results
Generalization of results
The sample for this study consisted of 631 employees from 2 predominately white-collar employee groups. As shown in Table 1, participants were predominantly female (87%), and white (90%), with an average age of 45 years. The overall educational level was high, with 44% having at least a 4-year college degree. Participants generally considered themselves to be in good health; 57% indicated that their health was very good or excellent. Only 10% reported smoking either cigars or cigarettes. Overweight and obesity were prevalent (average body mass index of 28.2).
Presenteeism findings
Participants were asked to rate self and others' work performance on a scale of 0 (worst performance) to 10 (best performance). The responses for self-rating ranged from 4 to 10, with about one third at 8 (30.8%) and another third at 9 (35.0%). (There was also 1 rating of 0 and 1 rating of 3, which we deemed to be outliers and excluded from further analyses.) The ratings for others ranged from 3 to 10, with 23.1% at 7, and 39.9% at 8. To examine the differences between self and others' ratings further, we tested the relationship between these variables and found a strong correlation between self-rating and others' rating (Pearson correlation coefficient is 0.32, P < 0.0001).
Distributions of the 3 presenteeism measures are shown in Figures 1 –3. In Figure 3, the stratified presenteeism categories show that 11.2% of respondents were underperforming relative to their peers, less than a third (30.7%) were equal performing, and just under 60% (58.1%) considered themselves overperforming.
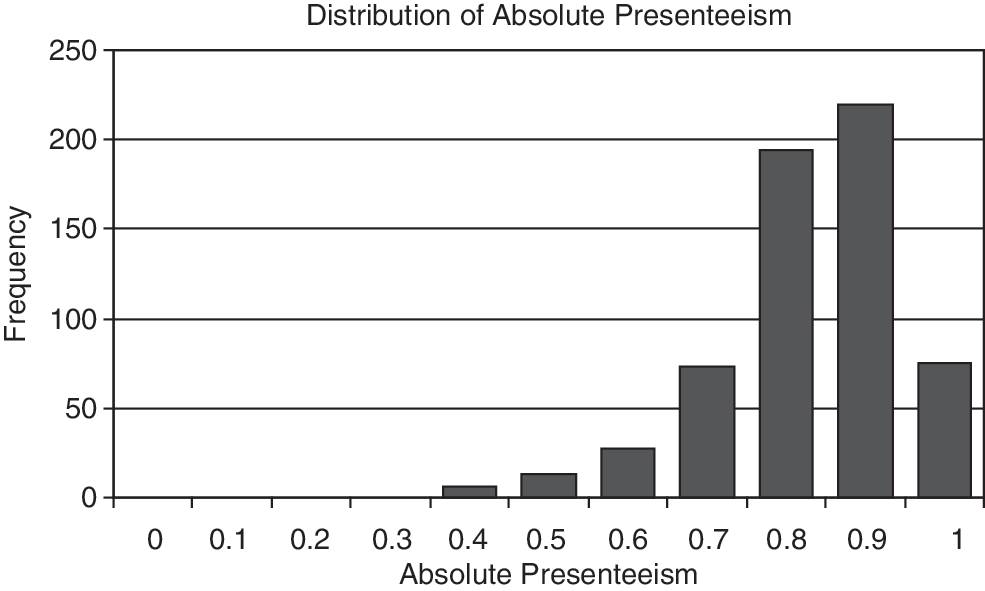
Distribution of absolute presenteeism. Definition of calculation: Absolute presenteeism is self-reported rating (ranging from 0 to 10) of usual performance divided by 10. Scores range from 0 (lowest performance rating) to 1 (highest performance rating).
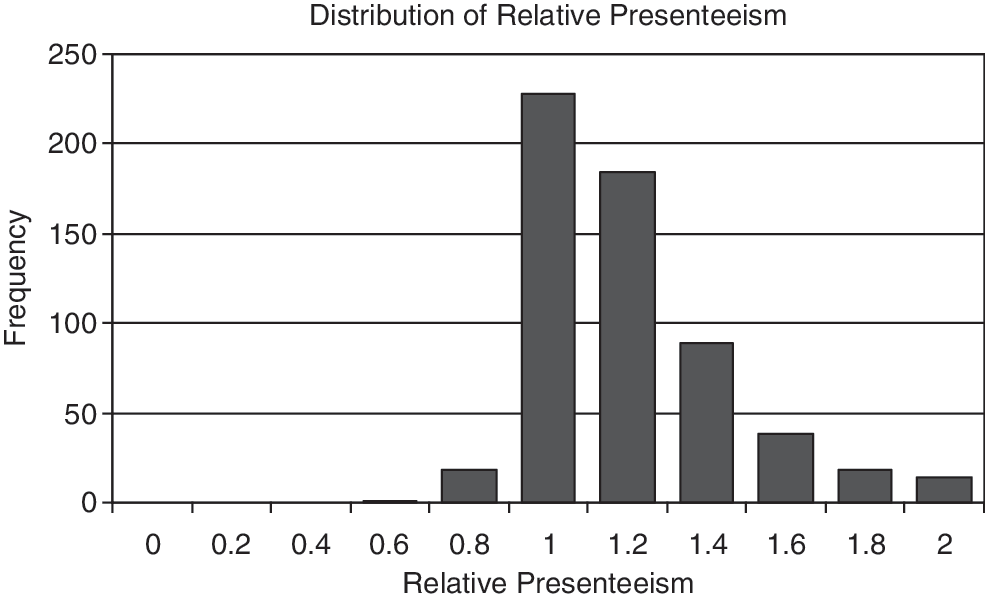
Distribution of relative presenteeism. Definition of calculation: Relative presenteeism is self-reported rating of usual performance divided by rating of others' performance. Thus, a score of < 1 means the respondents have rated themselves lower than their coworkers.
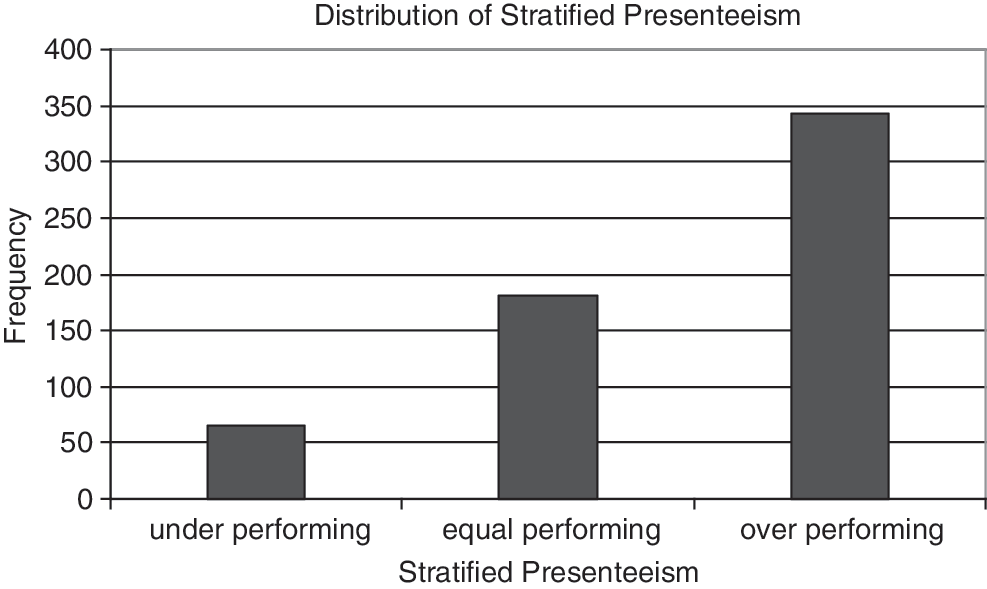
Distribution of stratified presenteeism. Definition of calculation: Stratified presenteeism is a “categorized version” of relative presenteeism. Any relative presenteeism value less than 0.9 is in the “underperforming” class in stratified presenteeism; any relative presenteeism value between 0.9 and 1.1 is in the “equal performing” class in stratified presenteeism; any relative presenteeism value larger than 1.1 is in the “overperforming” class in stratified presenteeism.
Examining the relationship of presenteeism by scoring mechanism to select variables in the ACTIVATE study (eg, health status, health risks, patient activation) produces differing associations (Tables 2 –5). For the sociodemographic variables, we found that absolute presenteeism improves with increased household income (P = 0.0004). For those 25 years of age and older, increasing age is associated with higher presenteeism. This positive relationship did not hold true for productivity scores. However, sex, race, and education did not have a significant effect on either presenteeism measure (not shown).
Note: Significant correlations (α = 0.05); PAM, Patient Activation Measure.
significant at the 0.05 level, *significant at the 0.10 level.
MCS, mental component score; PAM, Patient Activation Measure; PCS, physical component score.
significant at the 0.05 level, *significant at the 0.10 level.
MCS, mental component score; PAM, Patient Activation Measure; PCS, physical component score.
significant at the 0.05 level, *significant at the 0.10 level.
MCS, mental component score; PAM, Patient Activation Measure; PCS, physical component score.
The company for which respondents worked was the only variable that produced significant differences in all 3 presenteeism measures. Interestingly, the direction of difference varies among measures. The health services company had a higher absolute presenteeism score (0.85 − 0.81 = 0.04) than the airline company (P = 0.001), while its relative presenteeism is lower (1.11 − 1.19 = −0.08) than the airline's (P < 0.0001). With respect to stratified presenteeism, 12.9% are underperforming and 53.6% are overperforming for the health services company, compared to 9.5% and 62.7%, respectively, for the airline company.
Participants who are “very or mostly satisfied” with their jobs have higher absolute presenteeism scores (0.06) than those who are “not very satisfied or dissatisfied” (P < 0.0001). However, the relative presenteeism measure indicates the opposite: the “satisfied” group scores lower (1.19 − 1.13 = 0.06) than the rest (P = 0.03). Interestingly, the “not very satisfied” group has the highest percentage of respondents rating themselves as overperformers.
Respondents with “good to excellent” general health status have a higher absolute presenteeism (0.04) than those with “fair to poor” status (P = 0.001). Among health risk variables, the PAM score is correlated with absolute presenteeism (Pearson correlation coefficient is 0.18, P < 0.0001). Interestingly, those “currently smoking” reported higher relative presenteeism (0.08) than those “not currently smoking” (P = 0.01). This relationship was also confirmed by the stratified presenteeism level. Among specific health status variables, a higher mental component summary score is correlated with absolute presenteeism (Pearson correlation coefficient is 0.26, P < 0.0001) and stratified presenteeism (P = 0.003). Conversely, among those with high blood pressure, 7.4% are underperforming and 68.7% are overperforming, compared with 11.6% and 55.0% for the remainder, respectively (P = 0.01). Those who reported workplace success/achievement had a higher absolute presenteeism (0.02) than those not reported (P = 0.03). Other factors, such as whether one has any chronic diseases or is taking any medication, had no effect on productivity as measured by the presenteeism scoring methods we tested. These varied findings, illustrating both similarities and differences among presenteeism scoring methods, support our conclusion that investigators and practitioners must consider which scoring method best addresses their research and program needs.
Discussion
As indicated in the introduction, readers of presenteeism studies need to be mindful that both positive and negative denotations have been assigned to the term. Depending on the scoring of different scales, presenteeism can mean either being more productive or less productive. For example, in the SPS, decreased productivity and below-normal work quality is considered “decreased presenteeism.” 4 As Pelletier, one of the authors of the scale, notes: “many observers use the word only in a negative context of reduced performance, but we prefer a more flexible definition. Thus, heightened job performance is increased presenteeism, while diminished presenteeism occurs when employees work less productively or at a poorer quality than usual due to a health or medical problem.” 21 We also favor this formulation for the term; however, in this study we attempt to build on the presenteeism literature by consistently framing our findings in the context of lost work time and productivity.
Findings from the present study also build on the results from other recent studies indicating that analysis of presenteeism and productivity must be considered in the context of company differences. Another recent study confirmed the relatedness of health to presenteeism but also found that work factors such as time pressure, having a supervisory role, nonstandard work hours, and relationships with colleagues increased the likelihood of coming to work ill. Attitudinal variables such as being overcommitted to work were also related to higher presenteeism in this study. 6 Similarly, Allen and colleagues suggest that productivity differences by company and job may be explained by differences in the length of hours worked. More research is needed to understand how health variables may mitigate these differences. 22 We found only 1 study with results inconsistent with ours and those relative to company differences in presenteeism. Ozminkowski and colleagues found that losses in productivity and presenteeism were associated with perceived health status but were not related to demographic or company variables. 23 It may be that our findings concerning significant company differences, but nonsignificant presenteeism differences for obesity and certain chronic conditions should be juxtaposed against the Ozminkowski findings. In particular, it may be noteworthy that many respondents from several study sites were clinicians, including physicians, with a relatively advanced perspective on the principles of disease management and the viability of living well with a chronic condition. Related to this, we found that health workers were statistically similar per their number of chronic disease problems but somewhat less likely to enroll in health education interventions (data not shown). This could suggest that health workers have an inflated self-image relative to their vulnerability to or ability to deal with illness. Conversely, clinicians may be more facile in adjusting their current performance relative to their “usual” performance and make more concessions for their new normal given their beliefs about their ability to live well with obesity or a chronic health condition.
Interestingly, we found that most people rank themselves higher in presenteeism than their peers (means > 1). As illustrated in Figure 3, the underlying distribution for presenteeism self-rated scores are skewed toward scores greater than 1. Given that the majority of people reported being in good to excellent health, we would expect that these healthier individuals would rank themselves higher on presenteeism measures. Our findings that job satisfaction and health status are strongly correlated with higher presenteeism scores agree with findings in previous literature. Despite having used a different measure of productivity, for the WLQ, Burton and colleagues noted that “job dissatisfaction and poor health showed the greatest association with presenteeism.” 8 In addition to these variables, Burton noted that life dissatisfaction and stress were also strongly associated with reduced productivity. Because we found that higher income participants and more highly activated participants report higher productivity, our findings underscore the importance of considering these factors in future research.
We found that smokers are more likely than nonsmokers to rank themselves higher than their peers on presenteeism. Compared to a different measure of productivity, this finding is inconsistent with results from the American Productivity audit indicating smokers report lost productivity time as 2 times higher than nonsmokers. 24 That tobacco users in the present study using the HPQ scale reported higher presenteeism scores may be related to the attentional efficiency of nicotine that has been described in tobacco addiction literature. 25 Indeed, a common benefit of smoking identified by smokers relates to their perception that it helps them concentrate and get more work done.
Similar to this negative tobacco use and productivity finding, we found no relationship between the HPQ scores and obesity. Based on the WLQ, Gates and colleagues found a 4.2% loss in productivity that was 18% higher than non-obese workers.
A recent comprehensive review of the literature related to employee health and presenteeism offers support for several of the findings in the present study. 26 Schultz and Edington categorized the quality of presenteeism-related studies, as well as summarized findings to date. Our findings that presenteeism did not positively relate to chronic conditions may not be surprising for certain conditions such as diabetes, for which Schultz notes that “research on diabetes and presenteeism is weak.” However, Schultz reviewed 2 studies that showed lower productivity scores for people living with diabetes and noted that this relationship intensifies for those who have had the condition for many years. Other chronic conditions such as allergies or arthritis, for which Schultz rates the research as moderate or high quality, were also found to have a consistent relationship to lost productivity. 26
We found a positive relationship between mental component scores and increased presenteeism. This is consistent with the review by Schultz who found 5 studies in this domain, rated them as having high research quality, and indicated they showed a consistently positive relationship between impaired mental health and loss of productivity. 26 This finding is also supported by a recent study showing that higher risk levels of mental well-being produced a level of productivity impairment comparable to higher risk levels in stress management, weight management, and tobacco use. Only back pain was more highly correlated to lost productivity than mental well-being. 27
Although those who are satisfied with their jobs generally consider themselves more productive, perhaps the more interesting of our findings suggests that those people who are not satisfied with their jobs tend to be people who believe that they are performing better than their peers. In particular, the group identifying themselves as not very satisfied with their jobs had the highest percentage identifying themselves as performing higher than their peers (ie, 66.7% in the overperforming stratified presenteeism measure [Table 2]). However, this relationship did not hold true in the multivariate results.
When we examined the differences between self and others' ratings, we found that these two measures were highly correlated. Further study may be appropriate to address whether response set bias or some type of true covariation underlies the correlation between these two presenteeism measures. That is, perhaps there is a general tendency of respondents to rate these different constructs similarly regardless of their actual status (ie, response set bias). Alternatively, perhaps those who are more productive themselves really do tend to surround themselves with similarly productive people. Yet another possibility is that people who are more productive at work tend to make their coworkers more productive as well. The fact that these two measures are highly correlated would indicate that the relative presenteeism scores would lean toward a score of 1, indicating that the respondents consider their productivity comparable to their peers. Indeed, this was confirmed with a highly concentrated distribution of scores around 1.
The factors that influence lower presenteeism should be of keen concern to employers, given the relationship of productivity to costs. For example, one study found an average of a 5% reduction in presenteeism related to health variables as measured by the instrument used in this study. This reduction equated to an increase of $2000 per employee per year in health care costs. 23 Our understanding of the relationship between scoring methods and productivity levels will improve as employers increasingly evaluate the impact of health-related productivity on company performance. For example, in a StayWell Health Management study designed to ascertain a level of “normal” productivity impairment, Riedel and colleagues found that productivity was higher when the total number of health risks was lower. Specifically, the productivity loss of employees with the average number of risk factors (about 3 risks) was $5952 per year—this compared to productivity loss of $1472 per year for employees with no health risks. 27 Using data from the StayWell study, another way to express the monetary relevance of accurate productivity measurement is to equate changes in 1 risk factor to attendant changes in productivity costs. The StayWell research indicates that, on average, a risk factor equates to $1494 in productivity loss.
Using these cost estimates to draw conclusions from the present study, an employer with 1000 employees could conclude from either the absolute or relative presenteeism scoring method that they have a $1,494,000 productivity savings opportunity. However, employers using absolute presenteeism scoring would likely target mental health issues, and employers using relative presenteeism scoring would likely target physical health issues as indicated by health risk assessment. Interestingly, either employer would be led to consider investing more heavily in methods to improve employee job satisfaction, a predictive productivity variable that was captured by either scoring method.
Study limitations
This study adds empirical evidence to the need for a clearer definition of presenteeism, though our relatively homogenous sample suggests our data can only be extrapolated to a narrow subgroup. The validity of the multitude of measurement tools to quantify presenteeism and productivity in various other subgroups should continue to be questioned. In particular, the lack of measurable outputs associated with many jobs and the difficulty of monetizing the impact of presenteeism on such jobs has been a limitation of prior research associating productivity and its impact on employer costs. 28
The nature of the population participating in the present study introduces specific limitations in this research and affects whether our findings can be generalized to other populations. First, over 40% of respondents have a college education and over 93% have at least some college or vocational training. Accordingly, our findings may be less relevant for manufacturing or retail or lower paying industry settings. This is not to suggest, however, that the HPQ is not a relevant tool for white-collar populations. Indeed, our findings can offer a meaningful new reference against which future productivity measurement with white-collar populations can be benchmarked. For example, our finding that this study sample generally rated themselves as performing better than their colleagues, while not new to presenteeism research, does offer a new reference point for comparing this level of self aggrandizement with that of other demographically similar work groups.
Similarly, participants are employed by large organizations in the Midwest. The region has less ethnic diversity than others and large organizations tend to have more job training and work systems support than smaller employers. It may be that productivity variables that exist in other regions and work settings were underrepresented in these relatively homogenous and relatively sophisticated work settings. Or perhaps the impossibility of so many of our respondents having self-reportedly above-average productivity is simply a function of the nature of the region. That is, as local pundit Garrison Keillor attests, in Lake Wobegon, “all the children are above average.”
Conclusion
Our findings that presenteeism is influenced by varying factors depending on the scoring methods used are unique to the emerging literature about the utility of the HPQ measure. The fact that we found nonhealth variables to be as predictive of productivity differences as health variables reflects similarities found in prior reports. One recent study compared variables collected in an HRA and their relationship to productivity with other variables. Using an HRA and the WLQ, company and employee characteristics, stress and work–life balance, and job and financial concerns combined have 5 times more influence on productivity and presenteeism than health. 29
The relationship between presenteeism and productivity and various dimensions of health is quite complex. The nature of this relationship appears to depend on how presenteeism and productivity are defined. However, even a full understanding of the ways in which different scoring methods affect the relationships between health and productivity will provide only partial insight into the meaning of this relationship. This study supports findings from other research that presenteeism measurement can provide significant, though variable, information about health conditions that affect productivity. 2,30
Our findings about the significant relationships between presenteeism and select health variables affirm the need for organizations that are intent on improving productivity to include presenteeism measurement to avoid underestimating health promotion cost benefits. 7,13 Careful consideration of all scoring methods must guide where to focus resources. Coming to work sick is likely to vary substantially as a function of personal circumstances not directly tied to health status, such as insurance coverage, time pressures, family issues, or poor financial situations. 2 Accordingly, employers must carefully assess how organizational and societal changes (eg, shifts in insurance coverage, changing demographics, changes in the economy, improvement in population health management programs, and other efforts that affect health care expenditures) may also be related to changes in employee productivity. Presenteeism measurement is likely to contribute to our understanding of these trends. More research is needed related to how different productivity scoring methods can inform our understanding of the interaction between health and productivity.
Footnotes
Acknowledgments
The authors thank David Anderson, Ph.D. for expert reviews of this manuscript and Jinnet Fowles, Ph.D. for expert reviews of data analysis.
Author Disclosure Statement
Dr. Terry and Dr. Xi disclosed no financial conflicts of interest. This project was funded by the Centers for Disease Control and Prevention (Grant # 1 R01 DP0 00104-03).