
Abstract
Multiple indices are available to measure medication adherence behaviors. Medication adherence measures, however, have rarely been extracted from electronic health records (EHRs) for population-level risk predictions. This study assessed the value of medication adherence indices in improving predictive models of cost and hospitalization. This study included a 2-year retrospective cohort of patients younger than age 65 years with linked EHR and insurance claims data. Three medication adherence measures were calculated: medication regimen complexity index (MRCI), medication possession ratio (MPR), and prescription fill rate (PFR). The authors examined the effects of adding these measures to 3 predictive models of utilization: a demographics model, a conventional model (Charlson index), and an advanced diagnosis-based model. Models were trained using EHR and claims data. The study population had an overall MRCI, MPR, and PFR of 14.6 ± 17.8, .624 ± .310, and .810 ± .270, respectively. Adding MRCI and MPR to the demographic and the morbidity models using claims data improved forecasting of next-year hospitalization substantially (eg, AUC of the demographic model increased from .605 to .656 using MRCI). Nonetheless, such boosting effects were attenuated for the advanced diagnosis-based models. Although EHR models performed inferior to claims models, adding adherence indices improved EHR model performances at a larger scale (eg, adding MRCI increased AUC by 4.4% for the Charlson model using EHR data compared to 3.8% using claims). This study shows that medication adherence measures can modestly improve EHR- and claims-derived predictive models of cost and hospitalization in non-elderly patients; however, the improvements are minimal for advanced diagnosis-based models.
Background
Medication adherence reflects a patient's behavior in following the prescribed recommendations of health care providers. Low medication adherence can lead to adverse health outcomes and high utilization. 1 Medication factors of adherence, such as treatment complexity and medication history, are commonly available in clinical data sources and have been used to predict the risk of unwanted clinical outcomes, frequent encounters with care providers, and high cost of health care. 1,2
Medication adherence can be measured using medication data collected at various steps of the treatment process ranging from prescribing, to dispensing, and refilling of the medication. 3 For example, medication regimen complexity index (MRCI) uses prescription information 4 to calculate medication adherence, while medication possession ratio (MPR) targets medication dispense and refill information. 5 Prescription fill rate (PFR), however, merges all medication information (ie, prescription, dispense, refill) to measure medication adherence. 6 MRCI, MPR, and PFR are calculated using structured patient-level data, 4 –6 have been validated in previous studies as measures of medication complexity and adherence, and have been shown to represent modestly different aspects of medication adherence. 6 –8
Several clinical and administrative data sources can be used to measure medication adherence. Traditionally, administrative claims data (eg, pharmacy claims) have been used to extract medication dispenses and refills (eg, calculating MPR). 5 –8 The wide adoption and increasing maturation of health information systems 9 have led electronic health records (EHRs) to become an alternative source of prescription data for medication adherence measurement (eg, calculating MRCI). 6,10 Despite the availability of medication data sources on a population level, certain measures of medication adherence require more than 1 data source (eg, PFR needs both EHR and claims data 6 –8 ), hence making such measures more appropriate for subpopulations that have all required data sources available simultaneously. 11
Risk stratification enables population health programs to allocate available resources to high-risk and high-need patient populations. Traditionally, risk stratification models have used demographic, diagnostic, and medication data to predict health care cost and utilization. 11 However, risk stratification models have infrequently used medication adherence, which represents a new perspective on patient behavior, for risk prediction. 7,8 For example, patients having a high MRCI (ie, high complexity of medication regimen) or low MPR/PFR (ie, low [re-]filling rates) are prone to develop conditions leading to high health care costs and utilization rates. 11 –13
Previous studies have identified the variation and correlation among MRCI, 14,15 MPR, 16,17 and PFR 6,7 in different morbidity groups. However, constructing such medication adherence profiles requires individually linked EHR and insurance claims data, thus only a few studies have compared the impact of MRCI, MPR, or PFR on predictive models of health care utilization. These studies have been either limited to specific subpopulations, 18,19 or have used a single data source of EHR 20,21 or claims 12,13,22 to construct medication adherence measures.
Federal and statewide value-based policies have propelled health care providers to improve population health management efforts using various health information technologies. 23 Considering the expanded availability of EHR data among health care providers, 9 as well as insurance claims data (eg, integrated delivery networks), providers are increasingly using their unique combination of data sources for population-level risk stratification purposes. 11 Previous studies have compared the value of EHR versus claims data in predicting risk while using common data types such as demographics and diagnoses 11,24 ; however, various medication adherence measures have not been studied as predicting factors of utilization across a large population of patients.
To mitigate the gap in the current literature, the research team measured the value of medication adherence measures in predicting risk using both EHR and claims data. The team first derived predictive models of utilization at different levels of complexity and then evaluated the added values of MRCI, MPR, and PFR indices by adding them to each of the models.
Methods
Data source
This 2-year retrospective cohort study (2012–2013) used data provided by Health Partners, an integrated health care provider and health insurance company located in Bloomington, Minnesota. Health Partners insures 1.8 million beneficiaries and delivers health care services through 1800+ physicians, 8 hospitals, 55 primary care clinics, and 22 urgent care locations.
Study data contained both structured EHR and claims data linked by unique patient identifiers. EHR data contained patient demographic characteristics at their first encounter, outpatient diagnoses as International Classification of Diseases, Ninth Revision, Clinical Modification codes, medication as National Drug Code (NDC), and details of each filled prescription. EHR records of patient encounters that occurred outside of the Health Partner's care network were not accessible for this study, although if claimable, such encounters were represented in the claims data.
Study cohort
The original data included 114,665 patients in EHRs and 97,575 in claims. The study cohort was limited to patients with continuous enrollment with Health Partner's insurance plan in both 2012 and 2013. The aim was to measure outpatient medication adherence; thus, only outpatient records were extracted from EHRs and claims. Those who were missing outpatient visits, absent of outpatient prescriptions in EHRs or prescription filled records in claims, or older than age 65 (because of missing Medicare insurance claims) were excluded from the study sample. After applying the exclusion criteria, the sample size was reduced to 70,054 patients who had both EHR and claims data (Supplementary Fig S1).
Risk adjusters
The researchers aimed to assess multiple medication-derived risk adjusters at the patient level. First, 2 simple measures of medication count were derived. The unique yearly medication (Rx) count of NDCs was calculated for patient claims, EHRs, and the merged data set, respectively. Researchers then adopted the Johns Hopkins Adjusted Clinical Group (ACG) system (version 11) to convert NDCs into one of 62 prescribed medication-defined morbidity groups (RxMGs). 25 RxMGs were created on account of the product active ingredient, route of administration, therapeutic use, and mechanisms of action, and thus, prevent the issues of overcounting the active ingredient, which may arise when using NDCs. 25 The unique number of RxMGs also was calculated for the 3 data streams of EHRs, claims, and both.
Three medication adherence indices (ie, MRCI, MPR, PFR) were calculated using the medication data. MRCI measures the complexity of medication management for patients, containing major characteristics of a prescription. 6 –8 MRCI relies on EHR data and consists of 3 weighted elements of dosage form, dosing frequency, and additional drug administration instructions. 4,6,10 MPR, a common measure of medication adherence using claims data, is generated from drug dispensing records. 5,6 MPR indicates the proportion of times when patients with an adequate amount of medication follow their refill schedule. MPR is calculated as the sum of the days' supply for all fills of a drug divided by the number of days in a particular period. 5 Three MPR markers were created subsequently to indicate good, middle, and poor adherence levels, using thresholds of 0, .5, .8, and 1.0. 5
PFR is developed by mapping the date of a drug prescribed in the EHR to the date of prescription filled in claims in a given time period and averaging overall prescriptions. Thirty-day PFR was calculated to indicate the proportion of prescribed medications filled within 30 days. 6,7 Additional details about the inclusion and exclusion criteria of medications, temporal limits, and exact methodology used to calculate MRCI, MPR, and PFR were published previously. 6
To simulate a real-world setting, such as a provider not having access to claims data for all patients, the researchers extracted relevant predictors for risk modeling based on the underlying data source used for the analysis. 11,24 For example, when training the predictive models using EHR data, only EHR data were used to construct predictors such as diagnosis and MRCI. In contrast, when using claims data for modeling, only claims data were used to extract diagnosis and calculate MPR. And, when both data sources of EHRs and claims were used, then the combination of both underlying data sources were used to extract diagnosis and calculate PFR. 11
Outcomes and predictive models
Three base models were constructed to predict 2 outcomes in 2 temporal patterns using 3 distinctive data sources. Temporal patterns included prospective (ie, predicting next year's outcome) and concurrent (ie, predicting same-year outcome) time frames. Data sources used to train models included insurance claims only, EHR only, and a merged data set of both. Two outcomes included any hospitalization in the year and total annual health care cost (extracted using claims). A binary marker was created for any hospitalization. Annual health care total cost was truncated at the top 1%. 11
To represent a comparable and comprehensive set of utilization outcomes, claims data were used to measure utilization across all model. Claims were used for outcomes because EHR data only include utilization occurring within the provider's network, while claims data contain utilization that has occurred across all health care providers. 11 Additionally, comparing the performance of different models requires predicting the same outcome. 11 The 2012 independent variables were used to explain/predict outcomes in 2012 (concurrent) or 2013 (prospective).
To assess the added value of each medication adherence index, 3 models with increasing levels of complexity (1 to 3) were used. Base model 1 only included patient demographics (age and sex). Base model 2 included patient demographics plus the Charlson index. Seventeen Charlson comorbidity categories were summed up to indicate a weighted individual morbidity score. 26 Base model 3 included a diagnosis-based risk score derived from the ACG System (ACG-Dx score). 25 The ACG-Dx score is comparable to the Charlson index; however, the ACG-Dx score represents a more complex diagnosis-based measure of morbidity. 7,11,25
Statistical analysis
Patients' demographic characteristics, medication, and diagnosis histories in 2012, and annual health care costs and utilization rates in 2012 and 2013 were analyzed. The researchers tested the contribution of MRCI, MPR, 30-day PFR, Rx count, and RxMG count to model predictions by adding them to the 3 base models. Logistic regression was performed to predict the binary outcome of hospitalization, and linear regression was chosen for total cost estimation as a continuous outcome.
Area Under the Curve (AUC) and adjusted R2 (controlling for the number of variables input into the model) were calculated to measure the performance of logistic and linear regressions. The complete data set was split into a 1:1 training and testing set to conduct a 200-time bootstrapping to validate model performance. The statistics of integrated discrimination improvement (IDI) and improved R2 were calculated for the enhanced model in contrast to the corresponding base models to reveal performance improvement. The 95% confidence intervals were derived to accommodate improvement uncertainty based on 200-time bootstrapping results for each measurement statistics (ie, AUC, IDI, R2, improved R2). All statistical analyses were conducted using R version 3.5.1 (R Foundation for Statistical Computing, Vienna, Austria). 27 The Institutional Review Board of Johns Hopkins Bloomberg School of Public Health approved this study.
Results
Population specification
The mean age of study subjects was 38 years, and more than half of them were female (Table 1). Around 4% of the patients were hospitalized in 2012, and the average annual cost was $5600. The unique Rx count per patient, average MRCI, mean MPR, and mean 30-day PFR, calculated using EHR and/or claims data, are shown in Table 1. Twenty-two percent of the patients adhered well (MPR ≥.8) to their prescriptions in 2012.
Baseline Characteristics of the Sample Population (N = 70,054)
EHR, electronic health record; MPR, medication possession ratio; MRCI, medication regimen complexity index; PFR, prescription fill rate at 30 days; Rx, medications; RxMG, ACG-software medication-defined morbidity group; SD, standard deviation.
Base model comparisons
Base model 1 demonstrated the same prediction performance for hospitalization and total cost using EHR or claims as demographic data were the same across both data sources (Table 2). Base model 2 (Charlson index) improved the model performance (AUC: .639 vs. .653, R2: .076 vs. .104; Tables 2 and 3). Base model 3 (ACG-Dx) further increased the predictive power of the models (Tables 2 and 3). Generally, claims-derived base models (except for base model 1) were superior to EHR-derived models in predicting both hospitalization and total cost of care (Figure 1).
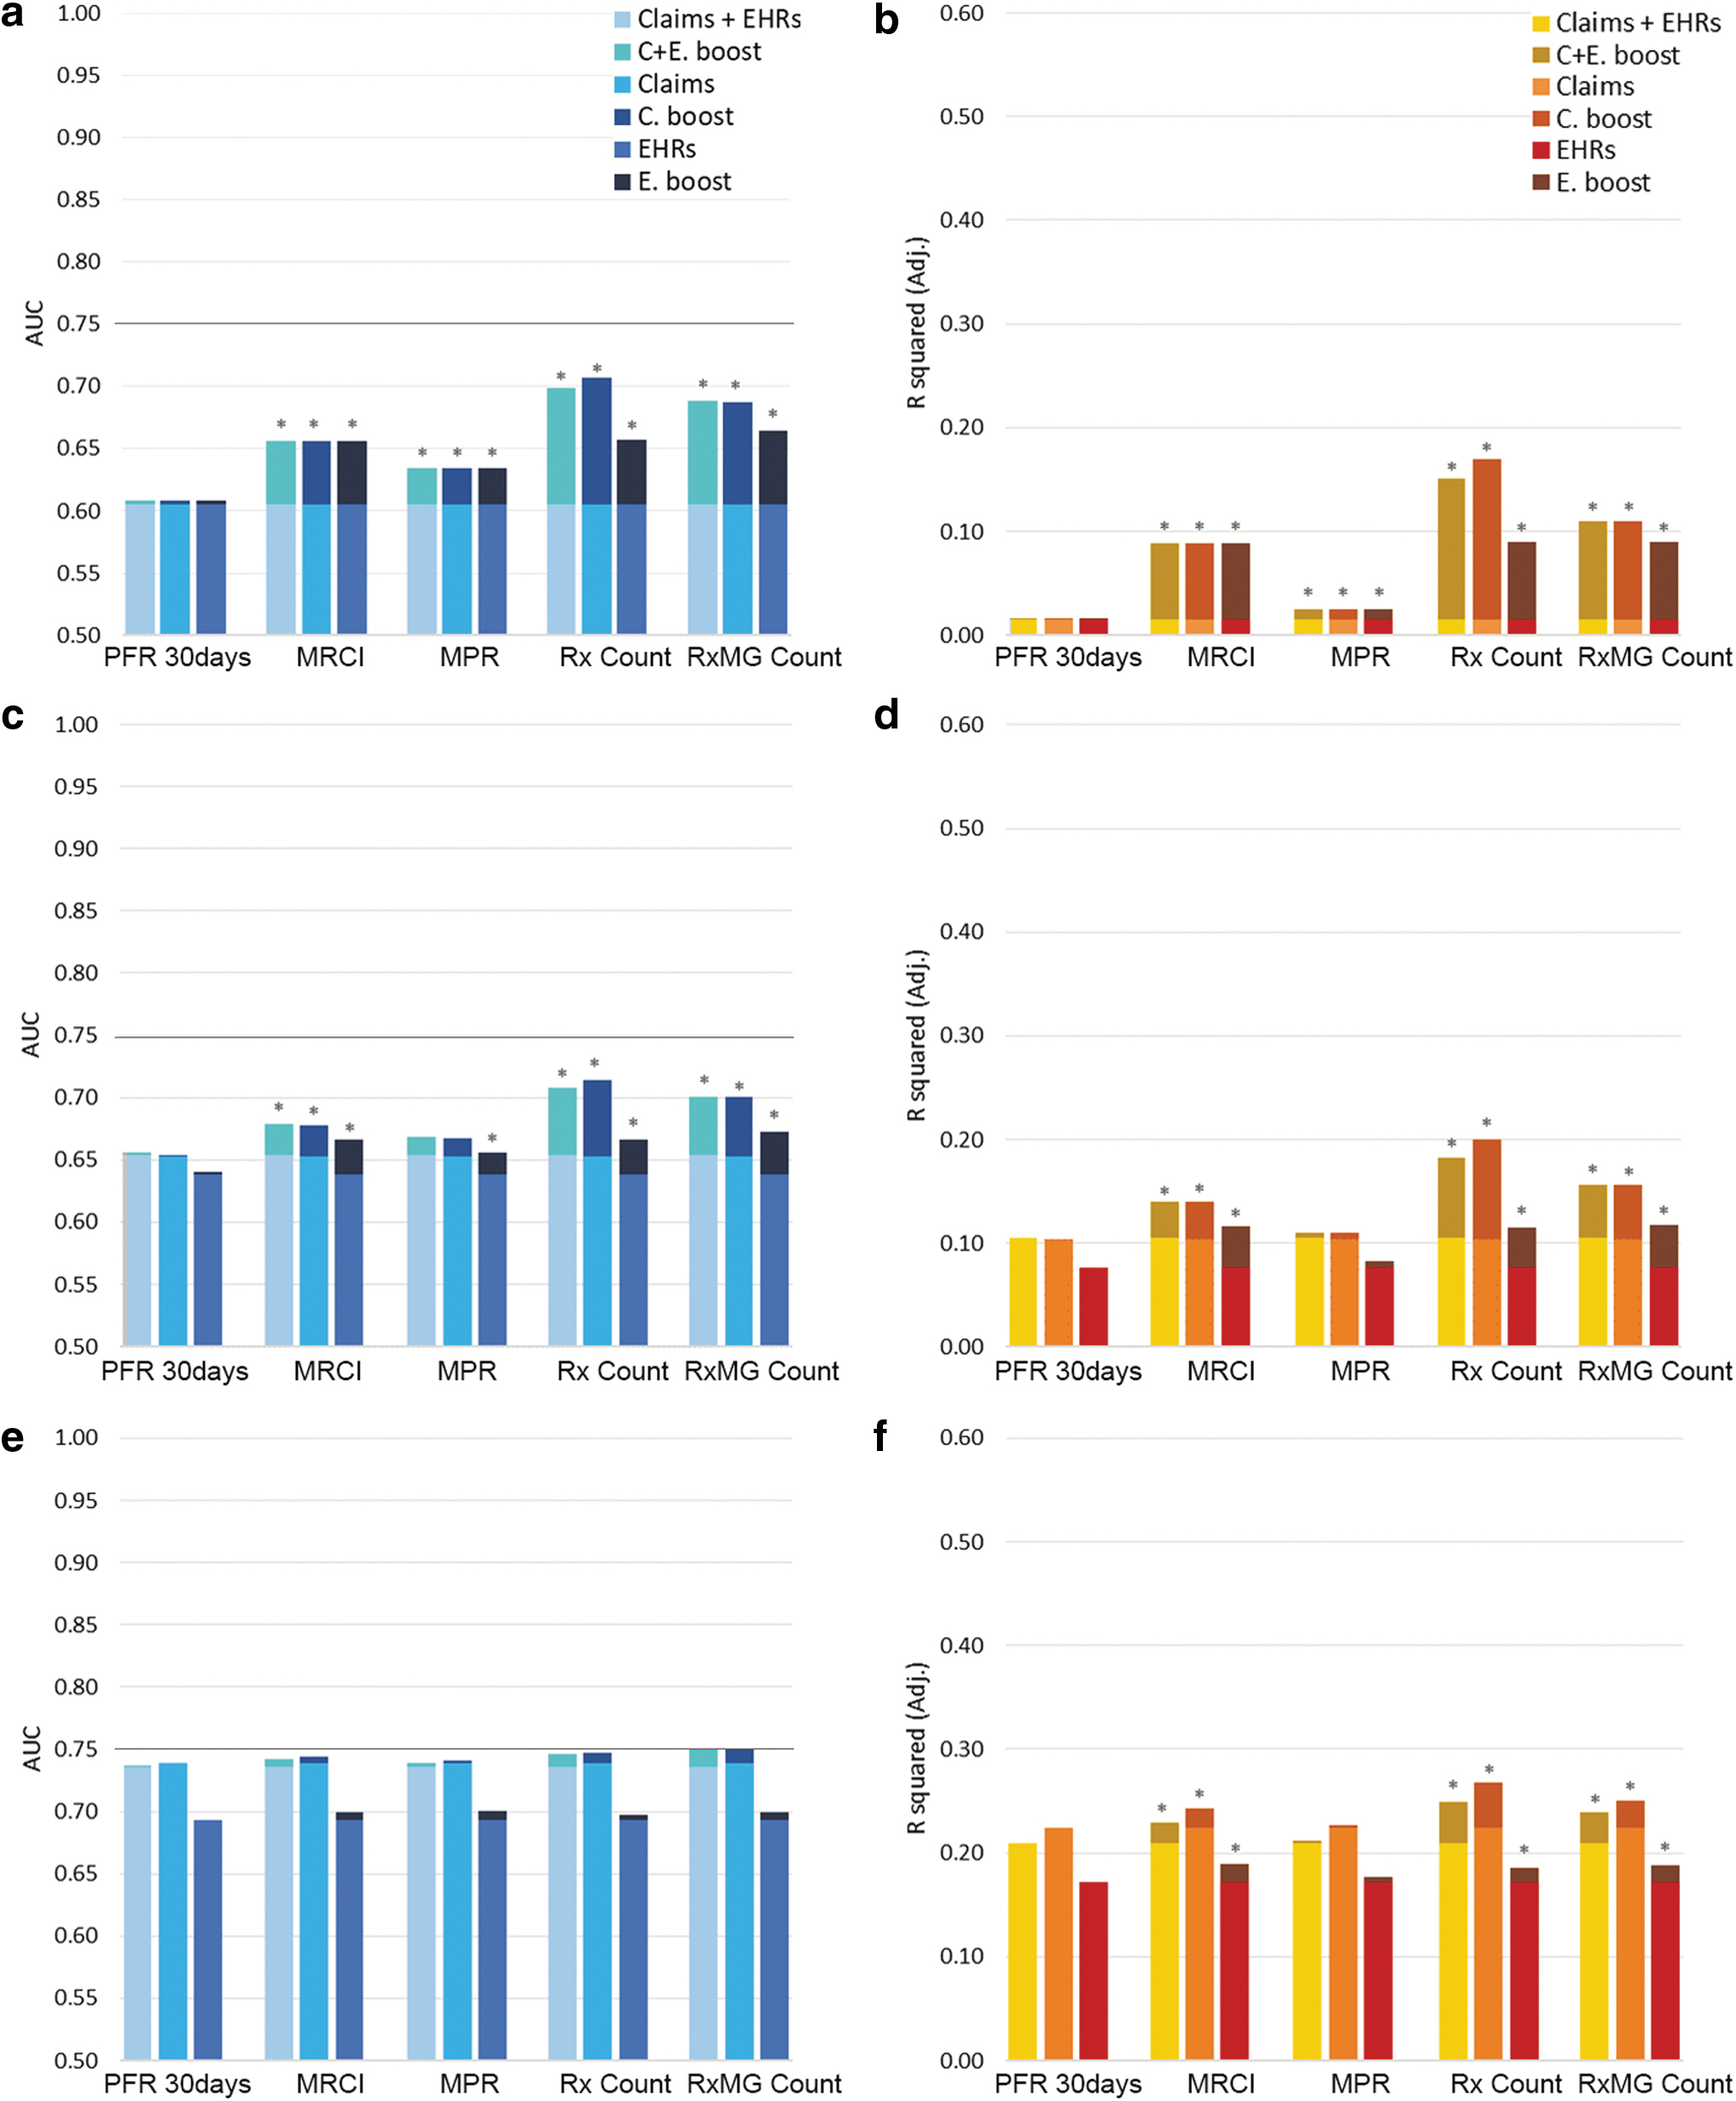
Comparing performance of prospective predictive models of hospitalization (left) and total cost (right) after adding various medication indices:
Added Value of Medication Indices to Claims-Based Prospective Predictions
PFR, Rx count, and RxMG count used both EHRs and claims.
†MPR calculation was based on claims only.
‡MRCI calculation was based on EHR only.
§95% CI was generated using 200 times bootstrapping.
ACG-Dx, ACG-software diagnosis model; AUC, area under the curve; CI, confidence interval; EHR, electronic health record; IDI, integrated discrimination improvement; MPR, medication possession ratio; MRCI, medication regimen complexity index; PFR, prescription fill rate; Rx, medications; RxMG, ACG-software medication-defined morbidity groups.
Added Value of Medication Indices to Electronic Health Records-Based Prospective Predictive Predictions
PFR, Rx count, and RxMG count used both EHRs and claims.
†MPR calculation was based on claims only.
‡MRCI calculation was based on EHR only.
§95% CI was generated using 200 times bootstrapping.
ACG-Dx, ACG-software diagnosis model; AUC, area under the curve; CI, confidence interval; EHR, electronic health record; IDI, integrated discrimination improvement; MPR, medication possession ratio; MRCI, medication regimen complexity index; PFR, prescription fill rate; Rx, medications; RxMG, ACG-software medication-defined morbidity groups.
Medication adherence indices and prospective predictions
When using claims data to predict next year's hospitalization, adding PFR to base model 1 boosted predictions slightly (AUC: .608, IDI: 6.1%), but the enhancement was negligible for the morbidity base models 2 and 3 (Table 2). MPR enhanced base model 1 and base model 2 considerably, but it had minimal impact on base model 3. MRCI improved base model 1 and base model 2 but the improvement was much smaller for base model 3. Rx count and RxMG counts showed larger boosts to all base models including the complex base model 3 (Table 2).
When using claims data to predict next year's total cost (Table 2), PFR or MPR could hardly impact any of the base models (ie, improved-R 2 ranged between .000 and .011). MRCI improved total cost forecasting for all base models with less improvement as the complexity of the model increased (ie, improved-R 2 of .075, .035, and .018 for base models 1, 2 and 3). Adding Rx or RxMG counts improved all base models with improved-R 2 ranging between .026 and .156 (Table 2).
When using EHR data to predict next year's outcomes (Table 3), medication adherence indices improved the performance of base models analogous to claims models; however, the improvements were usually larger than claims models. PFR showed low added values to all base models (ie, IDIs ranging from .3% to 6.1% for hospitalization; and R2 did not improve for cost). MPR showed some value for base models 1 and 2 but minimized improvement for base model 3 (Table 3). Similarly, MRCI improved base models 1 and 2; however, it improved base model 3 minimally. Rx and RxMG counts showed high improvements for all base models (eg, IDIs: 5.2% and 12.0% for base model 3). Using a mix of EHR and claims data to predict prospective outcomes yielded similar results (Figure 1; Supplementary Table S1).
Medication adherence indices and concurrent predictions
Overall, concurrent predictions outperformed prospective predictions (Figure 1; Supplementary Fig S2). In claims-derived models (Supplementary Table S2), PFR performed weakly in predicting hospitalization with the highest IDI at 16.4% across all base models. PFR also did not add any meaningful improvements in predicting total cost (ie, maximum improved-R 2 of .001). MPR performed better in describing the same-year hospitalization after being added to base models 1 (ie, AUC: .683, IDI: 310.2%; Supplementary Table S2) and 2 (ie, AUC: .738, IDI: 31.0%), but added minimally to base model 3 (ie, AUC:.980; IDI:.5%). Adding MPR to base models to predict total cost provided similar results, with base model 1 improving the most and base model 3 improving the least.
MRCI improved concurrent hospital predictions in base models 1 and 2 (ie, IDIs: 759.6% and 39.5%) but not base model 3 (ie, IDI: .6%). MRCI modestly improved concurrent cost predictions (ie, improved R2 ranging from .136 to .032). Rx and RxMG counts showed stronger prediction improvements for concurrent hospitalization and total cost, with base model 3 receiving the least boost (ie, IDI: 1.5% and .4%; improved R2: .062 and .029). Adherence measures of MPR and PFR in the concurrent year were nearly incapable of explaining variances of total cost (Supplementary Table S2).
Comparable to claims-derived models, medication adherence measures modestly improved the performance of EHR-derived models in explaining concurrent outcomes (Supplementary Table S3). But using a mix of EHR and claims data did not result in considerably different model performance improvements after adding the medication adherence indices (Supplementary Tables S1 and S4).
As a robustness check, the research team also explored the added value of medication adherence indices as a combination when added to the predictive models of utilization (ie, adding all 3 indices of MPR, MRCI, and PFR simultaneously to each model). The prediction improvement of the combination of indices was equivalent to the largest boost observed among the individual indices (results not shown), hence not showing any advantage compared to individual indices such as MRCI, which had the best performance improvement among the 3 indices.
Discussion
EHR data are increasingly being used, along with insurance claims, to improve population stratification efforts. 11,24,28 –32 The research team developed risk stratification models based on EHR and claims data of 70,054 patients to examine the added values of various medication adherence indices in predicting hospitalization and annual health care total cost (ie, the same year or the following year). Adherence measures of MPR did not boost model performances considerably, with PFR adding minimal improvements. In contrast, MRCI, Rx count, and RxMG count contributed substantially to model predictions. Overall, medication complexity and adherence indices improved demographic and Charlson morbidity models but did not improve sophisticated ACG-Dx morbidity models.
Model improvement
This study confirmed that MRCI and MPR measures could improve utilization risk stratification models, but their effects require further validation. Consistent with previous studies, 14,33 present study results also demonstrated that MRCI was not as predictive as the simple medication counts (eg, RxMG count). The additional characteristics of prescriptions used to calculate MRCI (eg, dosage of medications) seemed to be overshadowed by the count of medications, which also is used to construct the MRCI index. MPR, a claims-based adherence measure, has traditionally been used for risk stratification purposes 34,35 ; however, the present study showed that additional evidence is needed to explain the value of MPR in predicting cost and utilization on a population level.
In contrast to MRCI and MPR, PFR showed little to no effect in improving the predictive power of any of the base predictive models of hospitalization and cost. In some instances, PFR also degraded the performance of such models. Nonetheless, despite the negative results, PFR provides a unique insight into the actual behavior of patients filling certain prescribed medications but not others. 6,7 Moreover, given the loose correlation between PFR and other medication-derived indices, 6,7 the team considers PFR as a distinctive dimension of medication adherence for population health management efforts. Subsequent studies should consolidate the methods used to measure PFR, and examine the value of a stable PFR index in specific subpopulations who might benefit the most from medication adherence interventions.
Data quality challenges
Both insurance claims and EHR data suffer from data quality challenges. 31,36,37 Missing data and inconsistent terminologies used to code medications may affect the validity of MPR, MRCI, and PFR measures. To address the coding issues, this study was extended to examine if the added value of MRCI or MPR in improving the predictive models of utilization was affected by the underlying mapping of medication terminologies. Using different medication coding terminologies (eg, NDC vs. internal medication IDs) resulted in slightly different improvements in predicting hospitalization and total cost (Supplementary Tables S5 and S6).
Moreover, most studies using MPR and MRCI measures do not clarify the approaches, including mapping terminologies, used to calculate them, which makes it difficult to compare such measures across different populations. 38 For example, MPR values are strongly affected by defining the underlying coding terminology and measuring period associated with refills. 5 Although MRCI seemed to not rely much on the mapping terminology, 4,10 the weights assigned to each MRCI component could drift the score. Weighting the components often requires input from pharmacists to interpret medication instructions, which will increase the variability of measuring MRCI. Future studies should investigate how different terminologies and methods used for calculating medication adherence affect model predictions.
The research team also suspects that issues with coding terminology might have contributed to the minimal impact of PFR on utilization prediction models. PFR index is calculated using both EHR and claims data (ie, prescription data vs. filling data). Given the inconsistencies in encoding medications across EHRs (eg, using internal Rx codes instead of standardized RxNorm codes) and matching them to medication fills listed in claims (eg, NDC codes), PFR may vary depending on the underlying coding terminologies and mapping methods used to construct the index. 6 For example, the team observed the average 30-day PFR of the population at 81% in 2012, a relatively higher proportion compared to other studies (.67–.766–8). However, when repeating PFR calculations for 2013, the proportion dropped to .72 for the same population. The inconsistency of the PFR calculations across years, and the potential impact of terminology mapping issues, can be one of reasons that PFR did not improve predictive models of utilization and cost. 6 –8
Limitations
This study offers novel insight into using medication adherence measures for risk stratification; however, the study has several limitations that require further exploration. First, the findings should not be generalized to all populations. For example, the study excluded older adults because of the unavailability of Medicare claims data. Given the higher number of chronic conditions, more complex medication regimens, and higher rates of utilization among elderly patients, the predictive power of medication adherence indices demands further investigation among Medicare patients. Second, the team had access to only 2 years of data; hence, results may have not revealed the long-term effects of medication nonadherence on health care utilization. Future research should evaluate the temporal changes of medication adherence indices to enrich model forecasting. Third, the team used specific terminologies used to encode medication data and generate MPR, MRCI, and PFR across all populations. Upcoming studies should explore the sensitivity of methods and terminologies used to calculate medication adherence indices on utilization prediction within specific subpopulations that may have different medication adherence trends (eg, having a specific chronic disease, belonging to a unique age group such as the pediatric population). Fourth, linked EHR and claims data were used to calculate medication adherence indices. However, availability of linked EHR and claims data for large populations of patients is limited. 11 Fifth, the team only evaluated the impact of medication adherence indices on predictive models of utilization using the Charlson and ACG-Dx scores. Other studies may evaluate the added value of such indices using other predictive scores of hospitalization and total cost. Sixth, this research does not consider if the change in medication adherence is related to patient incompliance to treatment or improving clinical outcomes and thus not needing the medication anymore. Future research should attempt to distinguish and separate different underlying reasons for changes in medication adherence. Finally, the team only used structured medication data of outpatient settings to calculate MPR, MRCI, and PFR. Future studies should evaluate other aspects of medication adherence (eg, patient, disease, health system-related factors) in other health care settings (eg, inpatient) while using various types of data (eg, unstructured data). For example, adherence information may be stored in unstructured EHR data (eg, clinical notes), hence requiring text mining methods to extract adherence-related factors for target populations (eg, elderly) before calculating an adherence index. 39,40
Conclusion
Medication complexity and adherence measures can be used to improve both EHR- and claims-based predictive models of health care utilization; however, the improvements may diminish when using advanced predictive models of utilization. Future research should explore the added value of medication adherence indices in improving utilization prediction in subpopulations benefiting the most from medication adherence interventions.
Footnotes
Authors' Contributions
Drs. Kharrazi and Jung led the study as co-principal investigators. Mr. Richards extracted, prepared, and cross-matched EHR and claims data for analysis. Ms. Ma and Dr. Chang analyzed the data and produced the results. Drs. Kharrazi, Jung, and Chang, and Ms. Ma interpreted the results and developed the discussion points. All authors contributed to the writing of the draft manuscript. Dr. Kharrazi and Ms. Ma formatted and submitted the manuscript for publication.
Author Disclosure Statement
The authors declare that there are no conflicts of interest.
Funding Information
No funding was received for this article.
Supplementary Material
Supplementary Figure S1
Supplementary Figure S2
Supplementary Table S1
Supplementary Table S2
Supplementary Table S3
Supplementary Table S4
Supplementary Table S5
Supplementary Table S6
References
Supplementary Material
Please find the following supplemental material available below.
For Open Access articles published under a Creative Commons License, all supplemental material carries the same license as the article it is associated with.
For non-Open Access articles published, all supplemental material carries a non-exclusive license, and permission requests for re-use of supplemental material or any part of supplemental material shall be sent directly to the copyright owner as specified in the copyright notice associated with the article.