
Abstract
The fast-growing prevalence of Parkinson's disease (PD) creates a heavy burden for society and the health care system. Although different ways to mitigate the economic burden of PD have been discussed in the literature, including several effective treatments, few studies have paid attention to the effect of care rehabilitation (CR) on PD costs over a long-term care period. This study tracked medical expenses, care costs, and total costs of elderly individuals with PD for 3 years based on medical claims data merged with long-term care insurance (LTCI) claims data, and determined whether CR reduced PD costs. Using a retrospective, longitudinal cohort design, 3950 elderly individuals with PD who received LTCI services from April 2014 to March 2017 in Fukuoka Prefecture, Japan were followed. PD costs were compared between the CR group and the non-CR group, and a hierarchical linear model was used to examine whether CR was associated with medical expenses, care costs, and total costs. The mean value of total costs in fiscal years 2014, 2015, and 2016 were ¥3,124,944 (US$29,504), ¥3,328,398 (US$31,425), and ¥3,615,892 (US$34,140), respectively. In a hierarchical linear model, CR alone was not associated with medical expenses and care costs; additionally, CR had a positive association with higher total costs. However, the interaction term between CR and baseline care needs level significantly reduced care costs and total costs. That indicates that if older PD patients with higher care needs level receive CR, their care costs and total costs will be reduced. Further research is needed to clarify how CR reduces these patients' costs.
Introduction
Parkinson's disease (PD) is a chronic, progressive neurodegenerative disease characterized by a decline in motor and non-motor function, and it is frequently associated with various complications. 1,2 The number of patients with PD is increasing because of population aging in developed countries; consequently, vast social and medical resources are required, leading to a huge overall economic burden. 3 –5 Many studies have analyzed the direct and indirect costs of PD to estimate its economic burden. 6 –9 One of the conclusions reached is that hospitalization and long-term care costs were the major expenditures in PD direct costs. 5,10 –12 From another point of view, several studies suggested that treatments slowing progression and controlling symptoms could reduce the growing economic burden of PD. 13,14
The efficacy of rehabilitation therapies in the treatment of PD has long been established. 15,16 Currently, PD guidelines in many countries, including Japan, recommended rehabilitation on the same grade as surgery and medications. 17 –19 Interestingly, some studies have pointed out that continuous rehabilitation may delay worsening of the severity of PD. 20 –22 However, no studies have investigated whether continuous rehabilitation therapies affect the costs of PD.
In Japan, patients with chronic diseases such as PD who need long-term care services can receive care rehabilitation (CR) provided by the long-term care insurance (LTCI) system. CR emphasizes living independently and actively socializing by improving physical function, and is characterized by long-term implementation, as opposed to acute rehabilitation provided by the medical insurance system. 23 Nevertheless, research that evaluates the quality of LTCI services has only just begun in Japan, and evidence of the effect of CR is scarce. 24 –26 This study thus aimed to track medical expenses, care costs, and total costs of elderly individuals with PD for 3 years and determine whether CR reduced their medical expenses, care costs, and total costs.
Methods
Data source
Medical claims data and LTCI claims data were obtained from Latter-Stage Elderly Healthcare Insurance (LSEHI) in Fukuoka Prefecture. The population in Fukuoka Prefecture was 5,130,000 (4% of Japan's total population) in 2019, with about 694,000 (13.5%) aged 75 years or older. 27 LSEHI is public insurance in Japan for older residents aged 75 years or older, and those aged 65–74 years with a specified disorder. Medical claims data record all medical services, disease diagnosis information, and medical expenses of health care visits. LTCI claims data consist of long-term care services information and payment from LTCI-certified residents aged 65 years or older, and users aged 40 years or older with a specified disorder. 28
There is an eligibility process to receive LTCI services in Japan. An official assessment program classifies the care needs level depending on the physical and mental status of applicants and decides on the corresponding care services. There are 7 eligibility care needs levels. The 2 lowest levels are classified as “Assistance required” (Levels 1 and 2), in which users often are living independently and require few care services; the remaining 5 levels are classified as “Care required” (Levels 3, 4, and 5), meaning more care services are needed as the level increases. 29
Study design
A retrospective, longitudinal cohort study design was used. Participants were elderly individuals aged 75 years or older and diagnosed with PD between April 2013 and March 2014. The follow-up period was from April 2014 to March 2017.
Participants
First, medical claims data were used to identify individuals diagnosed with PD (International Classification of Diseases, Tenth Revision [ICD-10] code: G20) between April 2013 and March 2014, and who had been prescribed antiparkinsonian agents (medicine category code: 116) at least once during this period. Individuals who lost their insurance status because of death or moving during the follow-up period were excluded.
Next, medical claims data and LTCI claims data were connected to identify patients with PD who used LTCI services every year during the follow-up period, and their care needs level and care costs were examined. Because the assessment program for the care needs level in the Japanese LTCI system reevaluates patients every 6 months, the first care needs level was chosen as the criterion if patients had 2 different care needs level in the same year.
Additionally, individuals who had used CR before the follow-up start day (April 1, 2014) were excluded from the study, as the definition was CR newly starting as of April 1, 2014. Those aged younger than 75 years also were excluded.
Measures
The outcome variables were medical expenses, care costs, and total costs for 3 years from April 2014 to March 2017. Medical expenses comprised outpatient, inpatient, and medication fees.
The independent variable was CR use, with individuals who had used CR at least once in the follow-up period being defined as “1,” and those who never used it as “0.” CR included commuting rehabilitation and home-visit rehabilitation, and was defined by the following codes: (1) CR in home visit nursing care category (service codes and Item numbers: 131501 to 131555) and (2) CR in home visit rehabilitation category (service codes: 14, 16, 64, 66, 86, 87).
Covariates were divided into time level and patient level. Time-level variables included follow-up year (2014, 2015, and 2016), annual hospitalization, and annual outpatient rehabilitation, which changed over time. Annual inpatient rehabilitation also was considered to be a time-level variable; however, it was not included in the models because of its high correlation with annual hospitalization.
Patient-level variables included sex, age, Charlson comorbidity index (CCI), deterioration of care needs level, and baseline care needs level. Following 3 studies in the literature, 30 –32 a categorical variable for CCI was generated as follows: Category 0 (CCI: 0), Category 1 (CCI: 1–2), Category 2 (CCI: 3–4), and Category 3 (CCI: ≥5). To assess if there was care needs level deterioration, the baseline care needs level was subtracted from the level in the third year (2016). This was assigned a “1” if there was deterioration or “0” if not. Baseline care needs levels were classified into 3 categories: Category 0 (Assistance required: level 1–2), Category 1 (Care required: level 3–4), and Category 2 (Care required: level 5–7).
Statistical analysis
Descriptive statistics were used to summarize participants' characteristics. Student and Welch's t tests were applied for continuous variables (age, medical expenses, care costs, and total costs), and Pearson chi-square tests were performed for categorical variables (major PD comorbidity, CCI, deterioration of care needs level, baseline care needs level, hospitalization, inpatient rehabilitation, and outpatient rehabilitation).
To investigate the effect of CR on medical expenses, care costs, and total costs, the research team first confirmed the data distribution. Because medical expenses, care costs, and total costs did not have a Gaussian distribution but showed a heavy right tail, the team conducted a logarithmic transformation. Next, a hierarchical linear model (HLM) was used for the longitudinal time-series data because repeated measures for 3 years are nested in patient characteristics (random effect). That is, the team forecast the effect of CR on medical expenses, care costs, and total costs of elderly individuals with PD with hierarchical data in which time-variant observations (eg, hospitalization every year) for 3 years are measured at Level 1 (Time level) and time-invariant observations (eg, sex, age) at Level 2 (Patient level). This was done because PD is a chronic and progressive disease, so its cost will change over time, and it is greatly affected by PD patients with different characteristics.
Compared to standard pooling regression models, HLM cannot only observe changes of different time, but it also incorporates patient characteristics at a higher level to manage different intercepts and slopes for each patient. HLM (also called a random effects model, multilevel model, or mixed model) is applicable for place-based hierarchical data or temporal hierarchical data. 33 The generic pooling regression model assumes that residuals are independent and normally distributed, and that there are not further correlations (ie, dependence). However, in hierarchical data, the measurements are not independent in each level 2, because repeated measures at level 1 (eg, every year) are nested in level 2 (eg, sex and age). Therefore, these correlations are regarded as unexplained residual variance and divided into 2 (higher level variance between higher level entities and lower level variance within these entities) in HLM. The HLM can be defined as follows. 34
Level 1
Level 2
Where
The research team assumed fixed effects and random intercept effects in this study.
In addition, the team considered the independent variable (CR) as a patient-level factor in this model, because whether someone uses CR depends on patient characteristics, such as baseline care needs level or willingness to improve daily functioning.
Finally, for medical expenses, care costs, and total costs, the team constructed 4 models, respectively. The first model (Null model) examined only the variance of the intercept random effect for outcome variables. The second model (Model 1) expanded the Null model by introducing time-level covariates (follow-up year, annual hospitalization, and annual outpatient rehabilitation). The third model (Model 2) added patient-level variables (sex, age, CCI category, deterioration of care needs level, and baseline care needs level). The full model (Model 3) investigated the regression coefficients and change in variance explained by adding CR.
Several studies have reported that severity of PD or care needs level at baseline may affect subsequent outcomes. 22,25 Therefore, the team confirmed the effect of CR and baseline care needs level on the outcome variable “total costs” using a 2-way analysis of variance (ANOVA) before model.
In all instances, P values were 2-tailed, and the level of significance was set at P < .05. Statistical analyses were performed using Stata Statistical Software: Release 14 (StataCorp LP, College Station, TX).
Ethical issues statement
The claims data used in this study were anonymized. Ethics approval was obtained from the Institutional Review Board of Kyushu University (Clinical Bioethics Committee of the Graduate School of Medical Sciences, Kyushu University).
Results
Participants' sociodemographic characteristics are shown in Table 1. Of the 3950 participants, 498 used CR and 3452 did not. Woman accounted for almost three quarters of the total sample. The proportion of woman in the non-CR group was significantly higher as compared to the CR group. Mean age was 82.3 years. The non-CR group was significantly older than the CR group. Except for dementia and cancer, there were no differences between the CR and non-CR groups in major PD comorbidity. The CR group had a significantly higher rate of cancer and lower rate of dementia than the non-CR group. Regarding CCI, Categories 1 and 2 accounted for about 70% of the total, and there was no significant difference between groups. The mean number of CR months was 15.7 (Table 1).
Characteristics of Study Participants
CCI, Charlson comorbidity index; CR, care rehabilitation; NA, not available; SD, standard deviation.
Compared to baseline, more than 38% of participants had deteriorated care needs level in the third year; this rate was significantly higher in the CR group than in the non-CR group. As for the baseline care needs level, Categories 1 and 2 accounted for about 70% of the total. Compared with the non-CR group, the CR group had a significantly higher rate of Category 0 and lower rates of Categories 1 and 2 (Table 1).
In general, the rate of hospitalization over 3 years ranged from 35% to 40%. The CR group showed significantly more hospitalization and inpatient rehabilitation than the non-CR group. As for outpatient rehabilitation, the overall utilization rate was very low, but still relatively higher in the CR group than in the non-CR group (Table 1).
Mean medical expenses are shown in Table 1. Although the 2 groups (CR and non-CR) also showed the same changes as a whole, there were significantly higher medical expenses in the CR group than in the non-CR group. Moreover, mean care costs increased annually and exceeded medical expenses. The CR group had significantly lower care costs than the non-CR group. The total costs increased from 2014 to 2015, and from 2015 to 2016. Although the total costs of the CR group were lower than those of the non-CR group, there was no significant difference in the third year (Table 1).
ANOVA results revealed significant main effects of CR (F 1, 11844 = 6.20; P = .01) and baseline care needs level (F 2, 11844 = 515.19; P < .01), and a significant effect of the interaction (F 2, 11844 = 22.72; P < .01) on total costs. Figure 1 shows the interactive effect. Compared with the non-CR group, whose total costs increased rapidly, the CR group increased slowly from baseline care needs level onward.
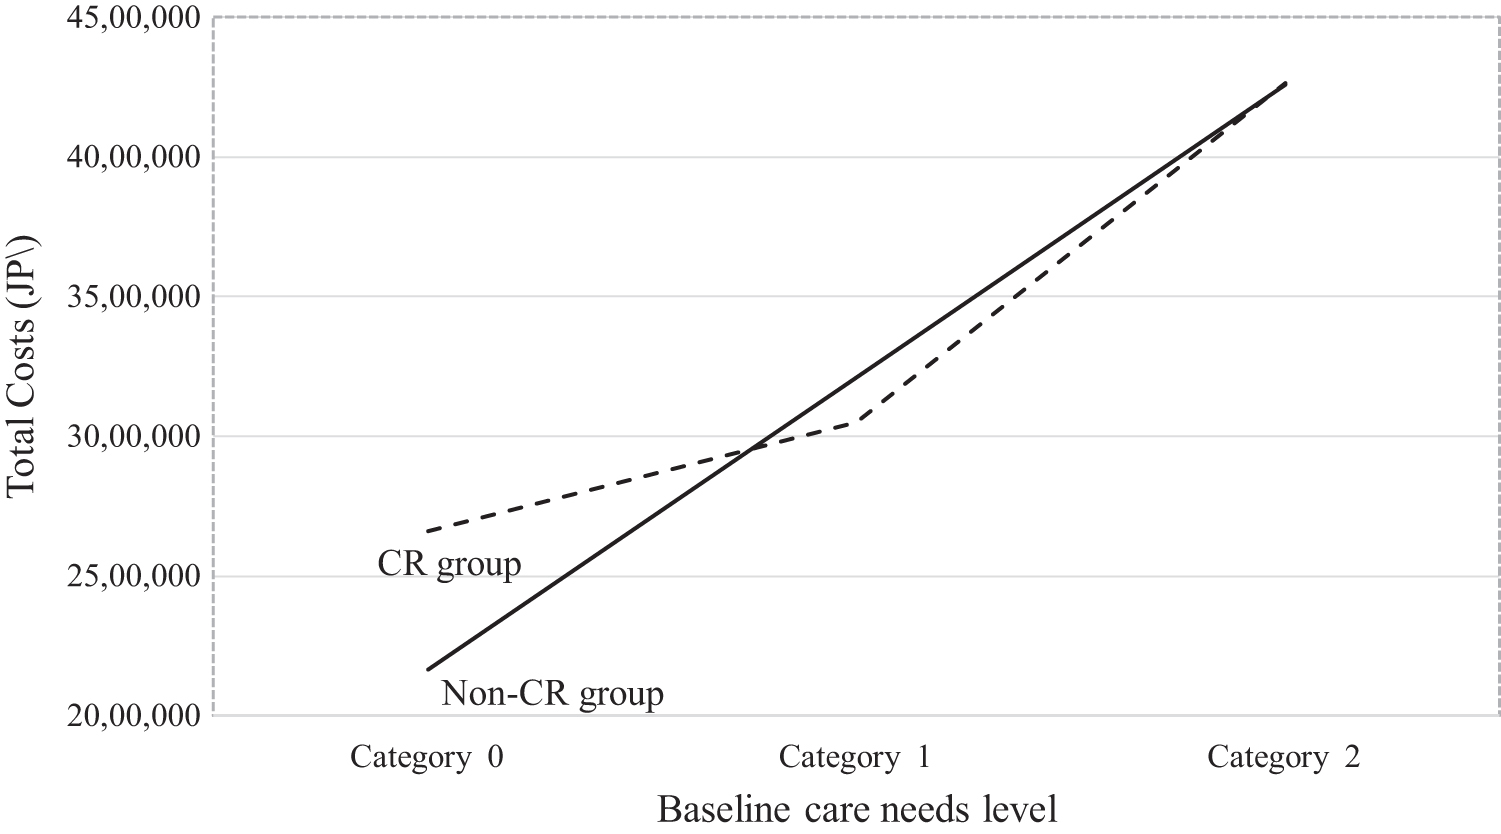
The interactive effect between care rehabilitation and care needs level. CR, care rehabilitation; JP¥, Japanese yen.
Table 2 shows the results for medical expenses for the 4 models. In each model, the variance of random intercept effect for medical expenses was significant. Model 1, which introduced time-level covariates, explained 25.5% of the variance of random effects (PCV = 0.255), the largest amount among the models; followed by Model 2, which added patient-level covariates; and Model 3, which added CR and explained the smallest variance amount. As shown in Model 3, CR and the interaction term between CR and baseline care needs level had no significant effect on medical expenses. Time-level covariates were all significantly associated with medical expenses. In particular, annual hospitalization had the most significant impact (exp(β) = 1.33, 95% CI 1.30–1.36).
Hierarchical Linear Model for Medical Expenses
AIC, Akaike information criterion; BIC, Bayesian information criterion; CCI, Charlson comorbidity index; CI, confidence interval; CR, care rehabilitation; ICC, interclass correlation; PCV, proportional change in variance; Ref., reference; SE, standard error.
exp(
Table 3 shows the results for care costs. The variance of random intercept effect for care costs was significant in all models. Model 2, which introduced patient-level covariates, explained 50.5% of the variance of random effect for care costs, the highest in the 4 models (PCV = 0.505), followed by Model 3, adding CR. Model 1 added time-level covariates and did not explain any variance. In Model 3, although CR was not significant on care costs, the interaction terms, “Category 1 × CR” (exp
Hierarchical Linear Model for Care Costs
AIC, Akaike information criterion; BIC, Bayesian information criterion; CCI, Charlson comorbidity index; CI, confidence interval; CR, care rehabilitation; ICC, interclass correlation; PCV, proportional change in variance; Ref., reference; SE, standard error.
exp(
Table 4 shows the results for total costs. The variance of random intercept effect for total costs was significant in all models. Model 2, which added patient-level variables, explained 45.7% of the variance of random effect for total costs, the highest among all models (PCV = 0.457), followed by Model 1 with time-level variables. Model 3 added CR and explained the smallest amount of variance. CR was significantly associated with higher total costs (exp
Hierarchical Linear Model for Total Costs
AIC, Akaike information criterion; BIC, Bayesian information criterion; CCI, Charlson comorbidity index; CI, confidence interval; CR, care rehabilitation; ICC, interclass correlation; PCV, proportional change in variance; Ref., reference; SE, standard error.
exp(
Discussion
This study tracked the medical expenses and care costs of elderly individuals with PD for 3 years. The total costs increased from ¥3,124,944 (US$29,504) in the first year, to ¥3,328,398 (US$31,425) in the second year, to ¥3,615,892 (US$34,140) in the third year. Some Western studies suggested an average PD cost per person of $20,000–$40,000 (approximately 2–4 million JP Yen), 4,35 and the present study showed a similar trend in Japan to that seen in America and Europe. Additionally, care costs were 1–1.5 times the medical expenses every year and accounted for more than half of total costs. This indicates that, in the cost of PD, care costs exceed medical expenses, accounting for a considerable proportion of the total costs, and continued to increase with deterioration of symptoms.
CR and the interaction between CR and baseline care needs level did not affect medical expenses. It was originally expected that continuous CR for elderly patients could improve their physical function and reduce the risk of falling or complications; thus, hospitalization and medical expenses would decrease. 36 Unfortunately, that scenario was not confirmed in this study.
Although CR did not reduce care costs, the interaction between CR and baseline care needs level was associated with reduced care costs. Compared with non-CR or CR in Category 0 at baseline, CR in Category 1 and Category 2 significantly reduced care costs. In particular, this was most noticeable in Category 1. In general, the upper limit of publicly available LTCI service increases with care needs level deterioration, which leads to a rise in care costs. As shown in Table 3, care costs increased with higher care needs level at baseline or care needs level deterioration. However, as noted in previous studies, exercise consistently shows benefits to motor function and daily living and thus may reduce long-term care service needs. 21,22 Therefore, the research team considers that patients with a higher care needs level can improve their function, even if slightly, through continuous rehabilitation; the effect reflected in cost reduction is greater than in patients with a lower care needs level. In this study, the cost reduction effect of CR in Category 1 was particularly remarkable.
Finally, CR significantly increased total costs. However, as with care costs, when considering the interaction term, the total costs decreased. Compared with non-CR in Category 0, CR in Categories 1 and 2 significantly reduced the total costs. That is clearly shown in Figure 1, in which an interactive effect is demonstrated. At a lower care needs level (Category 0), there is a large gap in total costs between CR and non-CR; however, with the increase in care needs level, both became closer, indicating that CR restrained the increase in costs. As with care costs, CR significantly reduced PD total costs, especially for patients with a higher care needs level.
Another strength of this study is that it confirmed the existence of individual heterogeneity as a random effect in independent variables using a HLM. Compared with annual hospitalization and baseline care needs level, CR has an even smaller but substantial effect on PD cost.
Limitations
This study had several limitations. First, because there was still a disparity between caregivers working in long-term care services in Japan, relying only on the claims data of Fukuoka Prefecture is prone to sample bias when evaluating the overall effect of CR. Second, because there were patients who could not be traced because of death or moving during follow-up, there is a possibility of selective bias. Third, CR was defined as individuals using CR during the follow-up period; thus, a dose-response relationship was not confirmed. Fourth, confounding factors may be present, as 2 comorbidities (dementia and cancer) were not adjusted for; although CCI was used. Fifth, the CR group had a significantly higher rate of Category 0 needs level at baseline and care needs level deterioration in the third year. Because some previous studies indicated that patients with lower (vs. higher) care needs level at baseline display significantly higher subsequent deterioration, 37 –39 it is possible that the difference in results was affected by the lack of unified baseline care needs level.
Conclusions
Based on current circumstances and the present results, this study concluded that continued CR use in elderly PD patients with a higher care needs level can reduce their care costs and total costs. Although the mechanism by which CR may reduce PD costs was not elucidated in this study, one cannot rule out the possibility that CR may provide long-term training or consultation for PD patients with a higher care needs level when they encounter a problem in daily life related to functional decline or deterioration. Thus, without using further care services, these patients may be more likely to have active and independent lives than those without CR support, which ultimately may reduce their total costs. Furthermore, the research team suggests that CR may not only alleviate the economic burden of PD but also can support and facilitate aging in place among patients with PD.
There were 162,000 patients with PD estimated in Japan according to a patient survey in 2017. 40 Moreover, the prevalence of PD in those aged 65 years or older will rise to about 10 times higher on average. 19 Considering the upcoming demographic shifts in Japan, those aged 65 years or older will comprise one third of the population by 203028; thus, reducing the huge economic burden of PD in elderly individuals has undoubtedly become an important issue in the public health system.
Footnotes
Authors' Contributions
Ms. Liu: conception and design, acquisition of data, analysis and interpretation of data, drafting the manuscripts and statistical analysis. Dr. Babazono: conception and design, critical revision of the manuscript for important content, supervision, and administrative and material support. Ms. Kim: acquisition of data. Mr. Li: administrative and material support.
Acknowledgments
We thank the Fukuoka Prefecture Association of Latter-Stage Elderly Healthcare for the provision of health care claims data and long-term care insurance claims data. We also thank Editage for English language editing.
Author Disclosure Statement
The authors declare that there are no conflicts of interest.
Funding Information
No funding was received for this article.