
Abstract
Social determinants of health (SDOH) are the greatest predictors of one's health status. There are clear SDOH disparities present in the United States, many of which have been especially evident during the COVID pandemic. SDOH have become a greater focus of payers, including Centers for Medicare & Medicaid Services (CMS). CMS has updated the reimbursement structure of Medicare and Medicaid to incentivize more SDOH-related interventions. Providers are also growing increasingly attentive to the SDOH needs of their patients, but often are unable to sufficiently address them outside of care settings. The combination of increased SDOH funding with inefficient mechanisms to meet patients' SDOH needs has led to the emergence of the for-profit SDOH industry. The purpose of this paper was to investigate the industry and identify its size, scope, and future implications. The authors conducted an analysis of for-profit SDOH companies using a third-party industry research platform. A collection of 58 companies was identified with $2.4 billion in funding and a total valuation of over $18.5 billion as of July, 2021. Two literature searches were conducted to support strategy recommendations for critically evaluating SDOH outcomes from these companies, and to determine the downstream effects they will have on community-based organizations also working to improve SDOH.
Introduction
Social determinants of health
The majority of one's health status is not determined inside a hospital, but rather by various social determinants of health (SDOH) that impact one's daily life. 1,2 SDOH are the greatest predictors of health outcomes and contribute significantly to preventable mortality. 1,2 Healthy People 2020 defines SDOH across 5 domains: economic stability, education, health and health care, neighborhood and built environment, and social and community context. 1
A 2017 study identified key empirical trends in the United States from 1935 to 2016 that were directly related to SDOH disparities. Although life expectancy increased by almost 10 years from 1950–2015, in 2015 there was a 12-year difference in life expectancy between Asians/Pacific Islanders (87.7 years) and African Americans (75.7 years). 3 Infant mortality rates declined from 1935 to 2015, but in 2015, infants in rural and poor communities–especially those with predominantly African American populations–were 2.3 times more likely to die than those in more urban and affluent communities with predominantly White populations. 3 The study also identified significant disparities in morbidity and mortality from issues including cardiovascular disease, homicide, obesity, and access to health care. 3
The negative effects of SDOH disparities were especially evident throughout the COVID pandemic. Increased COVID morbidity and mortality were associated with conditions such as homelessness, low income status, and increased smoke exposure. 4 The pandemic also exacerbated existing SDOH disparities: closures of schools and businesses resulted in increased levels of food insecurity and income inequality in communities that struggled with these challenges before the onset of the pandemic. 4 Previous respiratory outbreaks saw reduced transmission when SDOH issues were addressed via regular income support, access to testing and health care, and decreased exposure to cigarette smoke. 4 This suggests that more effort to address these and other SDOH issues during the pandemic could have reduced its impact on populations who were often the most impacted. 4
Investments in SDOH have been consistently proven to have a positive effect on health outcomes. A 2016 systematic review of 39 studies that measured the impact of investments in SDOH on health outcomes found that 32 (82%) of the studies reported significant positive effects on health outcomes, cost, or both. Particularly impactful results were identified in investments for housing support, income supplementation, food insecurity, and care coordination. 5
Payers, providers, and SDOH
SDOH have become top priorities for the Centers for Medicare & Medicaid Services (CMS). It is estimated that SDOH now represent between 40% and 50% of the cost structure of Medicare and Medicaid. 6 CMS has released updated payment guidelines for these programs that increase flexibility for interventions that promote value, including those that directly address SDOH. 7,8 For Medicaid, these include a specific Medicaid provision reinforcing a commitment to addressing SDOH, and authorization for states to implement alternative payment models for SDOH interventions, even if they are considered nontraditional. 7 Examples of possible interventions include housing assistance, nonmedical transportation, and employment consultation. 8
For Medicare, SDOH investment and innovation is predominately positioned in the Medicare Advantage (MA) program. Like Medicaid, MA plans are now able to offer expanded access to supplemental benefits that directly address SDOH. Examples of these expanded benefits include those available to Medicaid patients plus in-home care services, food and prescription drug delivery, and more. 9 A study of 17 MA plans representing 65% of MA market membership identified a key prioritization to address SDOH among all plan leaders surveyed. Plans took one of 2 approaches to address SDOH in their member populations: create supplemental benefits internally, or partner with community-based organizations (CBOs) via grant funding and/or external partnership developments. 10
Providers, much like their payer counterparts, have increased their focus on the SDOH of their patients. A survey of 284 hospital leaders found at least 80% were committed to addressing SDOH as a part of their patients' care. 11 Additionally, a study of 917 hospitals found that a total of $2.5 billion dollars of health system funds were invested into SDOH efforts from 2017 to 2019. 12 The majority of these funds went toward initiatives in stable housing and employment assistance. 12 This indicates that health systems are backing up their rhetoric with capital infusions to improve SDOH.
However, providers and health systems face various obstacles when trying to address the SDOH of their patients. Providers have a primary focus on their patients' immediate care needs, and therefore often are not well positioned to coordinate longitudinal strategies that improve the population health of their patients via SDOH interventions. 11 Unlike methodical tracking of clinical and claims data in the electronic health record (EHR), SDOH data are often fragmented or not recorded at all. 2 Companies such as Cerner and Epic have begun to develop tools to capture SDOH data in the EHR, but they do not follow standardized guidelines, which makes acting on these insights increasingly difficult. 2 This also raises concerns about patient autonomy and nonmaleficence, because referrals for SDOH screening can cause patients with multiple social needs to incur additional costs and view their providers more negatively. 13
Several solutions to these issues have been presented. Medical education on SDOH and how future providers can integrate them into daily practice will be a vital way to normalize prioritization of SDOH in medicine. 11 EHR standardization of SDOH tracking and metrics reported is also necessary to better track patient data clinically. 2 For now, there are existing data, predominantly from the US census, that could be added to the EHR to provide a better community profile for patients in a given area. Although these data do not replace individual data, they often are easier to obtain and can help frame a conversation about SDOH between the provider and patient if common SDOH issues in an area are known. 2
Emerging SDOH industry
There is a growing movement to engage sectors outside of acute care settings to improve SDOH via a coordinated effort between a payer, provider, and SDOH-focused organization(s). 13 Historically, these organizations have taken the form of CBOs, which are public and/or nonprofit organizations that represent a community and provide services to people in the community. 14 However, a new industry of private, for-profit companies that primarily address SDOH has been rapidly emerging. These companies generally work with patients covered by Medicare and Medicaid, serving as contracted vendors to help meet the SDOH needs of these populations.
The purpose of this paper is to investigate the industry of for-profit SDOH companies, which will be referred to as the “SDOH industry” or simply the “industry.” Because of its nascent state, there currently are no peer-reviewed papers on the industry, which has made it challenging to quantify its size and scope. It is also more difficult to investigate for-profit companies because they have different requirements and policies of reporting information about their financials and practices in the public domain. This paper will explore the industry's emergence and current status in the United States. This paper will then present a discussion of how these companies can be critically evaluated to determine if their interventions enhance outcomes in the populations they serve. Finally, this paper will present a consideration of the possible effects this industry will have on existing SDOH intervention strategies, most notably those employed by CBOs.
Methods
A search of relevant literature was conducted to identify companies with a core focus of improving SDOH. However, after a comprehensive literature search, no such information was identified. Despite the inability to identify this industry in a traditional manner, the goal was to report on this emerging trend in the peer-reviewed literature in a timely fashion. A subsequent search was conducted for organizations or private companies conducting research on SDOH companies and identified CB Insights (CBI).
CBI is a technology insights platform that researches thousands of companies in established and emerging sectors. CBI analyzes large quantities of data about companies via artificial intelligence-derived machine learning tools to produce answers to strategic questions. These data are ultimately aggregated into CBI's online platform, which was used to complete this portion of the research for this paper. A search was conducted for companies tracked by CBI under the term “social determinants of health,” which when aggregated became the “SDOH industry” collection. After identifying companies based on this search term, analyses of various metrics of companies in the industry were completed, including:
1) Company demographics including location and year founded.
2) Distribution of companies working in different domains of SDOH, or Industry Subsectors.
3) Financial details of these companies, including funding, valuation, and history of equity deals completed in the last 5 years.
4) Media coverage, in the form of non-peer-reviewed articles published over the last 5 years, as a proxy for interest in the industry.
After concluding an analysis of companies in the industry, a literature search was completed to understand how SDOH are evaluated and measured. This was done to help inform strategies to critically evaluate if these companies improve SDOH. This was accomplished by identifying SDOH screening tools in the form of question-based surveys that screen for 1 or more domains of SDOH according to Healthy People 2020. The proposed strategies for evaluating companies were designed based on using available screening tools and the SDOH metrics for which they screen. Finally, a second literature search was completed to determine the impact of the industry on existing CBOs that address the SDOH of their communities.
Results
Data from all tables and figures were acquired by searching for companies under the key phrase “social determinants of health” in the CBI database. 15
Demographics
The search for companies categorized under “social determinants of health” identified 58 private, for-profit companies tracked by CBI. Table 1 displays the geographical distribution of these companies, all of which are located in the US and Canada, as well as the US states with the most companies headquartered in them, as a raw number and percentage of the total number of companies.
Distribution by Geography
Table 2 displays the number of companies founded from 1985 to 2000, and after 2000, 2010, and 2015 as a raw number and percentage of the total number of companies.
Distribution by Year Founded
Subsector distribution
Companies were divided into 5 industry subsectors by core SODH focus. Table 3 displays the distribution of companies in each sub-sector as a raw number and percentage of the total number of companies in the industry.
Distribution by Social Determinants of Health Subsector
SDOH, social determinants of health.
Financial data
Finances for the companies were tracked according to funding received and total valuation. Table 4 displays total funding received by the industry, the number of companies with ≥$10 million and ≥$100 million in funding, and collective funding received by all companies in the 2 funding groups. Table 4 also displays total valuation of companies in the industry, the number of companies with a valuation of ≥$50 million, ≥$100 million, and ≥$1 billion, and collective valuation of all companies in the 3 valuation groups.
Funding and Valuation Data
A considerable amount of funding for companies in the industry is the result of various equity funding deals. Table 5 displays equity funding deals completed for companies in this industry over the last 5 years by number of deals, total funding, average deal size, and median deal size.
Equity Funding Deals 2017–2021
Media coverage
Media coverage of companies in this industry is a way to consider the amount of attention received by the industry. Figure 1 displays the number of non-peer-reviewed (“mass market”) articles published about any of the companies in the industry from 2017 through July, 2021.
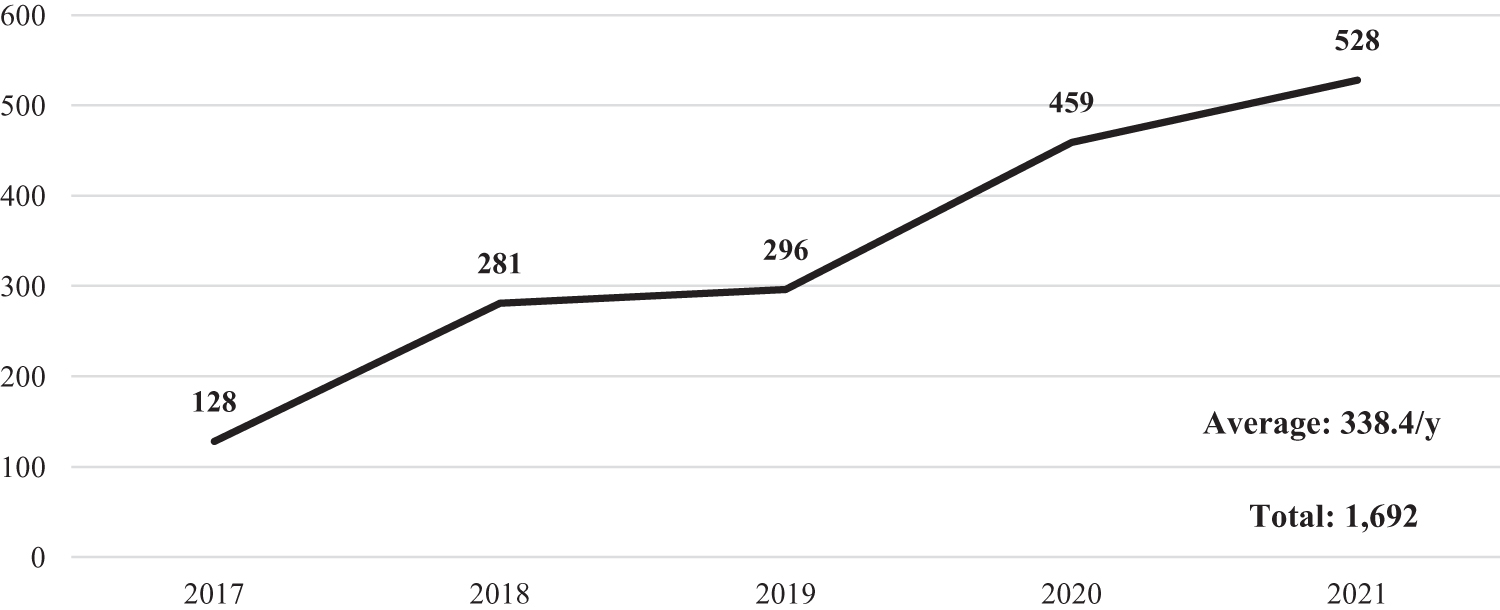
Articles published by year: 2017–July 2021. Figure 1 displays the amount of non-peer-reviewed articles published about the social determinants of health industry from 2017 to July of 2021. This is a line plot graph with the total number of articles published each year (not a running total) above each point on the line. In the bottom right corner, there is an average number of articles published per year and the total number of articles published during the 5-year period.
Discussion
SDOH industry
The majority (56, 96.6%) of the 58 SDOH companies evaluated are located in the United States, with more than half concentrated in 4 states (Table 1). Most (35, 60.3%) of these companies were founded after 2010, with nearly one third founded after 2015 (Table 2). This indicates that although a portion of the industry is greater than 20 years old, it is growing more rapidly now than ever before as payers and providers alike increase their focus on SDOH. 2,6 –13
As the industry emerges, companies continue to specialize to address specific components of SDOH. It is possible these companies structure their focus to the SDOH interventions most supported by new Medicare and Medicaid regulations. The most saturated subsector, home care and general caregiving, is responsible for nearly half (27, 46.6%) of companies in the industry. Despite research heavily supporting outcomes from investments and interventions in food insecurity and care coordination, these sectors represent smaller components of the industry (Table 3). 5,12 There is also evidence of positive outcomes from assistance programs related to housing, employment, and income, yet no companies in this industry were found to address these SDOH areas. 5,12
The $2.4 billion of funding received by companies in the industry is not evenly dispersed. The 7 companies with more than $100 million in funding (12.1% of industry) have 73.5% of total funding, and the 22 companies with more than $10 million in funding (37.9% of industry) have 97.5%. With equity funding deals increasing in average size from $11.6 million in 2019 to $75.7 million in 2021, it remains to be seen if these larger, well-funded companies will continue to accumulate the vast majority of capital injections. This seems likely given the parallel increase in percentage of late stage equity deals (Series D or later) completed in this industry over the same time period. 15 Industry subsectors with the most funding were Value-Based Provider ($1.05 billion), Home care/General Caregiving ($654.1 million), and Community Care Coordination ($466 million). Nearly half of all funding went to companies in the Value-Based Provider subsector while the Home care/General Caregiving subsector, with more than 5 times the number of companies, received just over a quarter of all funding.
Like funding, valuation of the industry, which currently sits at $18.45 billion, is not evenly dispersed. The 5 companies with a valuation of more than $1 billion (8.6% of industry) are responsible for 88% of the total value of the industry, while the 11 companies with a valuation over $100 million (19.0% of industry) are responsible for 96.7%. Industry subsectors with the highest valuations were Value-Based Provider ($10.1 billion), Home care/General Caregiving ($5.87 billion), and Community Care Coordination ($2.34 billion). The smallest subsector, consisting of only 5 companies, is responsible for more than half of the industry's total valuation.
As funding and valuation of the SDOH industry have increased, so has media attention. The number of articles published about companies in the industry has increased every year from 2017 to 2021, including a 15% increase from all of 2020 to the first 7 months of 2021. Additionally, 58.3% of articles published in the last 5 years were published from 2020 to now, indicating that attention to the industry is rapidly increasing.
Measuring SDOH industry success
A 2015 analysis of Medicare pay-for-performance programs argued that although some hospital quality improvements have been identified, the programs themselves do not align payment policy with quality incomes effectively. 16 A paper by a former director of the Center for Medicare and Medicaid Innovation also highlighted various struggles to measure quality improvement and drive cost savings. 17 This suggests CMS still struggles to adequately appraise the quality of hospitals, and therefore also may struggle to determine if interventions employed by companies in the SDOH industry have led to quality improvement.
This is exacerbated by the fact that measuring interventions in SDOH, or simply SDOH themselves, is a difficult endeavor. Most states have individual methods of SDOH collection and analysis, especially in their Medicaid populations. 18 The nascent state of SDOH measurement is similar to the early movement toward measurement and eventual standardization of clinical quality metrics. 18 A 2019 study sought to quantify and describe the number of measurement tools for SDOH in existence. Eighteen distinct tools were identified; 61% of them were developed in 2014 or later. 19 Only 4 of these tools incorporated all SDOH categories described in Healthy People 2020. 19 Metrics most often found in the tools were related to education, economic stability, health care access, and housing. Metrics found least often were related to social/community context, transportation, food/nutrition, and safety. 19 This indicates that although there are numerous tools to measure SDOH, there is little consensus on specific metrics to measure and even less standardization of measurement practices.
Based on this information, the present study authors believe there are 2 strategies to determine if companies in the SDOH industry do or do not improve outcomes. Both involve the use of 1 or multiple SDOH measurement tools. These tools take the form of surveys that are completed by people in a target area. Theoretically, the same individuals could complete a survey tool before a company begins an intervention, and then at various time intervals after the intervention has begun. This allows an investigator to longitudinally track SDOH changes in a given population. The first strategy is to use 1 SDOH tool that broadly measures SDOH across as many domains as possible (eg, food insecurity vs. access to health care vs. built environment). The second strategy is to use 1 or multiple SDOH tools that measure 1 or more domains, but do so specifically (eg, deeper evaluation of food insecurity).
The evidence of company specialization in different industry subsectors presents the option to evaluate companies across different subsectors (including the entire industry) or within the same subsector. To evaluate the entire industry, the first strategy likely would be more successful and provide a higher degree of standardization of evaluation. However, when evaluating a subsector only, the second strategy would be more successful because of the more uniform focus of companies in that subsector. Two examples of SDOH tools that could be useful to implement the first strategy follow.
The Centers for Disease Control and Prevention's Health-Related Quality of Life (HRQoL) tool broadly evaluates the physical and mental health of an individual and/or population over a period of time. This is accomplished by a 4-question survey that evaluates the number of “healthy days” a person has over a 30-day period. 20 This produces a raw number that can be tracked over time. This study is effective because of its brevity and wide scope: because SDOH are the greatest predictors of physical and mental health, they are directly correlated with the number of healthy days one has, and thus one's HRQoL. This tool has been proven effective in various sectors of population health and SDOH research, and has been cited in hundreds of peer-reviewed papers since 1993. 21 It also has been successfully implemented in practice: Humana uses the tool to evaluate changes in SDOH of their MA population as part of their Bold Goal Initiative. 22
The Accountable Health Communities–Health-Related Social Needs (AHC-HRSN) tool broadly evaluates SDOH of an individual or population. This is accomplished by a 10-question survey that assesses the 5 core domains of SDOH as laid out by Healthy People 2020. 23,24 Responses to these questions can be quantified and tracked over time. This tool is effective for the same reasons as the HRQoL tool, but is more specifically tailored to SDOH domains as outlined by Healthy People 2020. This tool was developed and endorsed by an expert panel of government and private-sector leaders, including several from SDOH industry companies. 25 Like the HRQoL tool, the AHC-HRSN tool has been successful in practice: it is estimated that more than 7 million individuals covered by Medicare and Medicaid will be screened with this tool in the next 5 years. 24 CMS also has created a comprehensive guide to help investigators implement this tool in other settings. 26
It is beyond the scope of this paper to consider every possible SDOH tool that could evaluate specific domains that apply to an industry subsector, and thus would be useful to implement the second strategy. However, organizations such as Kaiser Permanente have large databases of SDOH tools tailored to specific domains, as well as an evaluation of each. 23 Investigators interested in evaluating an industry subsector would benefit from databases such as this one to identify a tool that best meets their needs. It is also possible investigators could use only certain questions from the AHC-HRSN screening tool that specifically address the SDOH domain(s) that are the focus of an industry subsector (eg, transportation question[s] for evaluating the nonmedical transportation subsector).
Impact on CBOs
It is difficult to quantify the number of CBOs in the United States, especially those working to address SDOH. However, some information is known about how CBOs form partnerships with payers and providers. These partnerships can be referral based (someone is referred to a CBO for assistance), coordinated (a CBO works with a payer and/or provider to manage the needs of an individual and/or population), or joint-staffed (CBO and a payer/provider create a formal partnered suborganization). 27,28 Successful partnerships have formal agreements in place with goals that are mutually determined. Funding for the CBO to operate comes from multiple sources, including from a payer, provider, government, or philanthropy. 27,28
CBOs have faced serious challenges before the emergence of the SDOH industry. Long-term sustainable funding is hard to secure. 27 –29 Most CBOs are also undercompensated for the services they provide, resulting in revenue gaps that increase with increased patient volume. 27 –29 Additionally, many CBOs are unable to meet data tracking and outcomes measurement requirements enacted by payers and providers, as this infrastructure is expensive and difficult to acquire. 29 This has caused some partnership development between CBOs and payers/providers to lag, because CBOs are unable to secure sufficient funding to implement this technology. 29 Finally, a study of CBOs based in Massachusetts found that many CBOs in the state have been forced to change features of their organizational structure in response to changes in Medicaid policies that integrate health and social services. 30 The qualities that made CBOs distinct from health care organizations are now threatening their potential to earn revenue from Medicaid, which further exacerbates the financial strain these organizations already face.
It is possible that the growth of the SDOH industry could negatively impact CBOs further. The industry, worth nearly $18.5 billion dollars, is well funded and highly valued. Although the industry will depend on payers, providers, and other customers for revenue, their business infrastructure is in place and operational as a result of more than $2.4 billion in funding. CBO funding, however, is multifaceted, episodic, and unstable. CBOs also often struggle to develop and maintain elements of business infrastructure that their customers require. Therefore, customers may find SDOH industry companies to be more attractive partners than CBOs. This may lead to dire financial circumstances for many CBOs, which could be too much for many of them to overcome.
Industry companies are also competitive in nature, which has forced them to consistently innovate and employ the most advanced business infrastructure (especially technology) to do so. They have the ability to process data and track outcomes at levels that CBOs do not. This also allows them to work simultaneously with payers and providers rather than change their fundamental structure to preserve themselves, as some CBOs have been forced to do. 30 However, because SDOH industry companies likely do not have the deep-rooted community relationships cultivated by CBOs, it is unclear whether community members will respond to their interventions as favorably as they might with CBOs.
Strengths and limitations
This paper is the first to identify the industry of for-profit SDOH companies and complete an evaluation of their demographics, scope, financial information, and media coverage. It also offers insights into how payers, providers, and investigators can critically evaluate whether these companies are driving positive SDOH outcomes. The key limitation of this paper rests in the scope of available data. Although the list of SDOH companies identified by CBI is the largest of its kind, it is unknown whether it is an exhaustive list. There are also popular SDOH domains (eg, housing, employment, income assistance) in which companies may exist that are not tracked by CBI. Further research into the SDOH industry is necessary to support a greater understanding of the size, scope, and practices of its companies.
Conclusion
SDOH are the greatest predictors of one's health status. There are clear SDOH disparities present among different populations in the United States, many of which have been especially evident during the COVID pandemic. The combination of increased SDOH funding with inefficient mechanisms to meet patients' SDOH needs has led to the emergence of the for-profit SDOH industry. This industry is composed of at least 58 companies with $2.4 billion in funding and a total valuation of $18.5 billion as of July 2021. We must be extra vigilant of the outcomes measurement for this industry. These companies currently do not face scrutiny in reporting in the same way that for-profit hospitals or organizations that receive CMS funding do. This will require effective evaluation practices using new or existing SDOH measurement strategies and tools. Several questions remain. What will be the leading metric to evaluate the industry? Will the companies face increased government regulation? How will CBOs fare in this new environment? Answers may materialize as the emergence of the for-profit, but socially determined, SDOH industry continues.
Footnotes
Acknowledgements
Mr. Goldberg and Dr. Nash would like to thank the team at CB Insights for their hard work compiling data on the for-profit companies addressing SDOH. More information about CB Insights can be found at:
Authors' Contributions
Mr. Goldberg and Dr. Nash developed the scope of the paper and outlined sources to be included and specific SDOH industry research to complete using the CB Insights database. Mr. Goldberg reviewed the prevailing literature and completed an analysis of the for-profit SDOH industry data to supplement the rapidly evolving literature. Mr. Goldberg drafted the paper with Dr. Nash's consistent input and revisions. Both authors contributed to the interpretation of sources, review of SDOH industry data, and made critical revisions to the paper.
Author Disclosure Statement
The authors declare that there are no conflicts of interest.
Funding Information
No funding was received for this article. Jefferson College of Population Health purchased access to CB Insights' software platform to acquire data used in this article.