
Abstract
Using segmented linear regression to reanalyze the “best-guess” maximum reported age at death data supplied in Aubrey de Grey's editorial, we find compelling evidence for a breakpoint in the mid-1990s, with a positive slope before the breakpoint and a flat or slightly negative slope after it. This confirmation of our earlier results was also modeled using exponential regression. Both the segmented and exponential models were superior to a simple linear regression, providing a better fit for the data even after taking into account their greater number of parameters. These findings are highly robust to the removal of several points from the data and bolster the existing evidence for a limit to human lifespan. Taken in light of both our original analysis and its confirmation by several independent groups, this latest result provides yet more evidence that human lifespan has reached its limit under the current technological paradigm. However, we cannot discount the possibility that novel innovations could propel human lifespan beyond the limit we have identified, if they can overcome the considerable challenges facing them.
I
First, de Grey says that we selected “only a small subset of the available data.” However, this statement is not true. We were not selective with the GRG data at all, using the entirety of the MRAD values. Later, de Grey also denigrates the GRG data used in our article as being only a few dozen data points; that is true, but this criticism only applies to Extended Data Figure 6 of our article. The two main figures and other five Extended Data figures incorporate a large volume of data from both the Human Mortality Database and the International Database on Longevity, filling >200 separate graphs. “Dozens” is not sufficient to describe the number of plots in our article, much less the number of data points.
Next, drawing on uncited news articles, de Grey implies that we think our results should be accepted on the basis of visual inspection alone. Although it is not clear that de Grey disagrees with us—he concedes that our graphs are “inarguable”—we would like to emphasize that we provided in our article a variety of statistics (such as p-values and r values to accompany calculated regressions) to back up any of our hypotheses prompted by visual inspection of the data. We would also like to add that when evaluating the scientific literature, primacy should be given to the articles under scrutiny and one should be wary of out-of-context quotes. Or should we take as definitive de Grey's earlier comment 3 that our results are “absolutely correct”?
After briefly outlining the shortcomings of the GRG data, de Grey reveals a graph of his “best-guess” MRAD data, consisting of the GRG data, revised using unstated criteria and unsourced information known, apparently, only to de Grey himself; an explicit enumeration of his methodology would be useful for many researchers, so it is a pity that Dr. de Grey did not include it in his article. Furthermore, de Grey expresses his doubts about the points from 1997, 1977, and 1999, calling the first a “once-in-a-century deviation” and the latter two “once-in-multiple-decades deviations” from a putative trend of ever-increasing MRAD. Looking at the plot of “best-guess” MRAD values, de Grey says that they suggest a “very different conclusion” to that of our original article. But do they really? In a word: No.
First, using all of the “best-guess” MRAD data (and performing a segmented regression using the segmented package 4 for the R programming language 5 to avoid any accusations of arbitrarily selecting our breakpoint), a breakpoint was identified in 1997, with a slope before the breakpoint of 0.16 and a slope after the breakpoint of −0.04 (Fig. 1A). These results are essentially the same as those presented in our original article: a breakpoint in the mid-1990s (in fact, within one standard error, 4.88, of our original breakpoint), with an increasing MRAD before the breakpoint and a slightly decreasing MRAD after it.
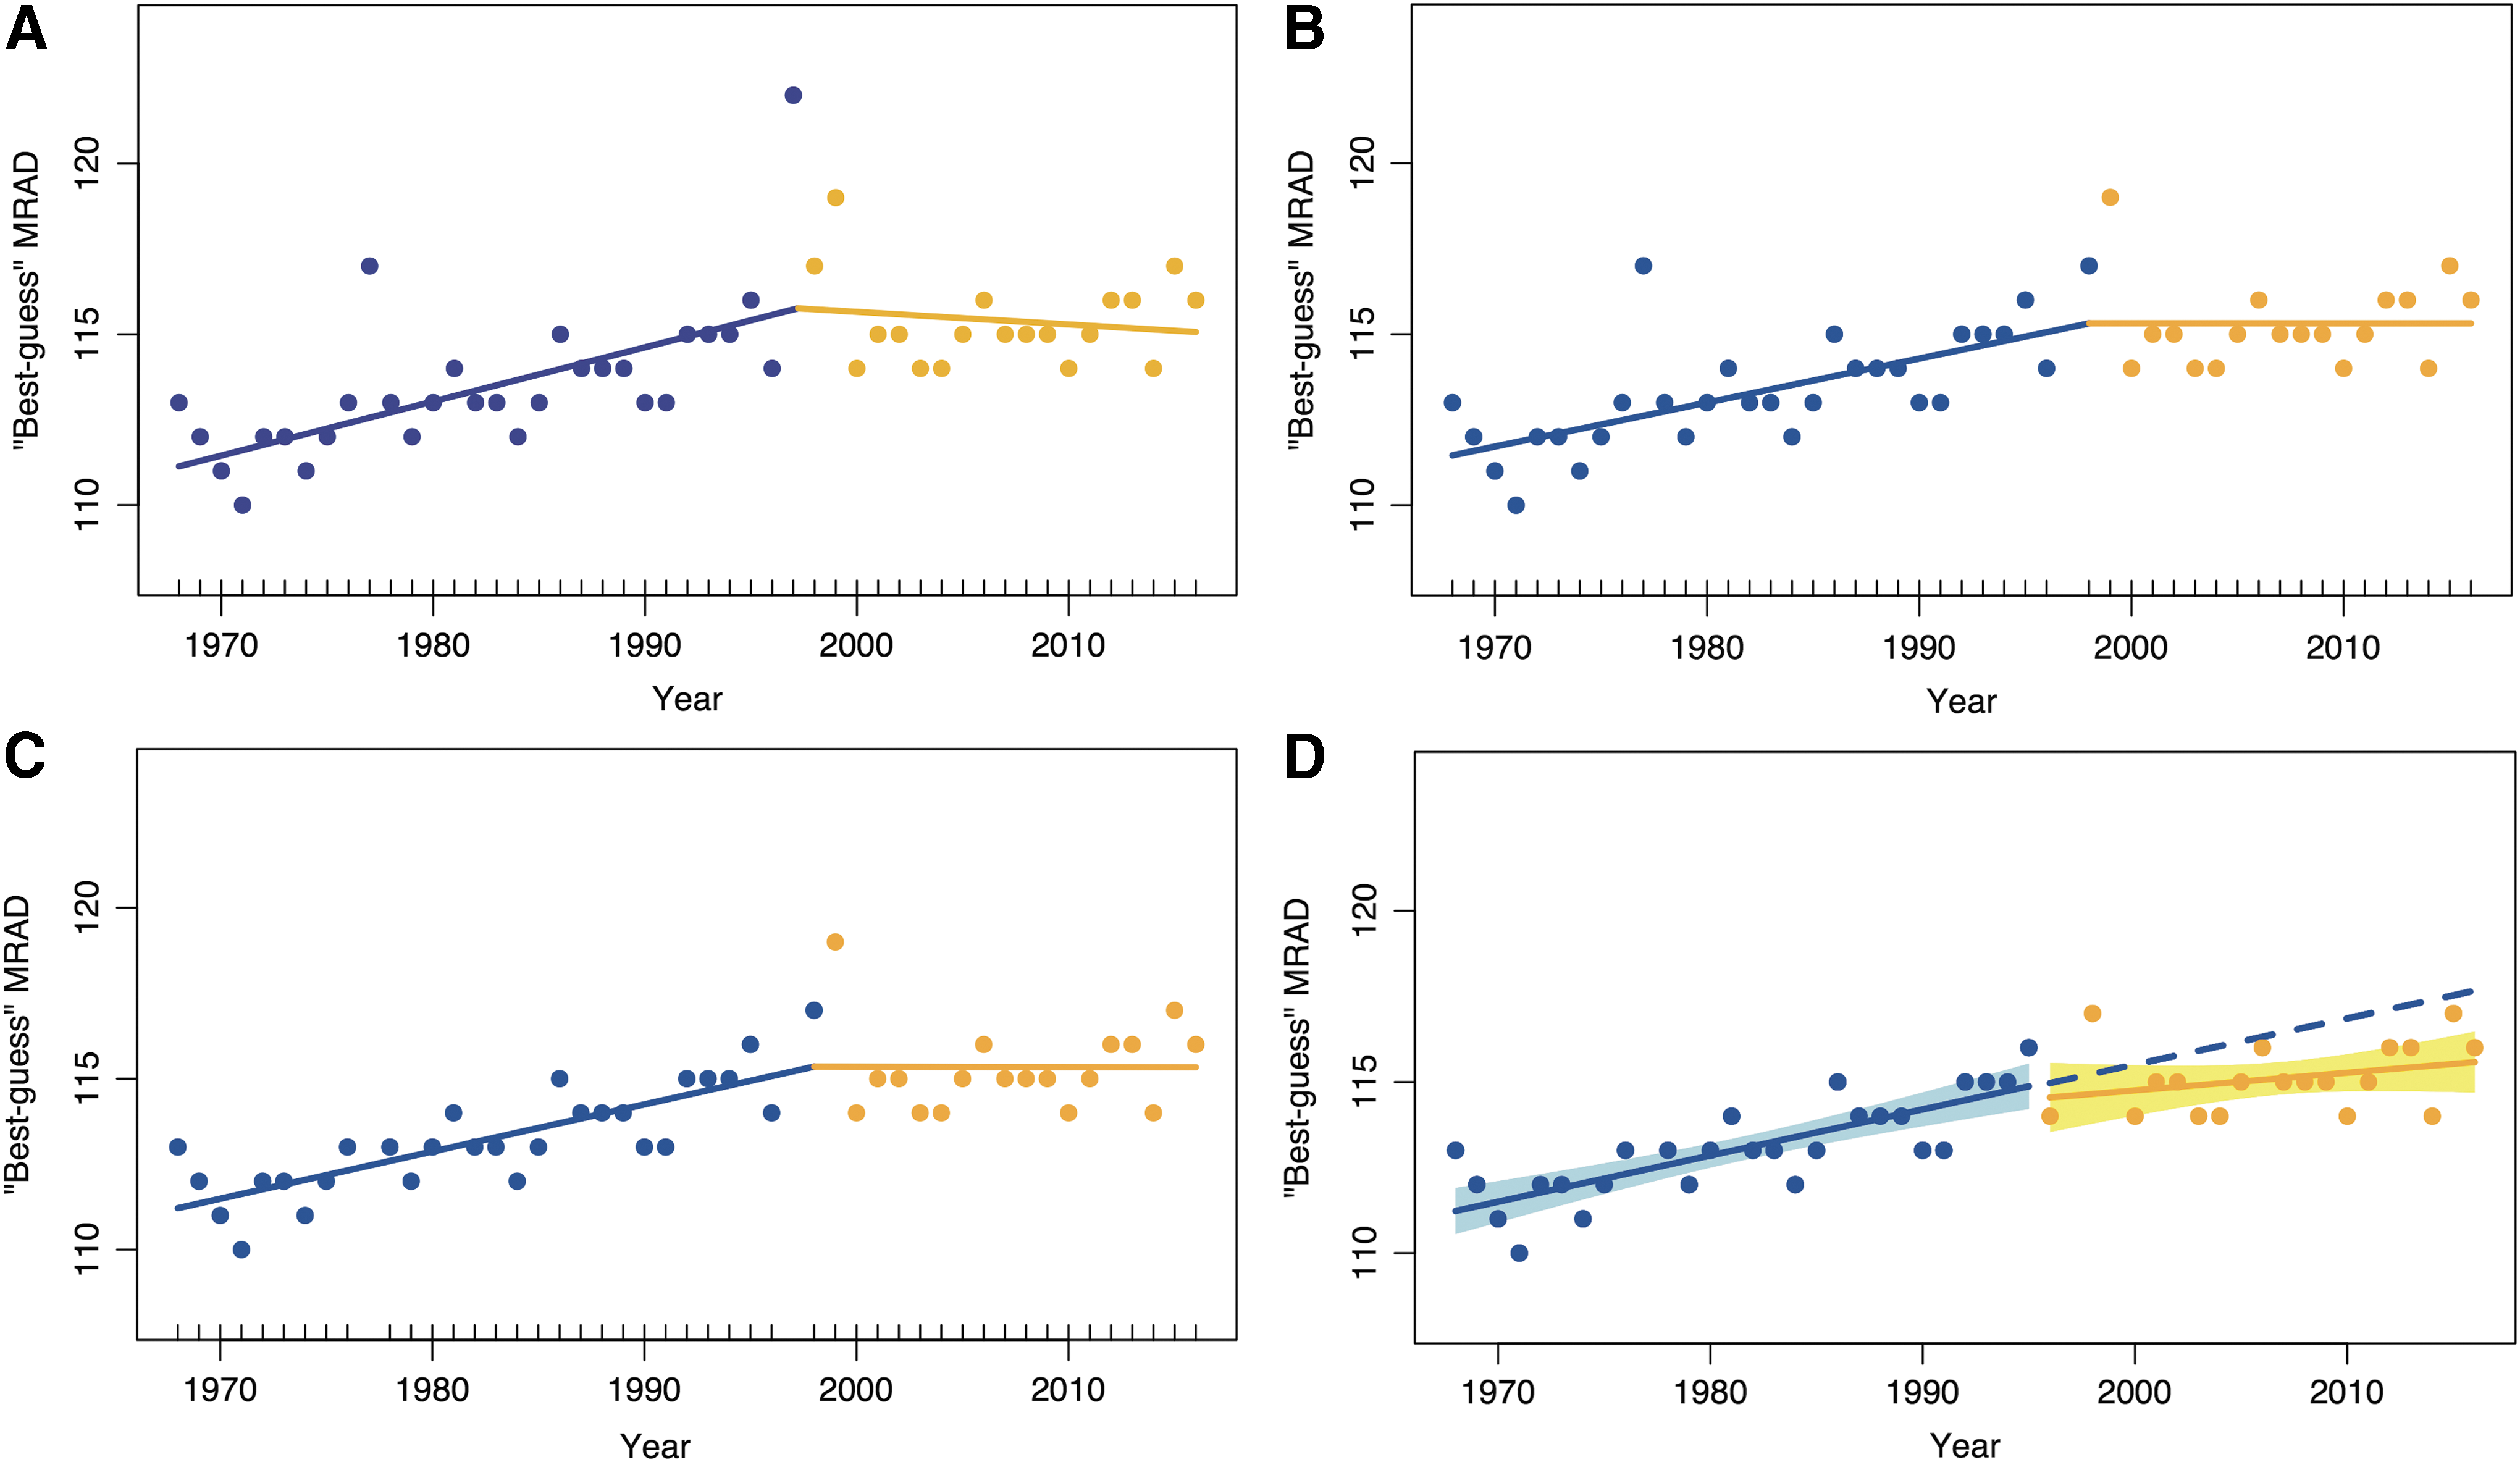
Reanalyses of the “best-guess” MRAD data.
The criteria for further discounting individual data points are unclear. Although the 1997 data point, corresponding to world record holder Jeanne Calment, is considered by many to be exceptional, the 1977 and 1999 data points have attracted far less notoriety. Cook's distance, a measure introduced by R. Dennis Cook to identify influential points in regression studies, 6 does not exceed the threshold of 1, suggested by Cook himself, 7 for any of the data points. Using a lower threshold 8 of 4/n flags the points from 1997 and 1977, but not the point from 1999.
Removing the data point for 1997 and rerunning the segmented regression leads to a breakpoint in 1998, with a slope of 0.126 before the breakpoint and a slope very slightly <0 after the breakpoint (Fig. 1B). Removing the data point for 1977 as well yields almost identical results: a break point in 1998, with a slope of 0.137 before the breakpoint and −0.001 after (Fig. 1C). Finally, if we are to entertain Dr. de Grey's suggestion that, without clear justification, the data point from 1999 should be removed as well, we still arrive at results that are strikingly similar to those presented in our original article. A segmented regression identifies a breakpoint in 1995—the very same year we located the breakpoint in our initial analysis. In each case, the second, flatter segment occurs at around 115 years of age, the limit we identified in our original article.
If we had performed our original analysis using de Grey's data instead of the unrevised GRG data, we would have presented results consisting of a pre-breakpoint increase with slope of 0.135 (r 2 = 0.62, p = 6.7 × 10⁻⁷) and a post-breakpoint slope of 0.052 (r 2 = 0.04, p = 0.20). The much lower slope, much lower r 2 value, and much higher p-value, all indicate that the post-breakpoint trend is not significant and cannot be statistically distinguished from a plateau. The upper end of the 95% confidence interval for the predicted MRAD in 2016 is 115.53, well within the 95% confidence interval (113.1–116.7) we reported in our article. The 95% confidence interval is also sufficiently low and narrow to exclude the possibility that the deviation from the pre-1995 trajectory is due to chance (Fig. 1D). Overall, these results do not come as a surprise. As we have previously explained, our results are not due to an outlier 9 or even several outliers, 10 and the deviation from a continued increase is too large and long lasting to be due to chance. 11
Another way to model the change in MRAD over time is with an exponential regression of the form
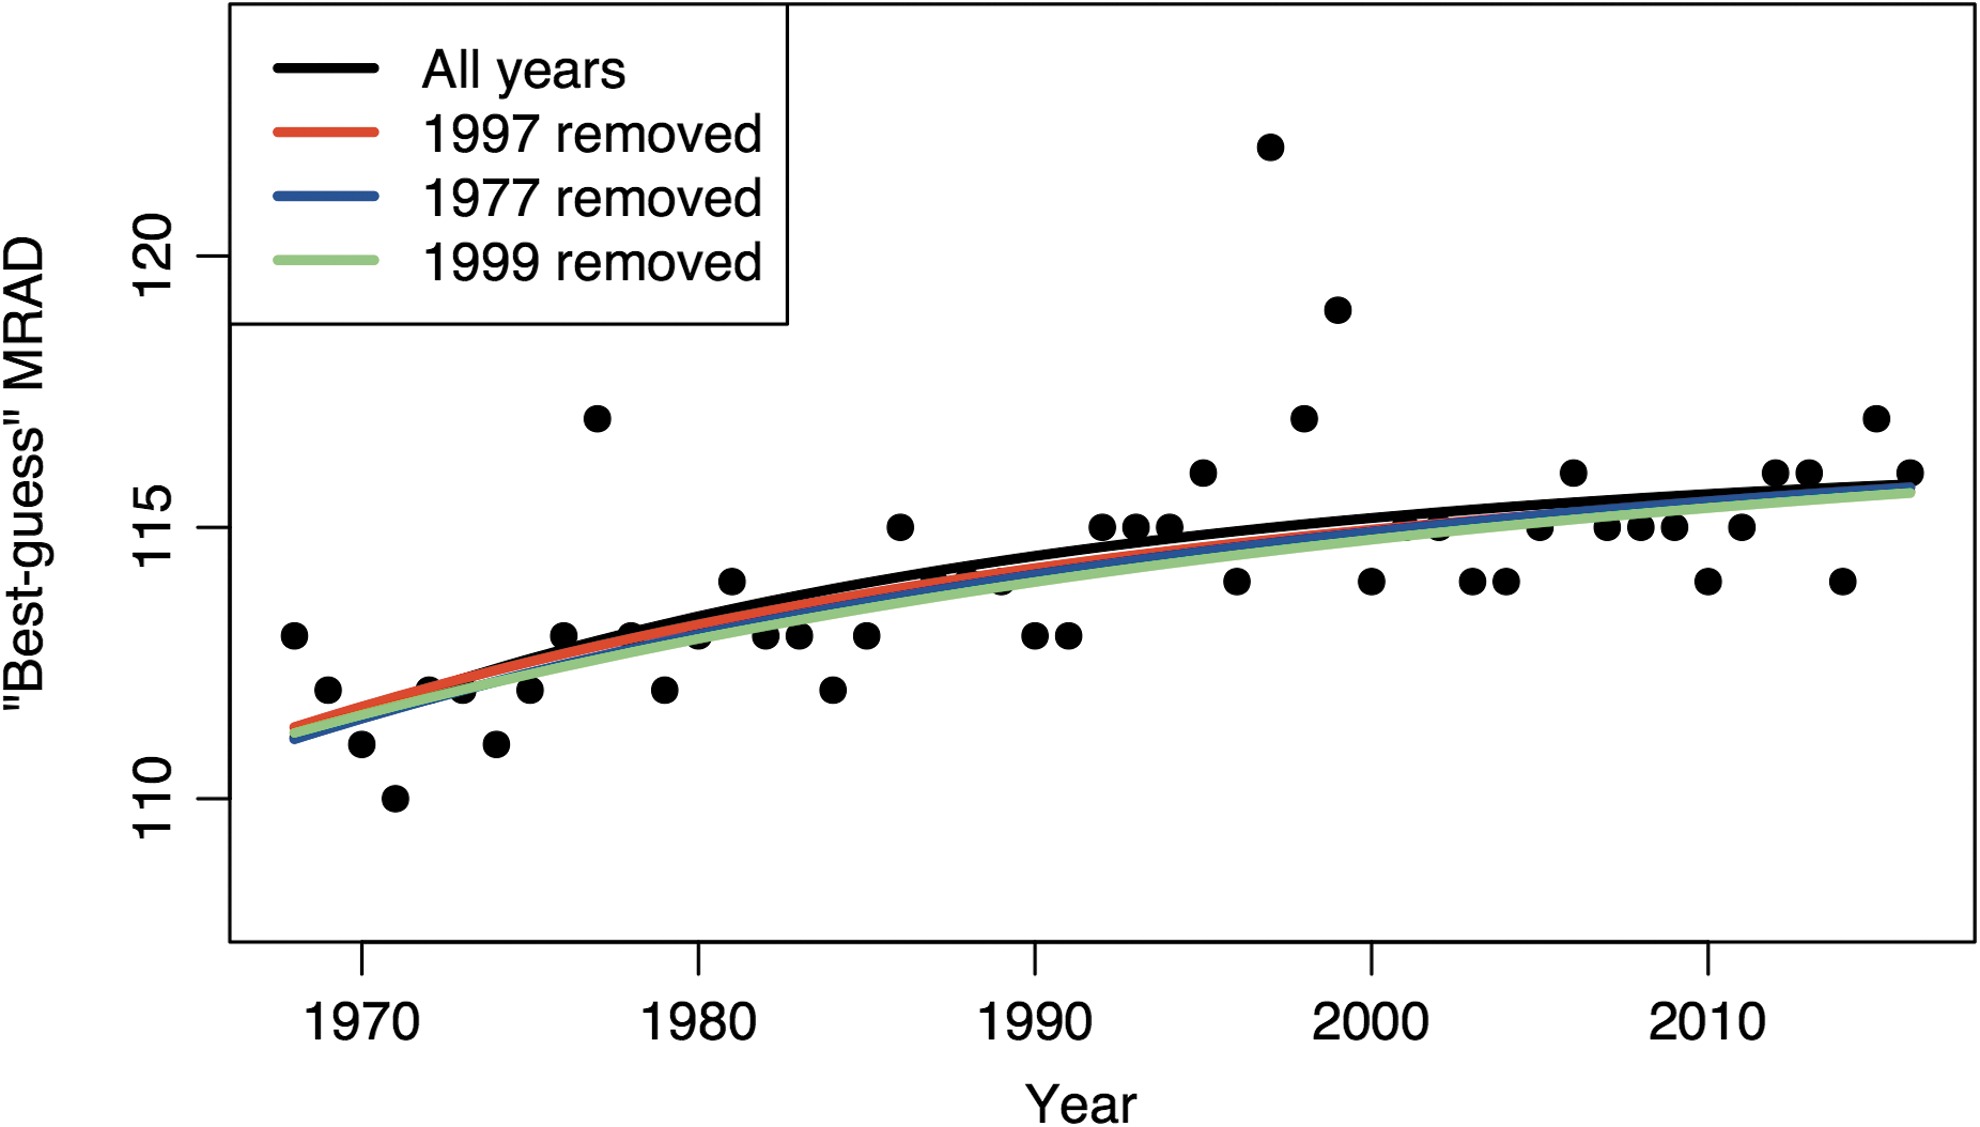
Exponential regression on the “best-guess” MRAD data. Regardless of whether the regression is performed on all the data points or with the points for 1997, 1977, and 1999 successively removed, the curves are almost identical.
The performance of the three models is measured using r 2 and the AIC on four versions of the “best-guess” MRAD data: first, with all of the data points, and then with the points for 1997, 1977, and 1999 successively removed. In each case, the segmented model has the best performance, and the exponential model has the second-best performance. The r 2 is not calculated for the exponential model as it is not an appropriate metric for nonlinear models. The r 2 for the segmented model has been adjusted for the number of parameters; had it not been, the difference between it and the linear model would have been even greater.
AIC, Akaike information criterion; MRAD, maximum reported age at death.
If we count our original analysis in the Nature article and the analyses presented here, they add up to nine separate analyses of the GRG data, and not a single one provides any evidence for a continued increase in the MRAD. At a certain point, we will all have to concede that, no matter how we analyze the data, no matter how we test it, twist it, trim it, or tweak it, the MRAD remains stubbornly stationary. Indeed, many other scientists have come to the same conclusions as us. Analyses using extreme value theory that find a limit to human lifespan within the same range we identified have been performed by three 13 separate 14 groups, 15 and even one of our most vocal critics has, in an article 16 with similar methodology to ours, concluded that centenarian survival has reached a “plateau” and that “the maximum lifespan, measured as the age of the oldest person to die, is currently not increasing.”
Finally, we would like to state that our results were never intended as an attack on antiaging research, merely an indication that the current approach to lifespan extension has run its course. In fact, those who bother to read our two page article in its entirely will see that we conclude it by speculating about the technologies that could extend human lifespan past the limit we found. Instead of blaming the bearers of bad news, researchers interested in extending the human lifespan should appreciate the unvarnished assessment of the challenges ahead and be motivated to create the ground-breaking innovations that will surpass all previous advances.
Footnotes
Acknowledgment
We thank Aubrey de Grey for statistical advice. Code to reproduce the analyses presented here can be found at
Author Disclosure Statement
X.D. and J.V. are cofounders of SingulOmics Corp.