
Abstract
Like most of the sub-Saharan African countries, Ethiopia's economy is heavily dependent on rain-fed agriculture, which is extremely vulnerable to climate-related stresses. The exposure, sensitivity, and adaptive capacity of rural farm households' livelihoods to climate-induced stresses vary across agro-climatic zones, posing a challenge to climate-resilient development strategies. Accordingly, the objective of this study is to analyze the agro-climatic zone-specific vulnerability and responses of rural farm households to climate-induced shocks in the Damot Woyde District of southern Ethiopia. Using a multistage sampling technique, 346 rural farm household heads from two agro-climatic zones participated in the survey. Six focus group discussions, 27 key informant interviews, and personal observations were conducted to supplement survey data. The livelihood vulnerability index was used to assess the level of vulnerability of rural farm households to climate-related stresses. The findings reveal significant differences across agro-climatic zones in major components, indicators, and the three contributing factors to livelihood vulnerability (exposure, sensitivity, and adaptive capacity). Specifically, higher exposure to low adaptive capacity result in high vulnerability in the Kolla agro-climate zone whereas lower exposure with relatively higher adaptive capacity result in lower vulnerability in the Woina Dega agro-climate zone. Farmers adopt a variety of coping techniques to mitigate the negative consequences of climatic extremes, yet some of the response mechanisms, such as selling off livestock and productive assets, cause long-term problems for their livelihoods. These findings imply that developing agro-climate-based resilience-building adaptation strategies is critical for reducing farm households' vulnerability to climate-induced shocks.
Introduction
Climate-related extreme events are adversely disturbing agricultural productivity, which is crucial to millions of rural farmers (Dendir & Simane, 2019). Having the foremost sensitive economic sector in the world, Africa has been recognized as one of the most susceptible continents to the impacts of climate-induced shocks because of multiple stresses and its low adaptation capability (Parry et al., 2007; Serdeczny et al., 2017). The frequency of climate extreme events is likely to jeopardize agricultural production and food security in many African countries (World Bank, 2010). Sub-Saharan Africa will be the most vulnerable region, with crop yields expected to fall by 10 to 20 percent by 2050 as a result of these threats (Lobell et al., 2011; Parry, et al., 2007).
Ethiopia's economy, like that of most sub-Saharan African countries, is heavily reliant on rain-fed agriculture, which is highly sensitive to climate-related stresses (You & Ringler, 2010). The high variability of rainfall, rising temperatures, augmented frequency of drought, floods, pest outbreaks, and diseases are all major challenges for rural farmers who rely heavily on rain-fed agriculture (Tesfaye & Seifu, 2016). The 2019 global climate risk index places Ethiopia 46th among countries most vulnerable to climate hazards (Eckstein et al., 2019). Furthermore, low per capita income, insufficient economic development, inadequate disaster risk administration, and limited institutional and social capability of rural farm households to adapt to climate stresses make them more vulnerable to climatic influences (Chala et al., 2016; Georgis, 2015).
The Wolaita Zone, where the study district is located, is one of Ethiopia's most susceptible and drought-prone places due to its high population density, significant shortage of farmland, extensive environmental degradation, extreme poverty and chronic food crises, and limited livelihood possibilities (Amphune et al., 2018; Gazuma, 2018; Gecho, 2017). However, there is a paucity of thorough studies demonstrating how exposed, sensitive, and capable farming communities are dealing with the adverse impacts of climate extremes. Therefore, determining the local level susceptibility of rural farm households to climate-induced shocks can aid in identifying and prioritizing interventions that could lessen their risk (Islam et al., 2014).
Some empirical studies have assessed vulnerability to extreme climate events in different parts of Ethiopia. For instance, Deressa et al. (2009) used a “vulnerability as expected poverty” approach to develop an index that uses national data to identify the level of vulnerability of small-scale farmers to climate extremes. Some studies, however, such as Tessema and Simane (2019) and Asrat and Simane (2017a, 2017b) have used the Livelihood Vulnerability Index (LVI) and the LVI-International Panel of Climate Change (IPCC) framework to assess smallholder farmers' vulnerability to climate related-impacts in different agro-ecologies. Although these studies have made conceptual and methodological contributions to climate impacts in their study contexts through agro-ecology-focused investigations of farming communities, the majority of them are geographically limited to the Blue Nile Basin and North-West Ethiopia. However, the authors have found no prior agro-climate-specific studies on vulnerability to climate-related impacts and the response of farm households in the study area, with the exception of Amphune (2019) at the zonal level.
Ethiopia is a significantly diverse country in terms of agroecology, socioeconomic structure, climate variability, environmental conditions, agricultural production systems, water resources, and biodiversity (Simane et al., 2016). Thus, aggregate assessments fail to capture the complexities of vulnerability at the agro-ecology level, leading to blanket recommendations. This study aims to analyze and measure the level of vulnerability for rural farm households and their responses from two agro-climatic zones (ACZ) in Damot Woyde District in Wolaita Zone, southern Ethiopia. The findings allow the study district and other similar ACZs to plan and implement agro-climate-specific adaptation strategies and to design effective resilience-building interventions.
Research Methodology
Description of the Study Site
This study was conducted in the Damot Woyde District in Wolaita Zone, southern Ethiopia (Figure 1). Bedessa, the administrative town of Damot Woyde District, is located 335 km south of Addis Ababa and 26 km east of Sodo, the capital town of Wolaita Zone. The district currently has 24 kebeles (Ethiopia's smallest administrative units), covering a total area of 352 square kilometers and a population of 121,478 (Central Statistical Agency, 2020).
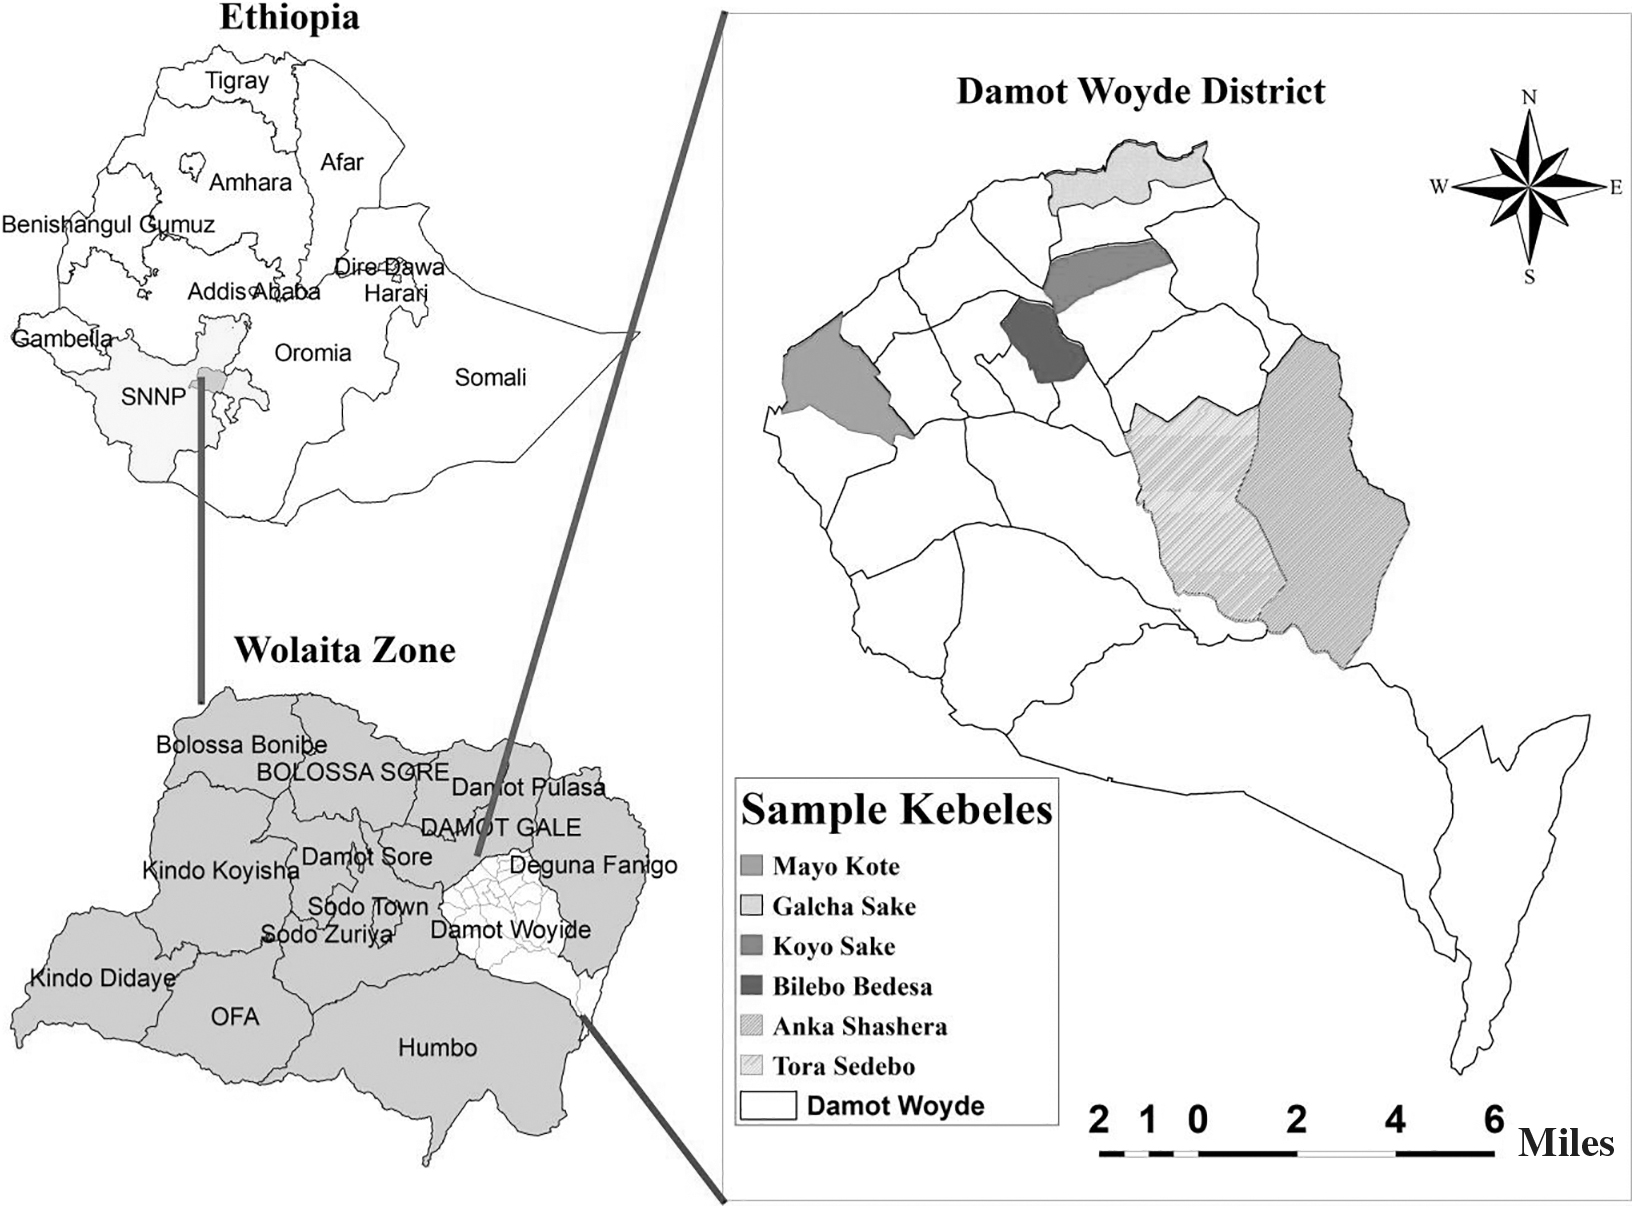
Map of the study area (1 km=0.62 miles)
The study site is distinguished by a bimodal ACZ: Woina Dega (midland) which varies from 1,600 to 2,100 meters above sea level (60% of the district) and Kolla (lowlands), which rises from 1,000 to 1,600 meters above sea level (40% of the district) (Bergene, 2014). Although the amount and intensity of rainfall vary from year to year, Damot Woyde has two main rainy seasons: belg (March-May) and meher (June-October). Woina Dega has a relatively lower average maximum temperature than Kolla ACZ, but a higher average minimum temperature. Kolla ACZ has less annual precipitation than Woina Dega (Table 1). Subsistence agriculture is the dominant source of livelihood, with some non-farms and off-farms as supplements. Enset (Ensete ventricosum), cereals, and root crops are the staple crops in the district (Bergene, 2014).
Average Precipitation and Temperature (1989-2018)
Source: Authors' calculation from National Meteorological Agency of Ethiopia (2022)
masl, meters above sea level.
Research Design and Sampling Techniques
This study used a household-based cross-sectional survey and a quantitative dominant mixed research design. The convergent mixed methods enable the simultaneous collection of qualitative and quantitative data (Creswell & Creswell, 2018). For this investigation, a multistage sampling method was employed. The first step involved selecting the district; the Damot Woyde District was chosen for the study purposely due to the absence of prior agro-climate-specific studies on vulnerability to climate-induced influences and the reaction of farm households in the study area. In the second step, the study district was stratified into two ACZs. In the third step, two kebeles from Kolla (Tora Sadebo and Anka Shashara) and four kebeles from Woina Dega (Mayo Kote, Galcha Sake, Koyo Sake, and Bilbo Bedesa) were chosen at random based on their ACZ proportionality. Finally, in the fourth stage, 346 sample households were selected randomly using the Kothari (2004) sample size determination formula, which is expressed as:
where, z=1.96 (95% confidence interval); p=sampling proportion, 0.5; q=1-p; e=0.05 (5% precision level or margin of error); N=total number of households in selected ACZs (sampling frame)=3,327.
Data Sources and Methods of Collection
To meet the stated objectives, primary and secondary sources of data were employed. The primary data were gathered through a household questionnaire survey that ran from March to May 2022. To supplement and validate the quantitative data, additional data were culled from 27 key informants (KIIs), six focus group discussions (FGDs) with 8 to 12 members at each session, and field observations. KIIs and FGDs were used to gather qualitative data such as participant awareness, perceptions of rural household vulnerability, and responses to climate variability. Important published and unpublished materials, including books, journal articles, websites, papers, and official reports, were used to gather secondary data.
Methods of Data Analysis
The study used both quantitative and qualitative data analysis to analyze the collected data. Indicators representing households' exposure to climate shock, vulnerability, food security, and livelihood situations were quantified and descriptively analyzed using the baseline household survey data. The qualitative data analysis was used to interpret information from FGDs, KIIs, and field observations to capture contextual information about the vulnerability and responses, and it was combined with quantitative results to provide a more comprehensive and contextually detailed picture. Both the IPPC framework method and the composite index approach (Hahn et al., 2009) were utilized to calculate household livelihood vulnerability. Furthermore, independent samples t-test analysis was used to validate the LVI results in the two ACZs.
Computing the Livelihood Vulnerability Index
The LVI developed by Hahn et al. (2009) was used with some indicators replaced to fit the local context in the study area. The LVI in this study employs 12 major components each with its own set of indicators. Based on a review of the literature (Asrat & Simane, 2017b) and consultation with development and extension workers in the study area, the indicators were developed and tailored to the local context. Adger (2007) describes livelihood vulnerability as having economic, political, social, demographic, and institutional dimensions. Accordingly, practical assessments of livelihood vulnerability are highly complex, and their applicability is also context-dependent. Hence, this study focuses on only major components and subcomponents (indicators) that are linked to various livelihood assets at the household level. Table 2 lists several subcomponents chosen for their importance in contributing to each major component.
Vulnerability Contributing Factors, Livelihood Assets, Major Components and Indicators in LVI Analysis
EWS, early warning system; HH, household head; NGO, nongovernmental organization; NR, natural resource; SWC, soil and water conservation; TLU, total livestock unit.
Calculating the LVI: Composite Index Approach
Although each major component of the livelihood assets includes numbers of subcomponents, the study applied a balanced weighted average in which each subcomponent contributes similarly to the total index (Sullivan, 2002). Several equations were employed to standardize the indicators to an index based on the following notions: If an indicator has a direct relationship with vulnerability,
equation (2) was used, and if there was an inverse relationship between an indicator and vulnerability, equation (3) was used.
In Equation 3, IndexSa is the indicator standardized value, Sa is the mean subcomponent for ACZ a, and Smax and Smin are the maximum and minimum values, respectively, for each indicator determined by data from ACZs.
Accordingly, using Equation 4, the subcomponents are averaged to compute the value of each major component:
where Ma=any of the 12 major components for ACZ, indexSai denotes the indicators indexed by i that frame each major component, and k is the number of subcomponnets in each major component.
Finally, after calculating values for each of the 12 major components, they were averaged using Equation 5 to obtain ACZ-level LVI:
This can also be stated in the expanded form as:
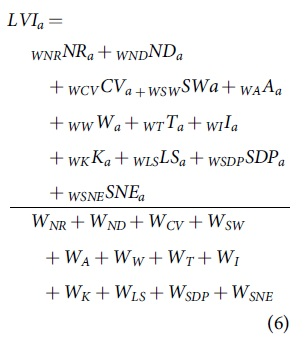
where LVIa, the Livelihood Vulnerability Index of ACZs, matches the weighted mean of the 12 major components. WMi, the weight of each major component, is determined by the number of indicators that form each major component and are incorporated to confirm that all indicators contribute similarly to the whole LVI. In this study, the LVI used a scale ranging from 0 (least vulnerable) to 0.9 (most vulnerable). The Statistical Package for Social Science (SPSS) v-26 and Microsoft Excel were used to analyze quantitative data.
Computing the LVI–IPCC: IPCC Framework
The LVI–IPCC deviates from the LVI when the major components are pooled. Rather than merging the major components to the LVI all at once, they are combined, first according to the labeling pattern using the following equation (Hahn et al., 2009):
where CFa is the IPCC-defined contributing factor: exposure, sensitivity, and adaptive capacity for ACZ; Mai is the major component for ACZ indexed by i; and WMi is the weight of each major component.
After exposure, sensitivity, and adaptive capacity were calculated and the three contributing factors were merged using the following equation (Hahn et al., 2009):
Where LVI–IPCC a is the LVI for ACZ a expressed using the IPCC vulnerability framework, E, S and A are the calculated score of exposure, sensitivity and adaptive capacity respectively for ACZs. The LVI-IPCC scales from least vulnerable (-1) to most vulnerable (+1) and is best understood as an assumption of the relative vulnerability of populations.
Results and Discussion
Major Components and Indicators of the Vulnerability Index
Exposure Major Component
Exposure is the extent and length of climate-related shocks such as a drought or variation in precipitation (Hahn et al., 2009). The IPCC report (Parry et al., 2007) describes exposure as the nature and degree of a system's vulnerability to significant climate variations/natural risks. The exposure category includes three major components from the natural capital group as well as 12 indicators (Table 3).
Exposure LVI With Indexed Major Components and Indicators
Source: Authors' survey, 2022.
Though agriculture is the primary source of income in both ACZs, Kolla households rely more on natural resources, particularly firewood and charcoal from the forest (85.6%), than Woina Dega households (47.8%). Natural resource reliance correlates positively with vulnerability, exacerbating climate variability risks (Asrat & Simane, 2017b). The majority of households in Woina Dega (55.6%) and Kolla (91.4%) reported inconsistency of safe water for humans and livestock. Nonetheless, the Kolla households' severity is very high, resulting in a high exposure score. As an outcome of the two aforementioned indicators, the computed score of the exposure index for the natural resource component indicates that the Kolla ACZ is more exposed (0.885) than Woina Dega (0.517) (Table 3).
Recurring drought, flood, crop and livestock disease, in addition to the lack of an early warning system, are the archetypal extreme climate events that determine farming households' vulnerability in both ACZs. As such, rural farm households in the Kolla ACZ experienced more drought, flood, crop pestilence, and livestock disease (0.625, 0.478, 0.637 and 0.635, respectively) than households in the Woina Dega ACZ (0.442, 0.347, 0.397 and 0.317, respectively) over the last 10 years (Table 3). The independent samples t-test also confirmed a statistically significant distinction between the two ACZs (P<0.001).
Another triggering factor that exacerbates natural disaster shocks in the research area is the lack of early warning. In both ACZs, more than 90 percent of rural farm households did not receive adequate early warning about natural extreme events that could have helped them respond adequately and decrease their vulnerability to a natural disaster. According to the five indicators, the Kolla ACZ has a more advanced vulnerability index of the natural disaster major component (0.666) than the Woina Dega ACZ (0.480) (Table 3).
Climate change and variability, which comprise five subcomponents, is another major factor for increasing exposure. Temperature and rainfall, the two dominant elements of climate, are important determinants of smallholder farmers' exposure to climate shocks (Asrat & Simane, 2017b; Simane et al., 2016). Almost all farm households across both ACZs in the current study experienced rising temperatures and decreasing rainfall over the last decade. Based on farmers' perceptions, the vulnerability index for the climate change and variability component is higher for the Kolla ACZ (0.709) than for the Woina Dega (0.613) (Table 3).
Based on the three major components and their corresponding indicators, the Kolla ACZ is more exposed (0.720) than the Woina Dega (0.542) (see Table 3 and Figure 2 & 3). Even though the Woina Dega ACZ has a low exposure score, it is still in the high vulnerability range, indicating that the agricultural production system in both ACZs is vulnerable. This finding is consistent with those for various parts of Ethiopia (Amare & Simane, 2017a; Asrat & Simane, 2017b; Tessema & Simane, 2019).
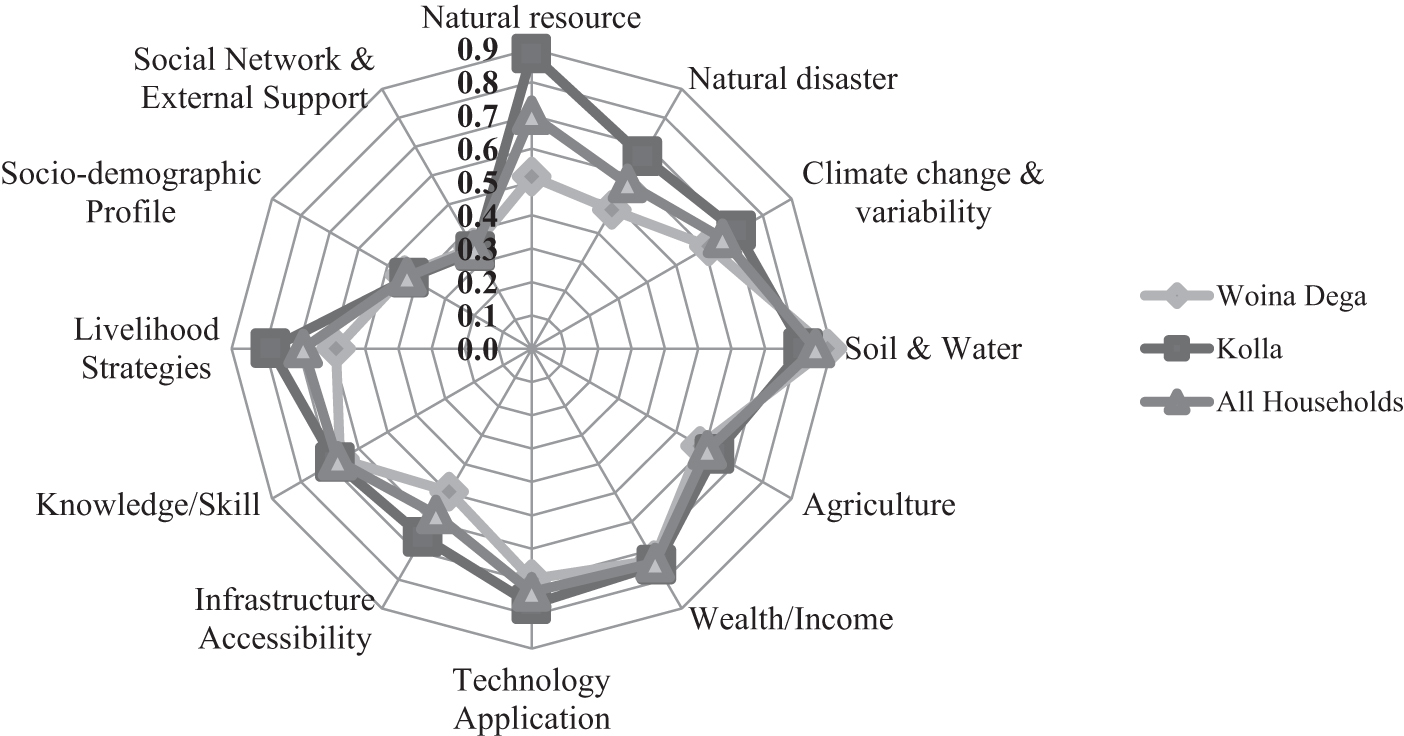
Spider diagram for major components of LVI in two ACZs
LVI-IPCC contributing factors by ACZs
Sensitivity Major Component
The IPCC report (Parry et al., 2007) defines sensitivity as the scope of the impact of climate change stimuli on a system, which can be either negative or positive. Based on this definition, the sensitivity profile includes two major components that fall under the natural capital category, and nine subcomponents (Table 4). Studies show that Wolaita Zone is one of the most degraded and fragmented areas in southern Ethiopia (Esayas et al., 2019; Rhamato, 2007) and is more pronounced in the research area; 97.6 percent of Woina Dega and 83.5 percent of Kolla households reported having infertile soil and can hardly produce without chemical fertilizer.
Sensitivity LVI and Indexed Major Components and Indicators
Source: Authors' survey, 2022.
Due to soil erosion and nutrient depletion, land degradation has emerged as among the most pressing environmental issues in the study site. A major contributor to this problem, as reported by respondents to the survey, is that their farmland is sloping (Woina Dega, 73.9%; Kolla, 57.6%), though the extent of sloping varies. Despite this, 83.6 percent of Woina Dega and 84.9 percent of Kolla households are not continuously practicing soil and water management. Moreover, respondents in both ACZs were not applying any type of irrigation, even traditional irrigation, due to the lack of utilizable water resources, leaving rural farm households reliant on rain-fed agriculture, which is extremely vulnerable to climate-induced shocks. Since soil and water are major components of the LVI scales, both ACZs scored high in sensitivity values for this indicator, though Kolla's ACZ scores (0.815) are slightly less than those of Woina Dega (0.888) (Table 4).
Table 4 shows agriculture as another major component of sensitivity contributing to rural farm households' vulnerability. Using the inverse index value of the total annual product of both ACZs, respondents score a relatively similar indexed value (0.483 for Woina Dega and 0.460 for Kolla). Almost all respondents in the study reported a decrease in agricultural production due to climate extremes. As a result, farm households in both ACZs can meet their food needs from their own production, on average, only five months per year.
Crop diversification is one strategy for reducing climate-related risks in subsistence agriculture. Crop diversification in the Kolla agro-climate, however, is limited to a few crop types when compared to the Woina Dega. Accordingly, the calculated inverse crop diversification indices are 0.376 and 0.571 for the Woina Dega and the Kolla ACZs, respectively. The t-test confirmed the significant difference (P<0.001) between the groups. Furthermore, 67.6 percent of Woina Dega respondents and 74.8 percent of Kolla respondents didn't save crops and seeds for the following season due to their inability to meet their households' food needs (Table 4).
When the five agricultural major component indicators are averaged, the overall index for Kolla households is slightly higher (0.634) than Woina Dega households (0.583). This implies that the Woina Dega ACZ is relatively less vulnerable than the Kolla in terms of the agricultural component. However, given the two major components and their corresponding indicators, the sensitivity assessment reveals a slight difference for the Woina Dega ACZ (0.719) when compared to the Kolla (0.714). This result supports the high sensitivity of both ACZs to climate shocks and stresses (Table 4).
Adaptive Capacity Major Component
The IPCC defines adaptive capacity as a system's ability to adapt to climate change and variability to mitigate potential damages, capitalize on opportunities, and cope with the consequences (Parry et al., 2007). In this study, adaptive capacity is represented by seven major components and 30 indicators (Table 5), which are classified by four types of livelihood capital (human, social, financial, and physical) (Hahn et al., 2009).
Adaptive Capacity LVI and Indexed Major Components and Indicators
Source: Authors' survey, 2022.
This study included review of the wealth variables and found them to be the most influential components of vulnerability for the area, with an average index value of 0.750 in the Kolla and 0.733 in the Woina Dega ACZs (Table 5). For the inversed index values of annual gross income, possession of the productive asset (in birrs, the Ethiopian currency), and percent of households with outstanding loans, the survey suggests that Kolla households (0.824, 0.799, and 0.669) are less adaptable (more vulnerable) than Woina Dega households (0.648, 0.769, and 0.565). Except for the possession of productive assets, the remaining indicators of both ACZs have statistically significant differences (P<0.001). Woina Dega ACZ households are significantly more vulnerable than Kolla in terms of the inversed index value of total livestock holdings (TLU) and farmland size (0.761 and 0.922 vs. 0.648 and 0.808, respectively) (Table 5) because Woina Dega households have 2.18 TLU and 0.41 hectares of farmland compared to Kolla, with 3.2 TLUs and 0.73 hectares, respectively. The difference is statistically significant (P<0.001).
Because of insurance, social safety nets, and entitlement capacity, wealth allows communities to absorb and recover from losses more quickly (Cutter et al., 2012). Rural households that own livestock benefit because they can allocate a significant amount of energy for plow work as well as critical nutrients for soil fertility and crop yields in the form of organic manure. When confronted with climate-induced extremes in agriculture, livestock can serve as a coping mechanism and a source of alternative income (Amare & Simane, 2017). As a result, the greater the number of livestock owned, the better the adaptive capacity of rural farm households. The better-off households thus have a greater ability to cope with and adapt to climate shocks. Indicators of wealth in rural African communities are commonly gauged by the number of livestock owned, the amount of farmland owned, and relatively sufficient income (Kurukulasuriya, 2007).
The qualitative report was derived from FGDs and key interviews, which show that almost all rural farm households in both ACZs are unable to apply farm chemicals (pesticides and herbicides) and access small-scale irrigation. As explained by one interviewee from Kolla ACZs:
Most of the time we cannot afford to access the pesticides, especially [for] those attacking maize crop. Furthermore, our farming system is heavily reliant on rainfall, and the inability to access irrigation exacerbates the climate extreme challenges. Even collecting rainwater is difficult due to the high market cost of constructing water ponds.
Kolla households are more vulnerable than Woina Dega households given their differences in the application of fertilizer and improved seeds. The differences in their indicator scores— Kolla households (34.5% and 72.7%, respectively) and Woina Dega households (14% and 62.3%, respectively) (Table 5)—could be primarily because a relatively high rate of Kolla households didn't apply the fertilizer and improved seed.
While farmers recognize the importance of improved seeds and fertilizers in increasing farm output, most households cannot afford the input costs. The FGDs revealed that, even if the farmers understand the positive impact of fertilizer and improved seeds in their farm products, the cost of these inputs is beyond their capacity. The farmers also stress that they were officially advised to use local seeds (maize) in the 2022 belg (spring) season because the others are difficult to obtain. (Fertilizer prices have increased fourfold between the 2020 and 2022 spring season.) These factors contribute to the poverty of the people and are among the reasons that the farmers remain vulnerable to climate-related risks. With a cumulative mean index value of 0.768, the use of technology as a major component makes Kolla households more vulnerable than Woina Dega households (0.691). (See Table 5 and Figure 2).
Among the major components of adaptive capacity is access to infrastructure, which is comprised of eight indicators (Table 5). This study found that Kolla farmers have less access to the infrastructure indicators (with an average index value of 0.653) than Woina Dega farmers (0.495) (Table 5 and Figure 2). Specifically, Kolla farmers have less access to veterinary centers (P<0.001), markets, schools, and savings and credit services (P<0.05).
Literacy and climate-related capacity-building training can influence farmers' decisions and contribute positively to adaptation strategies that can help reduce the impact of climate change. Countries that have higher rates of education among their farmers generally are thought to have greater adaptive capacity than developing and transitional countries (O'Brien et al., 2004). Among the farmers in the Woina Dega and Kolla ACZs, 66.7 percent and 76.3 percent, respectively, do not have a formal education, and more than 85 percent of farmers in all ACZs had no access to adequate climate-specific training. Furthermore, a relatively large number of Woina Dega farmers reported that they didn't have a good experience when sharing (46.4%) compared to Kolla households (31.7%). Taken together, all three indicators of the knowledge/skill component suggest that Kolla respondents are more vulnerable (0.681) than Woina Dega respondents (0.664) (Table 5 and Figure 2).
It is believed that an overreliance on agriculture as the basis for food and income for subsistence weakens farm households' ability to adjust to climate shocks. The inverse index score of livelihood diversification indicates that the Kolla households (0.567) are more susceptible to climate extremes than Woina Dega farmers (0.367). Furthermore, agriculture is the primary means of subsistence for all Kolla farm households compared to 80.7 percent for Woina Dega. The greater a household's involvement in non-farm/off-farm activities, the better its chance of adjusting to climate shocks that affect agriculture (Asrat & Simane, 2017b). Aggregating the two subcomponents shows that Kolla farmers are more vulnerable in the livelihood component (0.784) than farmers in the Woina Dega agro-climate zone (0.587) (Table 5 and Figure 2).
Farmers that have a higher proportion of adults in the household have a greater potential for sources of labor who can engage in a range of agricultural activities during peak season. This factor may provide a greater potential opportunity for improving households' adaptive capacity to mitigate climate-induced shocks (Simane et al., 2016). It is estimated that the household head's experiences of the farm provide the opportunity to mitigate vulnerability to climate-related impacts by adjusting planting dates, crop types/varieties, and farm management practices (Asrat & Simane, 2017a). Using the four subcomponents of the socio-demographic profile, Woina Dega farmers had a slightly higher vulnerability index (0.441) than Kolla farmers (0.424) (Table 5). This finding is in line with that of (Amphune, 2019), who found that midland farmers were more vulnerable to climate shocks due to sociodemographic factors. However, these findings contradict Amare and Simane (2017), who found that lowland households are highly vulnerable regarding the sociodemographic factors.
Another major component of adaptive capacity is a social networks and external support, which has four indicators. Analysis of these indicators shows that Woina Dega (0.351) is slightly more vulnerable on the social network external support component than Kolla (0.336). Taking the seven major components and their corresponding indicators into account, the adaptive capacity assessment score shows that the Kolla ACZ is more vulnerable (0.623) than the Woina Dega (0.557) (Table 5 and Figure 3).
Overall, the computational data from the 12 major components of LVI included in this study show that the Kolla agro-climate is more vulnerable (0.662) than Woina Dega (0.582) (Table 6). The Kolla ACZ is highly vulnerable to climate-induced shocks in nine of the 12 (75%) major components, except for soil and water, sociodemographic, and social network and external support, as shown in Table 6 and Figure 3.
The Indexed Major Component, Contributing Factors of LVI-IPCC, and the Overall LVI
Source: Authors' survey, 2022.
LVI-IPCC Contributing Factors
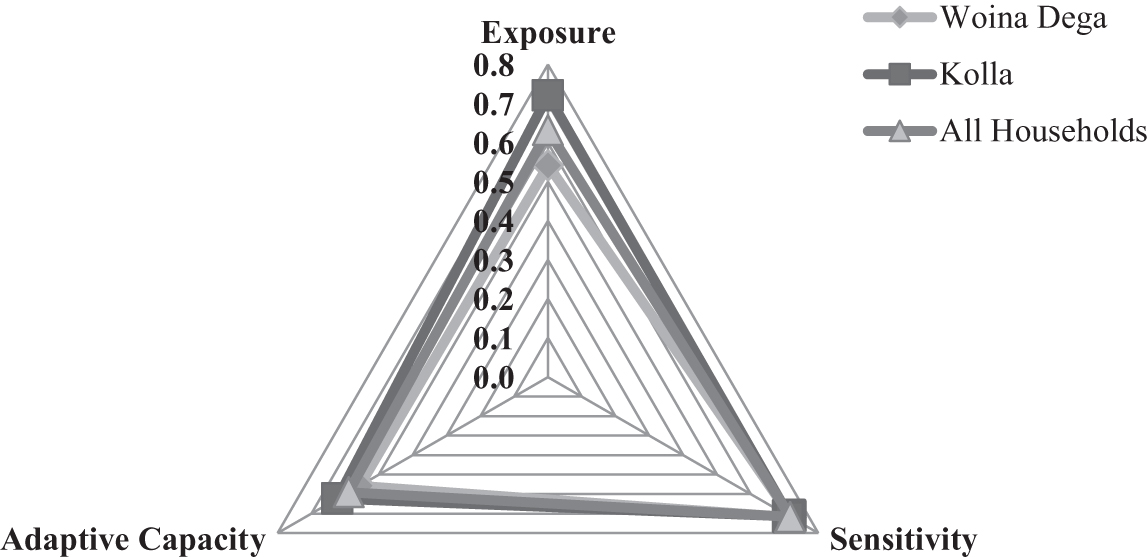
As shown in Figure 3, The three contributing factors to livelihood vulnerability—exposure, sensitivity, and adaptive capacity—are presented across the two ACZs using the LVI-IPCC method (Hahn et al. 2009). The LVI-IPCC scale runs from least vulnerable (-1) to most vulnerable (1), and as shown in the IPCC- LVI equation, large values of exposure comparative to adaptive capacity result in positive vulnerability outcomes, whereas small values of exposure comparative to adaptive capacity result in negative vulnerability outcomes. Since sensitivity is a multiplier, higher sensitivity in an ACZ where exposure outdoes adaptive capacity results in a high LVI-IPCC vulnerability (positive score), whereas high sensitivity in situations where adaptive capacity is greater than exposure results in a lower vulnerability (negative score).
As can be seen from Table 6, the LVI-IPCC contributing factor results show that Kolla farmers have a higher exposure level (0.720) than Woina Dega farmers, who have a score of 0.542. Kolla ACZ households are also quite vulnerable regarding adaptability, with a value of 0.623 versus 0.557 for Woina Dega. However, the relative sensitivity of Kolla farmers is slightly lower (0.714) than that of the Woina Dega household (0.719).
The Kolla ACZ has a positive vulnerability score (0.070) based on IPCC-LVI contributing factors, indicating that it has a higher livelihood vulnerability than farmers in the Woina Dega (-0.011). On the other hand, the Woina Dega ACZ has a negative vulnerability score (-0.011) due to its relatively lower exposure (0.542) and adaptive capacity vulnerability (0.557) compared to the Kolla (Table 6 and Figure 3). This reveals that the overall vulnerability in the Woina Dega ACZ is anticipated to be moderately low when compared to the Kolla ACZ. Although the Woina Dega ACZ is a little more sensitive to shock than the Kolla ACZ, it is seen as moderately less vulnerable to climate shocks and stresses due to its limited exposure and relatively better adaptive capacity.
Major Climate Shocks, Perceived Impacts, and Coping Strategies
Types of Shocks and Perceived Impacts
Respondents from both ACZ farm households stated that frequent drought, unpredictable and irregular rainfall distribution, crop pests, livestock diseases, and floods are serious challenges that impede the livelihood activities of most rural farm households. Figure 4(a) shows that in the last 10 years, approximately 92.8%, 80.3%, 66.5%, and 42.8% of farm households in both ACZs were affected by drought, crop pests, livestock diseases, and floods. Drought frequency increased from time to time in both ACZs, according to the KIIs and FGDs. Respondents also reported that spring rainfall, the primary source of water for the areas' crop production, is rapidly declining—sometimes a whole season goes entirely without rain. This kind of climate-related shock frequently affects the livelihood of rural farm households, increasing their level of poverty.
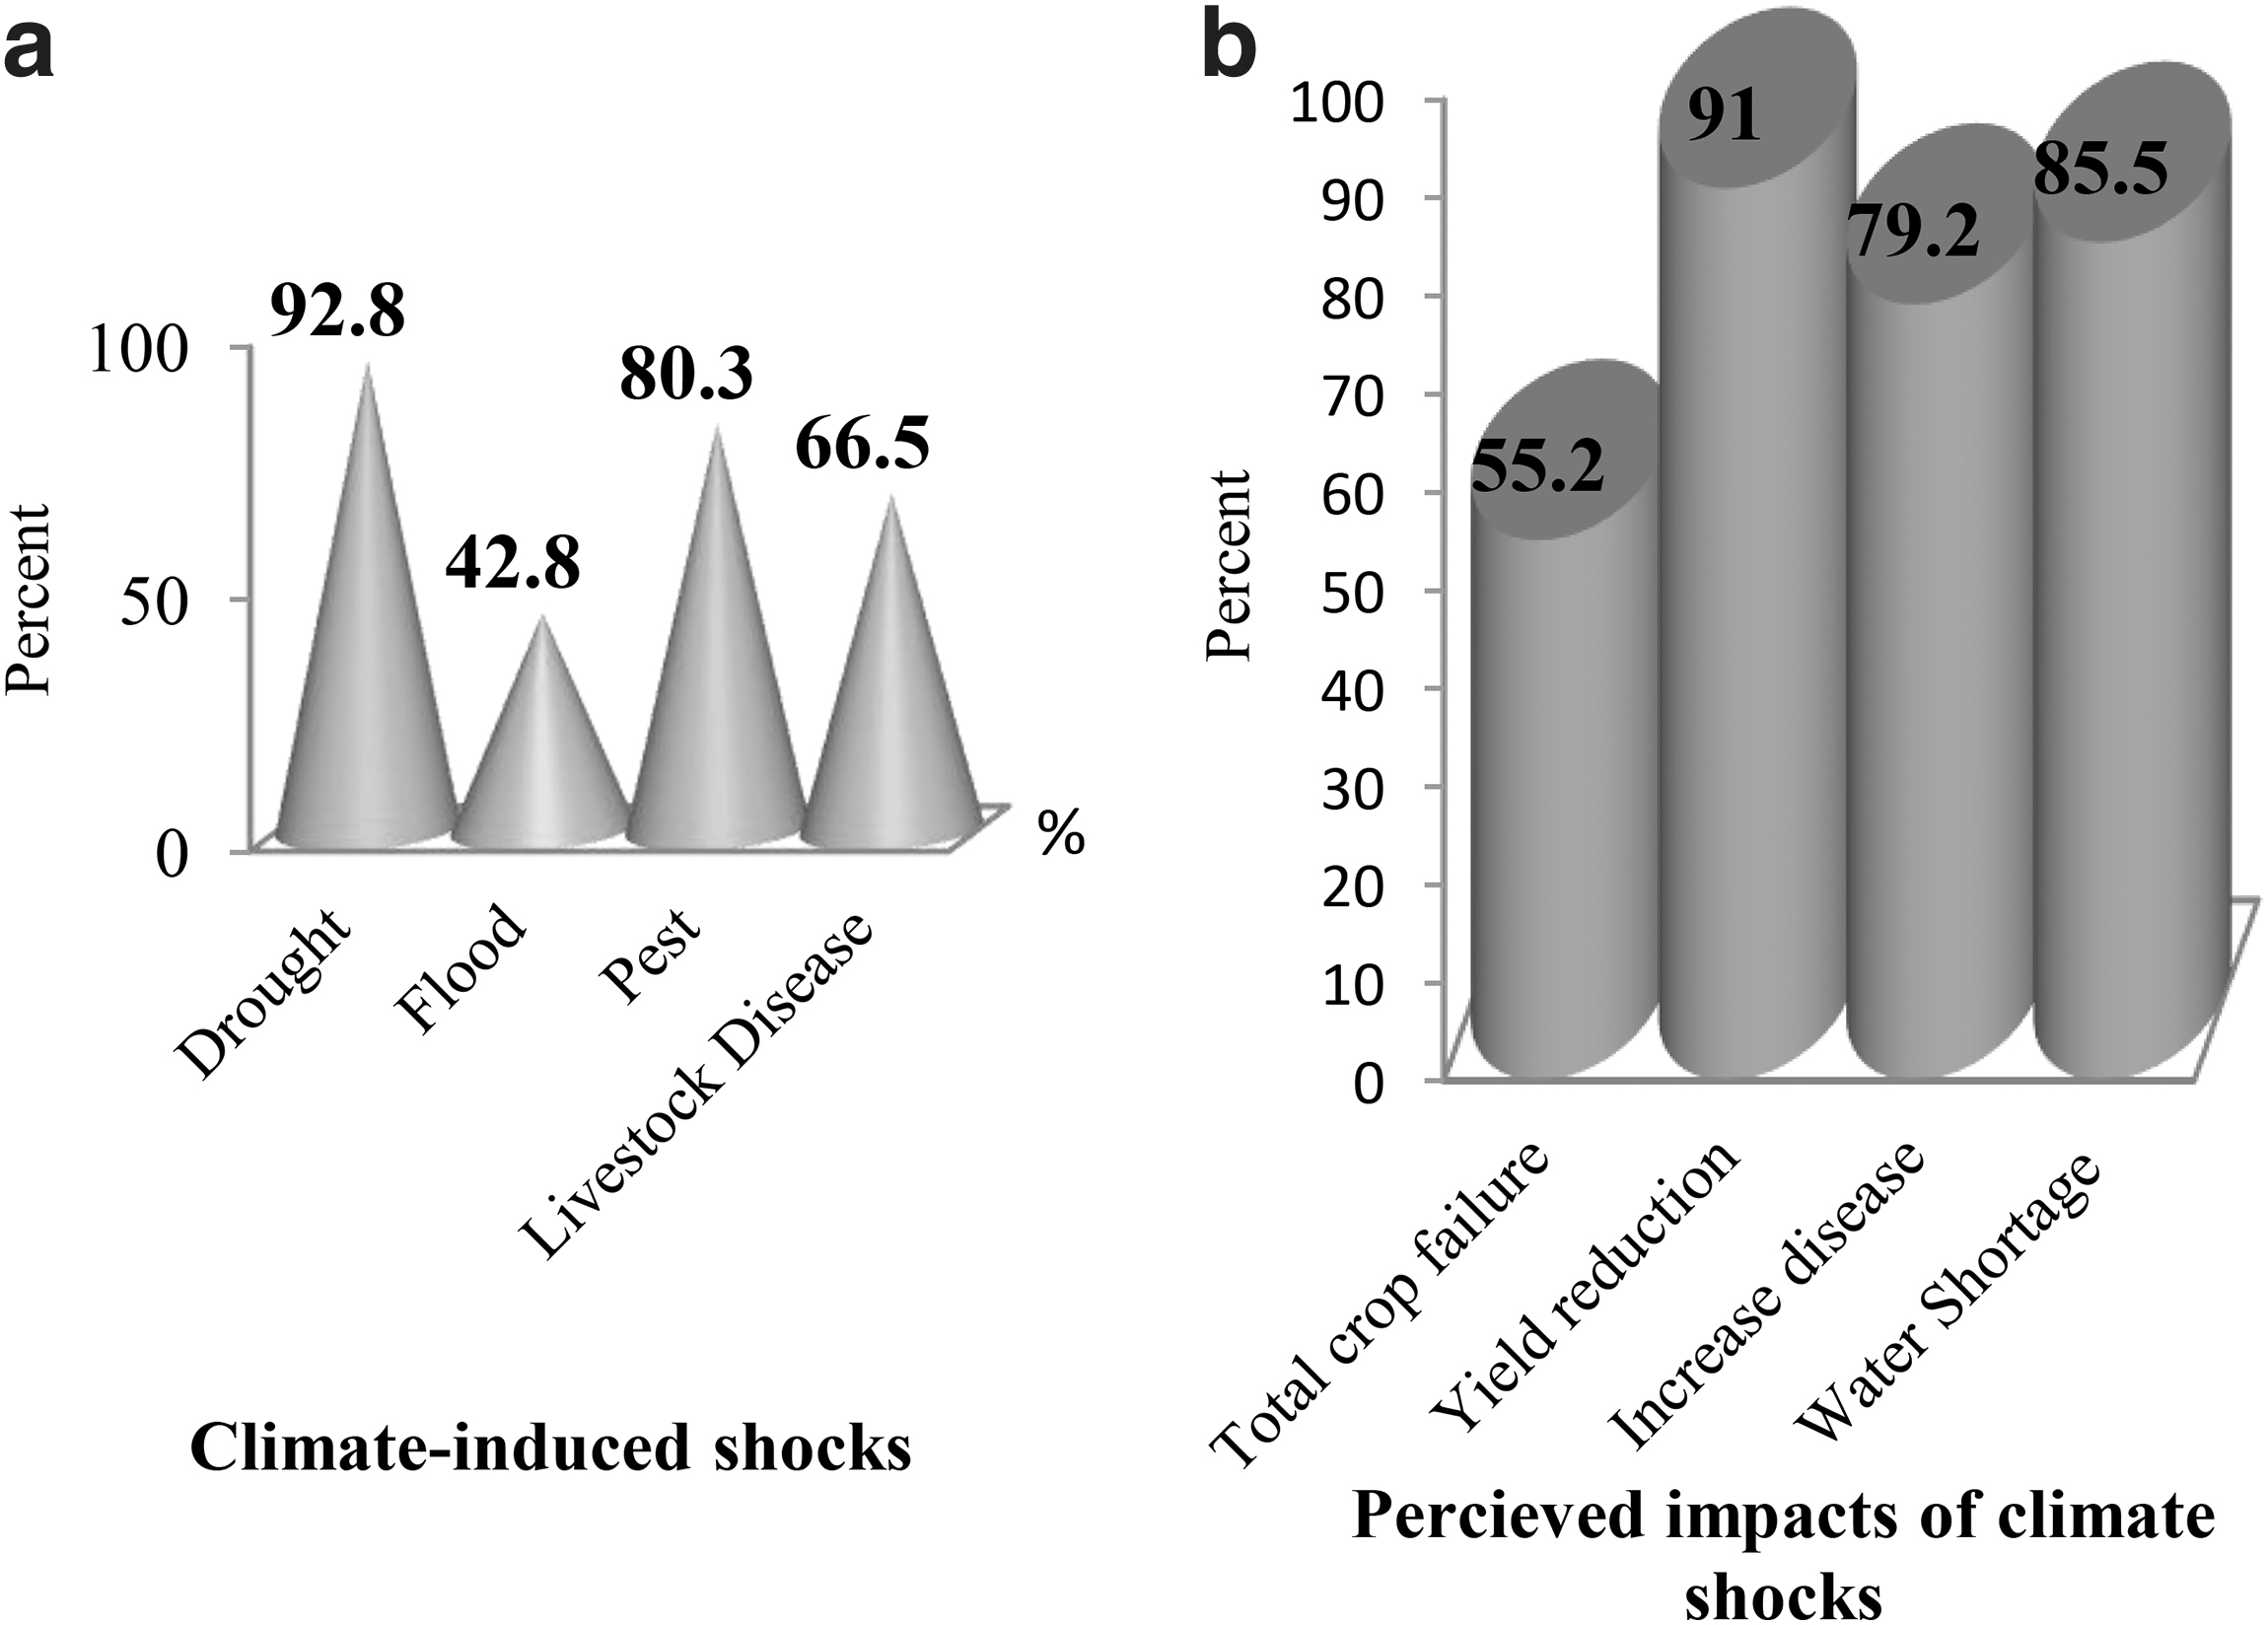
Major types of climate-induced shocks (a); experienced impacts (b) in the last 10 years
Figure 4(b) shows the outcomes of the dominant impacts of climate-induced shocks on rural farm households: a decrease in the agricultural product (91%), a lack of water for both humans and livestock (85.5%), an increase in disease prevalence (79.2%), and complete crop failure (55.2%). As a result, agricultural product income fell, leaving many rural farm households impoverished and food insecure.
Major Coping Strategies During Shock Time
Farmers in the study area use a range of coping strategies to counter short-term climate-related impacts. Though farmers implement various coping strategies to minimize the adverse effects of climate extremes, some of the response mechanisms lead to long-term challenges to their livelihoods. For example, as farmers in FGDs and KIIs from both ACZs reported:
At the time of shocking, we borrow money from our families, relatives, friends, money lenders, and even credit associations. However, the accumulated loans, combined with climate-related stresses, forced us to sell livestock, productive assets, and even rent-out farmlands at times. Especially if we sell our plow ox, milking cow, or rent farmland, we face challenges and find it difficult to escape poverty and food insecurity.
Figure 5 shows that a large number of farm households sold livestock and productive assets (53.7%) and rented-out farmland (40.2%), putting farmers' coping strategies to climate extremes in a vicious circle. Surprisingly, the study reveals that 36.7 percent of farm households did nothing or waited for help from any source during the climatic shock period. One key informant from the Woina Dega ACZ explained: “It is difficult to engage in low-order work like daily labor and working on others' farms for those who did not adapt previously due to traditional beliefs.” However, the study results indicate that some farmers (45.7%) engaged in non-farm activities to supplement their consumption and earnings during the shock period. These sources of income include petty trade, for example, selling firewood and charcoal by deforesting existing forests. One agricultural expert from the Kolla ACZ confirmed that a significant reduction in forest cover over the last two decades has resulted in soil erosion, land degradation, and increased drought frequency. The study documents that during times of climate-induced shocks, significant farm households (38.1%) withdraw their children from school and send them to urban areas to engage in income-generating activities such as selling lottery tickets and shoe cleaning. Their goal is to provide for their families' livelihoods through remittances, but the action comes at the expense of future generations' human capital investment.
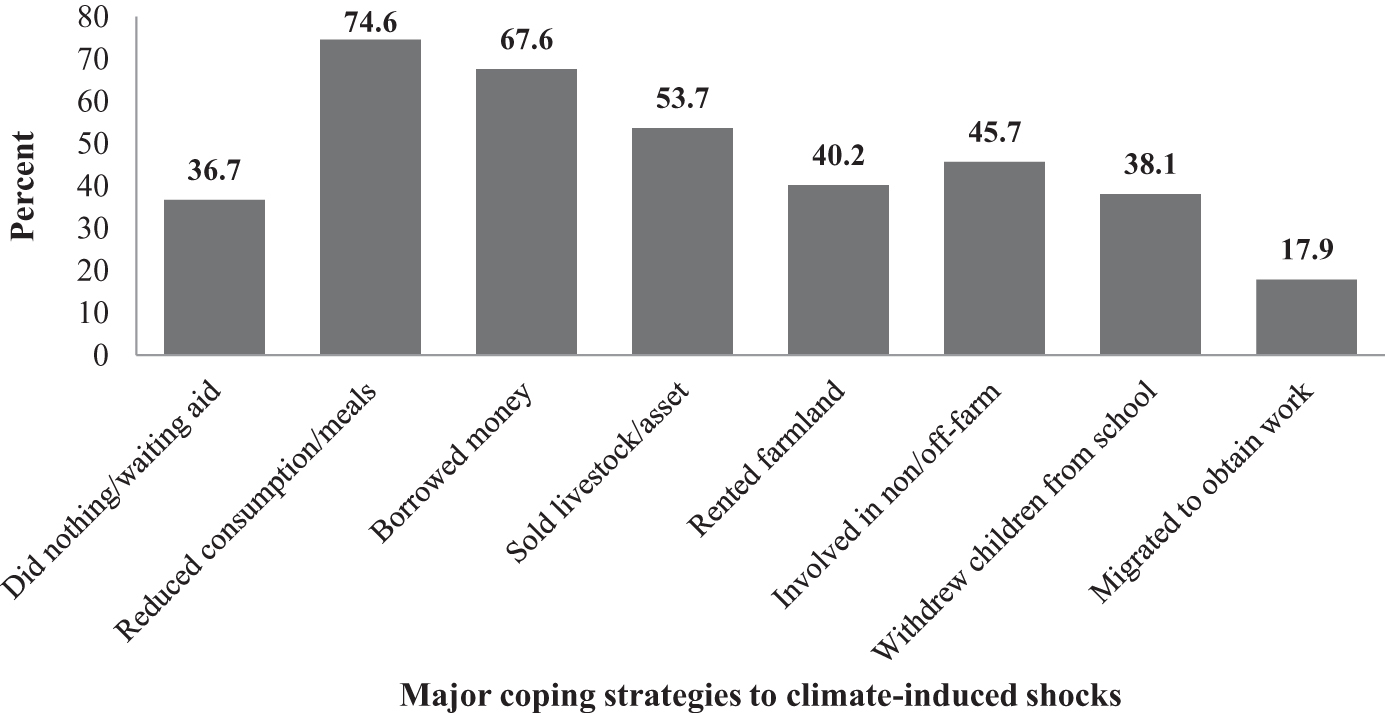
Major responses to climate-related shocks
Conclusion
Climate-induced shocks are global challenges that affect the livelihood of every individual, household, and community. These shocks have a greater impact on poor farmers whose livelihoods rely on rain-fed agriculture. Given the study's objective—to analyze the degree of vulnerability and coping strategies used to counter climate-induced shocks experienced by rural farm households in southern Ethiopia, in the Damot Woyde District, across two ACZs—the LVI and LVI-IPCC vulnerability frameworks take into account the local variables for the data calculations. The findings show that exposure, sensitivity, and adaptive capacity all have a significant impact on rural farm households' vulnerability to climate-related stresses.
The study's findings indicate that the Kolla ACZ has the highest exposure and the least adaptation potential to guard against climate-induced shocks. Its greater exposure to climate extreme events is probably a result of their heavier reliance on natural resources, irregularity in water supplies, lack of an early alert system, and a greater incidence of natural catastrophes. In addition, Kolla's inadequate adaptive capacity to adjust to climate shocks is attributable to a combination of inadequate applications of improved agricultural inputs, a low level of formal education among the residents, insufficient climate-related training, and limited livelihood diversification.
Both ACZs have relatively high sensitivity scores, most likely because of soil infertility, inadequate soil and water protection, inaccessibility to small-scale irrigation, and poor adherence to practices such as crop saving for the coming season. In contrast, the Woina Dega ACZ has lower exposure and relatively better adaptive capacity than the Kolla ACZ, which could be attributed to moderately better agricultural input implementation, accessible infrastructure, and more diverse livelihood options.
Farm households in both ACZs adopt a variety of coping mechanisms to mitigate the detrimental effects of climate-induced extremes. Yet, some of the coping techniques used by rural households result in long-term economic limits. As a result, local governments should work on ACZ-specific resilience-building and long-term adaptation strategies to minimize the effects of climate extreme events on rural farm households. Similarly, to ensure a sustainable way of life and reduce rural households' vulnerability to climate stresses, some recommendations are in order: increase the supply of agricultural inputs (improved seed varieties, i.e., drought resistant and early maturing; improved fertilizer use; and water harvesting for supplementary irrigation), improve early warning systems, practice continuous soil and water management, and encourage households to diversify their livelihoods.
Finally, using the LVI and LVI-IPCC livelihood vulnerability frameworks, this study contributes to the livelihood vulnerability discussion by highlighting the vulnerability of farming households and their coping strategies to climate-induced shocks in the two ACZs. However, because this study only focuses on two agro-climate zones, additional research on rural farmers' livelihood vulnerability and long-term adaptation strategies to climate extreme events in different ACZs needs to be conducted to make informed policy decisions.
Footnotes
Acknowledgments
The authors would like to express their heartfelt gratitude to the farmers, local administrators, key informants, focus group participants, and development agent workers who generously shared their knowledge and time.
Authors' Contributions
Eshetu Bichisa Bitana prepared the material, collected and analyzed data, and wrote the first draft. Senbetie Toma Lachore, and Abera Uncha Utallo reviewed, edited, and approved the manuscript before it was submitted for journal publication.
Availability of Data and Materials
The datasets used and/or analyzed for this study are available upon reasonable request from the corresponding author.
Funding Information
No funding or grant was received from any external institution/donor for this study.
Author Disclosure Statement
The authors declare no conflict of interest.