
Abstract
Human embryonic stem cells (hESCs) have the potential to differentiate into many adult cell types, and they are being explored as a resource for cell replacement therapies for multiple diseases. In order to optimize in vitro differentiation protocols, it will be necessary to elucidate regulatory mechanisms that contribute to lineage specification. MicroRNAs (miRNAs) are emerging as key regulators of hESC differentiation and embryonic development. In this study, we compare miRNA expression profiles between pluripotent hESCs and definitive endoderm (DE), an early step in the pathway toward the pancreatic lineage. Results from microarray analysis showed that DE can be distinguished by its unique miRNA profile, which consists of 37 significantly down-regulated and 17 up-regulated miRNAs in 2 different cell lines and in the presence/absence of feeder layers. Comparison to other hESC-derived lineages showed that most of the highly up-regulated miRNAs are specific to endoderm in early development. Notably, miR-375, which was previously implicated in regulating development and function of later stages of pancreatic development, is highly and specifically up-regulated during DE formation, suggesting that it may have a distinct role very early in development. Examination of potential mRNA targets showed that TIMM8A is repressed by ectopic miR-375 expression in pluripotent hESCs.
Introduction
A
miRNAs are small (18–25 nucleotides) non-coding RNAs that typically regulate genes postranscriptionally by inhibiting translation and/or causing RNA degradation [4,5]. Primary miRNA transcripts are processed in the nucleus by Drosha, and transported by Exportin 5 into the cytosol where further processing by Dicer releases mature ∼22 nucleotide miRNAs. The mature miRNA forms a complex with RNA-induced silencing complex (RISC), a protein complex that binds to complementary target sites in the 3′ untranslated regions (3′ UTR) of mRNA molecules [4,5]. Subsequently, the miRNA base pairs with mRNA to inhibit translation and/or degrade the message. Validated targeting interactions have been described with imperfect base pairing between miR-NAs and their targets, indicating that single miRNAs can potentially target many different mRNA genes within the same cell [6–7].
More than 700 validated miRNAs have been described in humans (
Materials and Methods
Cell culture
H9 and Cyt49 cells were maintained at 37°C, 5% CO2 in DMEM/F12 supplemented with 20% knockout serum replacement (Invitrogen, Carlsbad, CA), glutamax, nonessential amino acids, β-mercaptoethanol, and penicillin/streptomycin. Medium was replaced daily with fresh bFGF (4 ng/mL) and activin A (10 ng/mL). hESCs were maintained on a sparse layer of mitomycin-C-treated mouse feeder layers (MEFs). For feeder-free cultures, hESCs were plated on BD matrigel and maintained in medium conditioned by MEFs as described [16]. Min6 cells were cultured with high-glucose DMEM medium (12800–017; Invitrogen) supplemented with 2 g/L sodium bicarbonate, 4% FCS, and 0.14 mM β-mercaptoethanol.
Differentiation
Differentiation was carried out in RPMI (Mediatech Inc., Manassas, VA) with varying concentrations of defined FBS (HyClone, Logan, UT): 0% at days 0–1, 0.2% at days 1–3, and 2% at days 3–4. For DE differentiation, cells were treated with 100 ng/mL Activin A for 4 days, and 25 ng/mL Wnt3a from days 0 to 1 only. For extraembryonic differentiation, cells were treated with 100 ng/mL BMP4 and 3 nM FGFR inhibitor (PD173074; EMD Chemicals Inc., Gibbstown, NJ) for 4 days. For ectodermal differentiation, cells were treated with 100 ng/mL Noggin and 5 μM ACTR inhibitor (SB431542; Sigma Aldrich, St. Louis, MO) for 4 days.
RNA analysis
Except where indicated, all tissues were lysed in Trizol and RNA was extracted by the recommended procedure (Invitrogen, Carlsbad, CA). Resultant RNA was treated with Turbo DNAse (Ambion, Austin, TX) for 30 min. DNAse-treated RNA was purified by sequential extraction in phenol:chloroform:isoamyl alcohol (25:24:1) and chloroform alone, then precipitated in 4 volumes ethanol. For miR-375 overexpression experiments, RNA was isolated with RNAeasy kit from Qiagen (Valencia, CA). cDNA for mRNA analysis was created using Superscript III reverse transcriptase (Invitrogen). For miRNA analysis, cDNA was made with the NCode cDNA synthesis kit (Invitrogen). Quantitative PCR was performed on a StepOnePlus thermocycler (Applied Biosystems Inc., Foster City, CA) with SYBR green mastermix or Taqman mastermix from Applied Biosystems. mRNA Ct values were normalized to housekeeping genes Cycliphilin G and TATA-binding protein. miRNA Ct values were normalized to U6 RNA and 5S RNA. Oligonucleotide sequences are provided in Supplementary Tables 1 and 2 (Supplementary materials are available online at
Taqman qRT-PCR of miRNAs
Reverse transcription and PCR Amplification was performed by Asuragen using ABI Taqman probes, PCR master mixes, and reverse transcription (RT) components (Applied Biosystems Inc., Foster City, CA). All amplifications were performed on a validated ABI 7900HT real-time thermocycler in its Absolute Quantification mode. The corresponding synthetic miRNAs were included as positive controls for each assay set. Average Ct values from each set of replicates were compared to independently generated standard curves derived from synthetic RNAs diluted in yeast tRNA at inputs between 500 and 50,000,000 copies/reaction.
Northern blot analysis of miRNAs
Polyacrylamide gel electrophoresis (PAGE) northern methods were performed as previously described [17]. A kinase-labeled DNA oligo probe for hsa-miR-375 consisted of the sequence: 5′-TCACGCGAGCCGAACGAACAAA-3′. Ethidium bromide staining of the gel prior to transfer was used to detect small rRNAs to assess loading and quality of the total RNA samples.
Microarray analysis
A custom-manufactured Affymetrix microarray from Ambion was designed to miRNA probes derived from Sanger mirBase and published reports [18 –21]. Antigenomic probe sequences were provided by Affymetrix and derived from a larger set of controls used on the Affymetrix human exon array for estimating background signal, as described below. Other non-miRNA control probes on the array were designed to lack sequence homology to the human genome and can be used for spike-in external reference controls. Samples for miRNA profiling studies were processed by Asuragen Services (Austin, TX), according to the company's standard operating procedures. The miRNA-enriched fraction of small RNAs was purified from total RNA by poly-acrylamide gel electrophoresis using Ambion's flashPAGE™ kits (Ambion, Austin, TX). The 3′ ends of the RNA molecules were tailed and biotin-labeled using the mirVana™ miRNA Labeling Kit (Ambion). The kit's dNTP mixture in the tailing reaction was replaced with a proprietary nucleotide mixture containing biotin-modified nucleotides (Perkin Elmer, Waltham, MA). Hybridization, washing, staining, imaging, and signal extraction were performed according to Affymetrix-recommended procedures, except that the 20× GeneChip Eukaryotic Hybridization Control cocktail was omitted from the hybridization. The signal processing implemented for the Ambion miRCHIP is a multistep process involving probe-specific signal detection calls, background estimation and correction, constant variance stabilization [15], and either array scaling or global normalization. For each probe, an estimated background value is subtracted that is derived from the median signal of a set of GC-matched antigenomic controls. Arrays within a specific analysis experiment were normalized together according to the variance stabilization method described by Huber et al. [22]. Detection calls were based on a Wilcoxon rank-sum test of the miRNA probe signal compared to the distribution of signals from GC-content matched antigenomic probes. For statistical hypothesis testing, a 2-sample t-test, with assumption of equal variance, was applied. One-way ANOVA was used for experimental designs with ξ2 experimental groupings or levels of the same factor. We define miRNAs as differentially expressed if both of the following criteria are met: P value <0.01 and log2 difference ξ1. For each microarray experiment, each sample was prepared and analyzed in triplicate. However, PCA analysis indicated that samples for feeder-free differentiation exhibited an outlier in one of three day 0 samples. Therefore, that sample was excluded and only 2 replicates were used in subsequent statistical analyses.
FACS analysis
Cells were trypsinized with 0.05% trypsin in PBS/EDTA, washed, and resuspended in PBS with 0.5% BSA. Cells were sorted either for green fluorescence (lentiviral-induced EGFP expression) or for the cell-surface marker CXCR4. For CXCR4 analysis, single cells were labeled with anti-human CXCR4-PE (R&D Systems, Minneapolis, MN) and mouse IgG (Santa Cruz Biotechnology, Santa Cruz, CA) was used for isotype control. Cells were analyzed using a FACS Vantage sorter (Becton Dickinson, Franklin Lakes, NJ), and cell-surface antigen expression was quantitated using CellQuest software (Becton Dickinson).
Immunostaining
Cells were fixed with 4% paraformaldehyde, permeabilized with 0.2% Triton X-100, washed with phosphate-buffered saline (PBS), and blocked for 1 h in 1% BSA, 5% donkey serum in PBS. Protein expression of the stem cell markers SSEA-4 and Oct4 was analyzed using primary mouse monoclonal anti-SSEA-4 IgG (Chemicon, Temecula, CA; cat#MAB4304) and rabbit anti-Oct4 antiserum (Santa Cruz Biotechnology, Santa Cruz, CA; cat#SC9081), and secondary antibodies used were Rhodamine Red donkey anti-mouse (Jackson ImmunoResearch, West grove, PA; cat#715–296-006) and FITC donkey anti-rabbit (Jackson ImmunoResearch, cat#711–096-020). Protein expression of DE was analyzed using primary mouse anti-Sox-17 antiserum (a generous gift from Novocell, San Diego, CA) and Alexa Fluor488 donkey anti-mouse (Invitrogen, Carlsbad, CA; cat#A21202).
Generation of recombinant lentivirus
HIV7-EG plasmid was created by replacing the CMV promoter from HIV7-CG [23] with the EF1α promoter from pTracerEF-Bsd-A (Invitrogen, Carlsbad, CA). The recombinant lentivirus used to express miR-375 (HIV7-EG-375) was created by inserting the miR-375 precursor sequence downstream of the EGFP stop codon in the lentiviral transfer plasmid HIV7-EG. The miR-375 precursor was generated by PCR amplification from human genomic DNA, using the primers: 5′-CGCCGCGGCCGCCGACGTGTCAGC-3′ and 5′-GACTGCGGCCGCACAGCCTCTCCCACCCGTACGG-3′′. HIV7-EG does not contain a miRNA transgene insert, and was used for control. Human ESCs were infected in the presence of 8 ng/mL polybrene overnight, followed by replacement of cell culture medium after 12 h. Of 2.5–3 days postinfection, EGFP+ cells were sorted by FACS, and RNA was isolated using Qiagen's RNAeasy kit.
Luciferase assays
The human TIMM8A 3′ UTR target site was PCR-amplified using the following primers:
5′-CTACTAGTCTGACTGATCTCAGCATTACCTCTTTG G-3′ and 5′-CTGTTTAAACGCATCTAAATAGAGTTTTCTTTCGCCTGTC-3′ and cloned downstream of the stop codon in pMIRR-Luc (Ambion, Austin, TX). This LucTIMM construct was used to generate the mutant LucTIMM plasmid (Fig. 6). Min6 cells were cultured in 24-well plates and each well transfected with 450 ng of luciferase plasmid with Lipofectamine 2000 (Invitrogen, Carlsbad, CA) and 25 ng of CMV-βgalactosidase vector for normalization. Cells were harvested and assayed 45–48 h after transfection. Luciferase assays performed as previously described [24].
Results
To characterize miRNA expression in endoderm development, we compared RNA levels between pluripotent hESCs and DE. Definitive endoderm was derived from hESCs by a modification of a previously described method [25] (Fig. 1A). Serum was removed at the start of the protocol to reduce activity of the phosphatidylinositol 3-kinase (PI3K) signaling pathway, an inhibitor of differentiation [26], while high Activin A levels directed the differentiation toward DE. Two separate differentiation conditions were performed in triplicate. In the first condition, 2 cell lines, H9 and Cyt49, were grown and differentiated on a sparse feeder layer of mouse embryonic fibroblasts (MEFs), and RNA was harvested for analysis at day 0 (hESCs) and day 4 (DE). In a second differentiation, Cyt49 cells were plated on matrigel then grown and differentiated under feeder-free conditions. Feeder-free cells were harvested on days 0, 2, and 4 of differentiation.
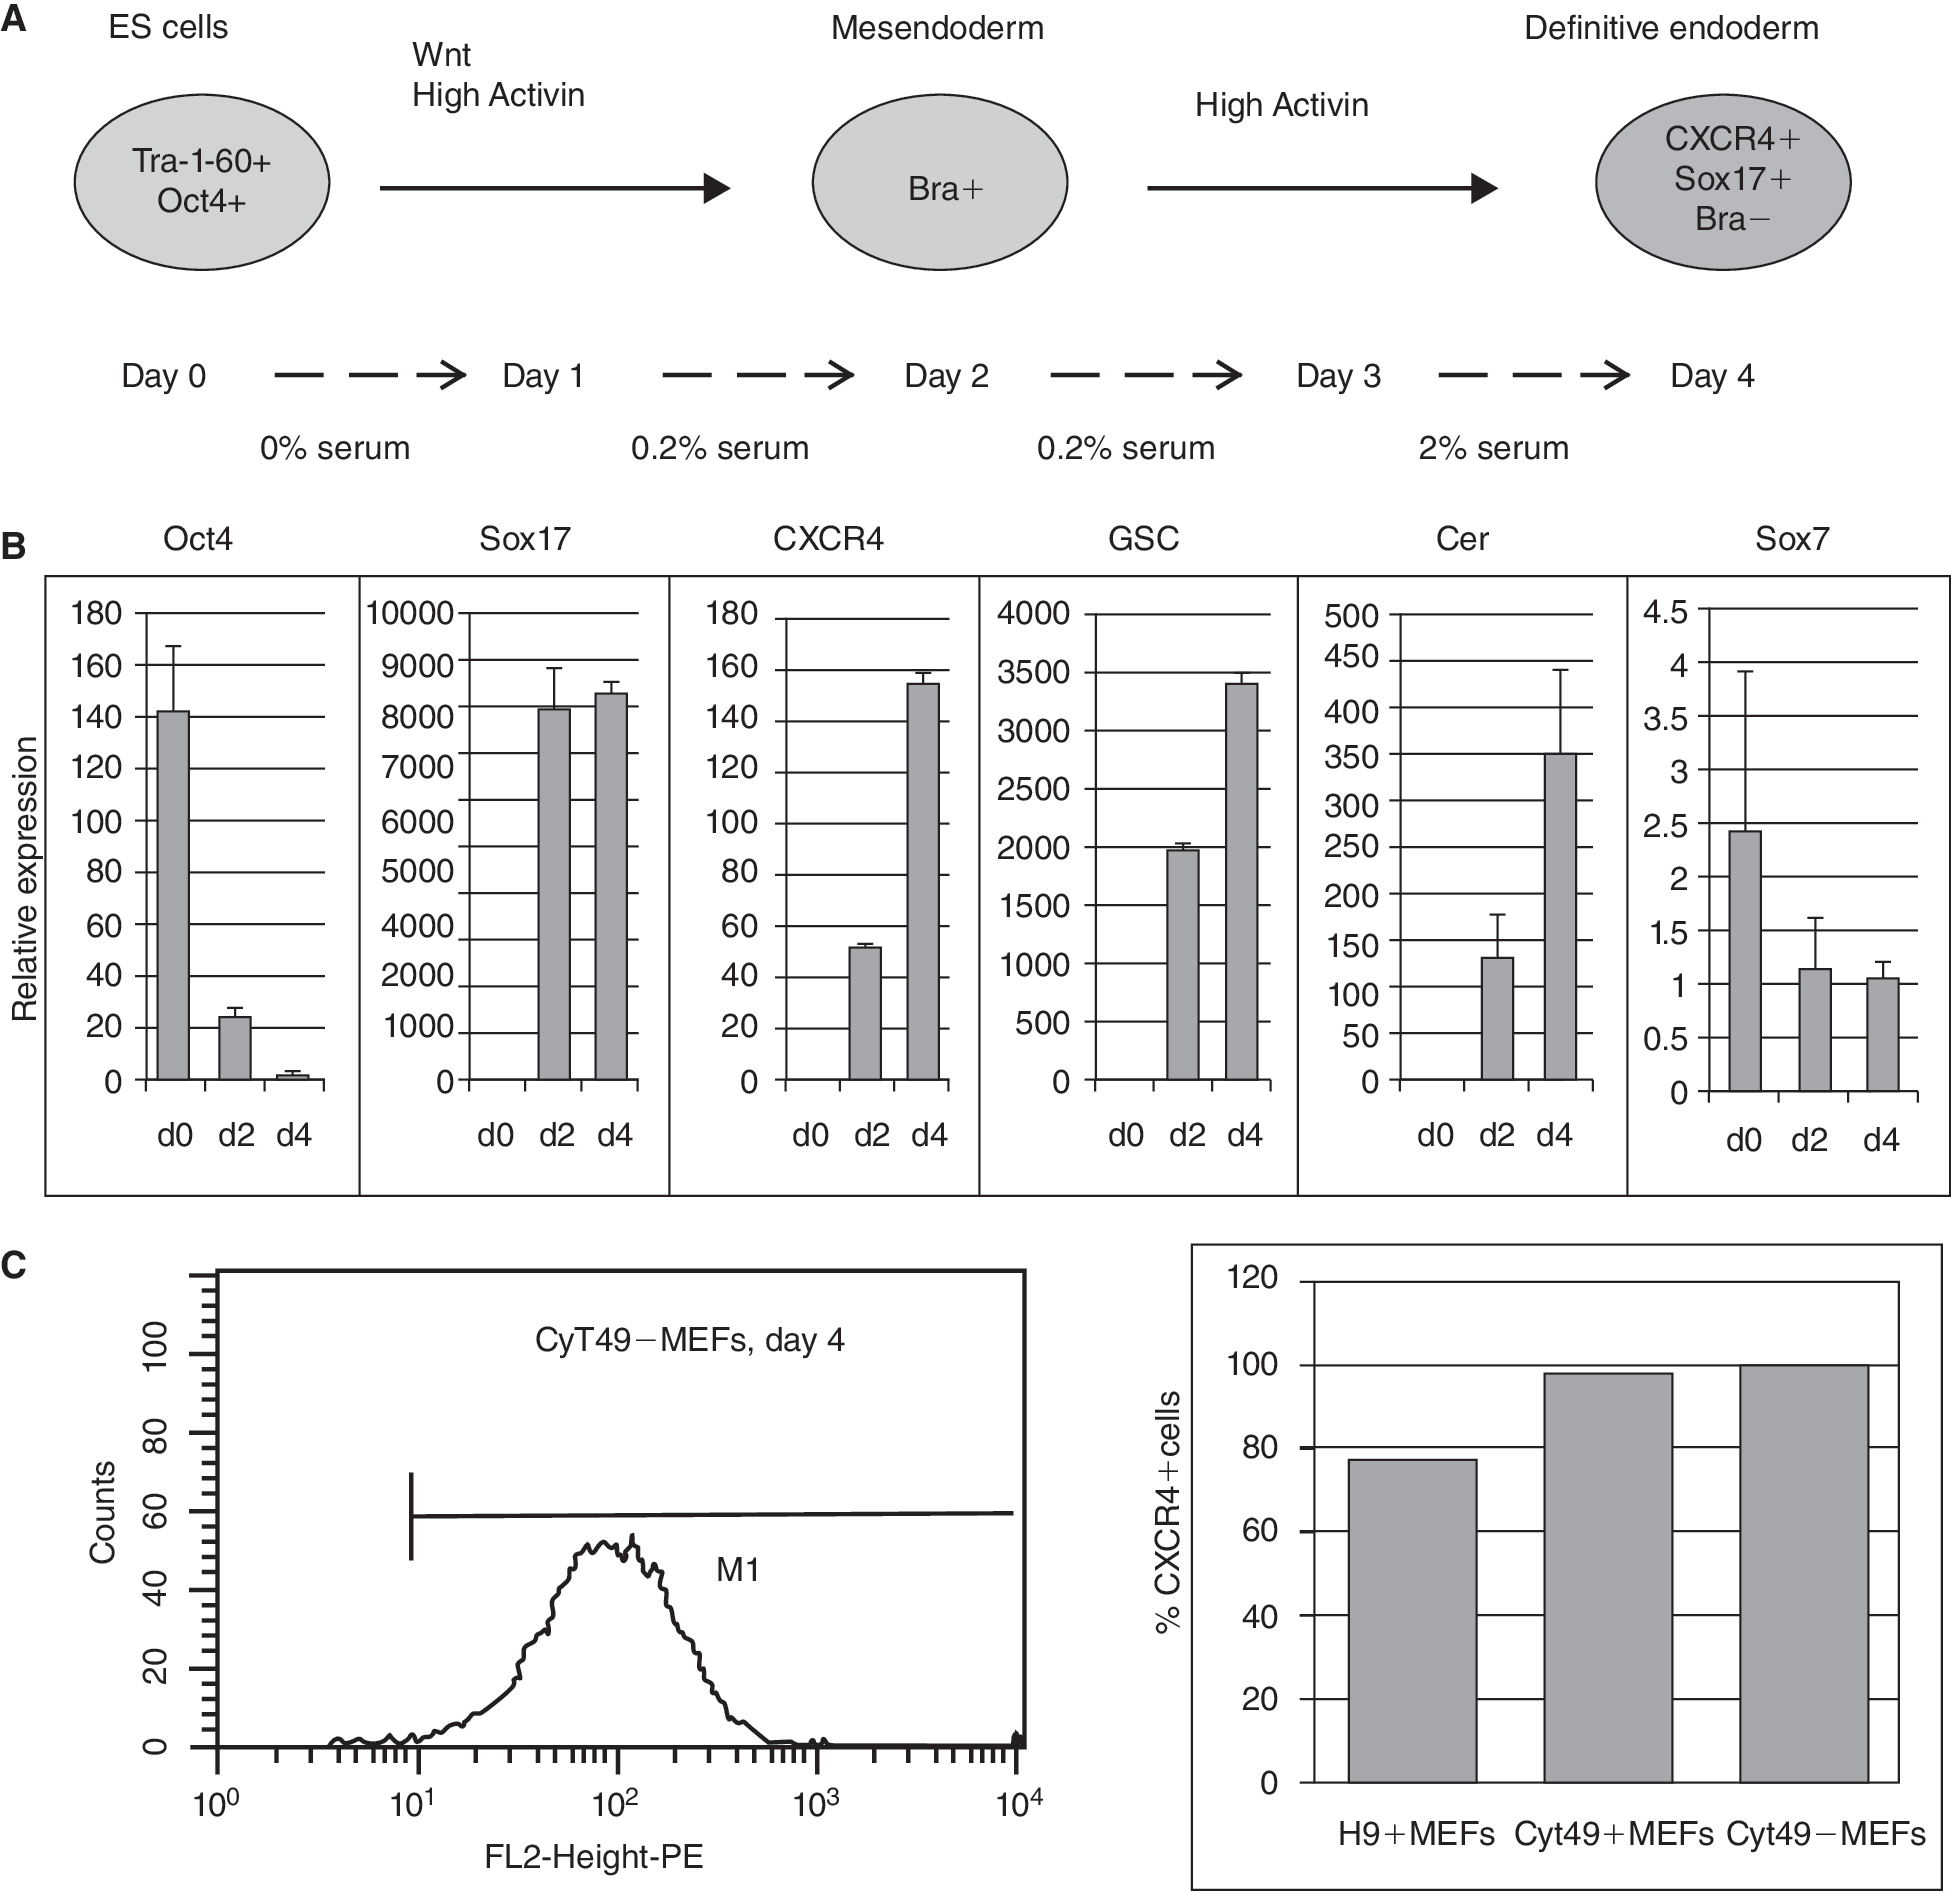
Differentiation of human embryonic stem cells (hESCs) into definitive endoderm (DE). (
The differentiation of hESCs was evaluated by various methods. H9 cells and Cyt49 cells expressed pluripotency markers OCT4 and SSEA-4 prior to differentiation, as shown by immunostaining (Supplementary Fig. 1A). The efficiency of DE formation was validated by qRT-PCR analysis of a panel of lineage markers for pluripotency (Oct4), extraembryonic tissue (Sox7), and DE (Sox17, CXCR4, GSC, and Cer) (Fig. 1B for feeder-free growth and Supplementary Fig. 1B for MEF+ growth). Additionally, kinetic analysis of expression of Brachyury and MixL1, markers of primitive streak and mesoderm but not DE, indicated that differentiated cells passed through an intermediate, mesendoderm-like stage prior to DE formation (Supplementary Fig. 1C). Efficiency of DE formation was quantitated by FACS analysis for the DE marker CXCR4 (Fig. 1C). CXCR4 is a marker for both DE and mesoderm, but immunostaining for SOX17 (Supplementary Fig. 1D) indicated the formation of DE. Differentiated cell cultures were 79% and 98% positive for CXCR4, respectively, for H9 cells and Cyt49 cells. In our laboratory, the Cyt49 cell line consistently differentiated with high efficiency into DE as well as subsequent stages in pancreatic development. Thus, we chose to focus on Cyt49 differentiated in feeder-free conditions for our data analysis, with the H9 cell line serving to confirm miRNA expression in an alternate cell line that typically did not form DE as efficiently. Microarray analysis of RNA samples from all 3 differentiations (GEO accession# GSE16681) also resulted in mRNA profiles similar to that described by Mclean et al. [26] using Activin to induce DE in Cyt-25 and BG01 hES cell lines.
Human ESCs and DE exhibit distinct microRNA profiles
RNA isolated from each stage of differentiation was compared by miRNA microarray and conventional mRNA microarray profiling. The miRNA profiling utilized an Affymetrix array containing probes to interrogate 98.3% of verified human miRNAs (ξ700 miRNAs listed in Sanger's mirBase 9.2) and 12,894 candidate miRNAs derived from computational predictions from the human genome (Asuragen, Inc., Austin, TX). Principle component analysis of each differentiation was done in order to determine whether global miRNA expression patterns align with the experimental groups. A perspective of the global changes in miRNA expression during hESC differentiation was presented by Volcano plots (Fig. 2). Although the majority of miRNAs showed very minor changes in expression, a small number of miRNAs were significantly up-regulated or down-regulated during hESC differentiation. Thus, these cell populations were distinguishable by their miRNA signatures. Heat maps (Fig. 3) show the clustered expression patterns across all 3 differentiation experiments for the 37 down-regulated and 17 up-regulated miRNAs that are listed in the Sanger miRBase. The miRNA profile that results from DE formation was shared between 2 different cells lines: H9 and Cyt49 (Fig. 3). Additionally, 67 predicted miRNA sequences also exhibited differential expression by microarray analysis. Because these candidate miRNAs were not listed in the Sanger mirBase and have not been confirmed by independent methods, we listed them separately in Supplementary Tables 3 and 4.
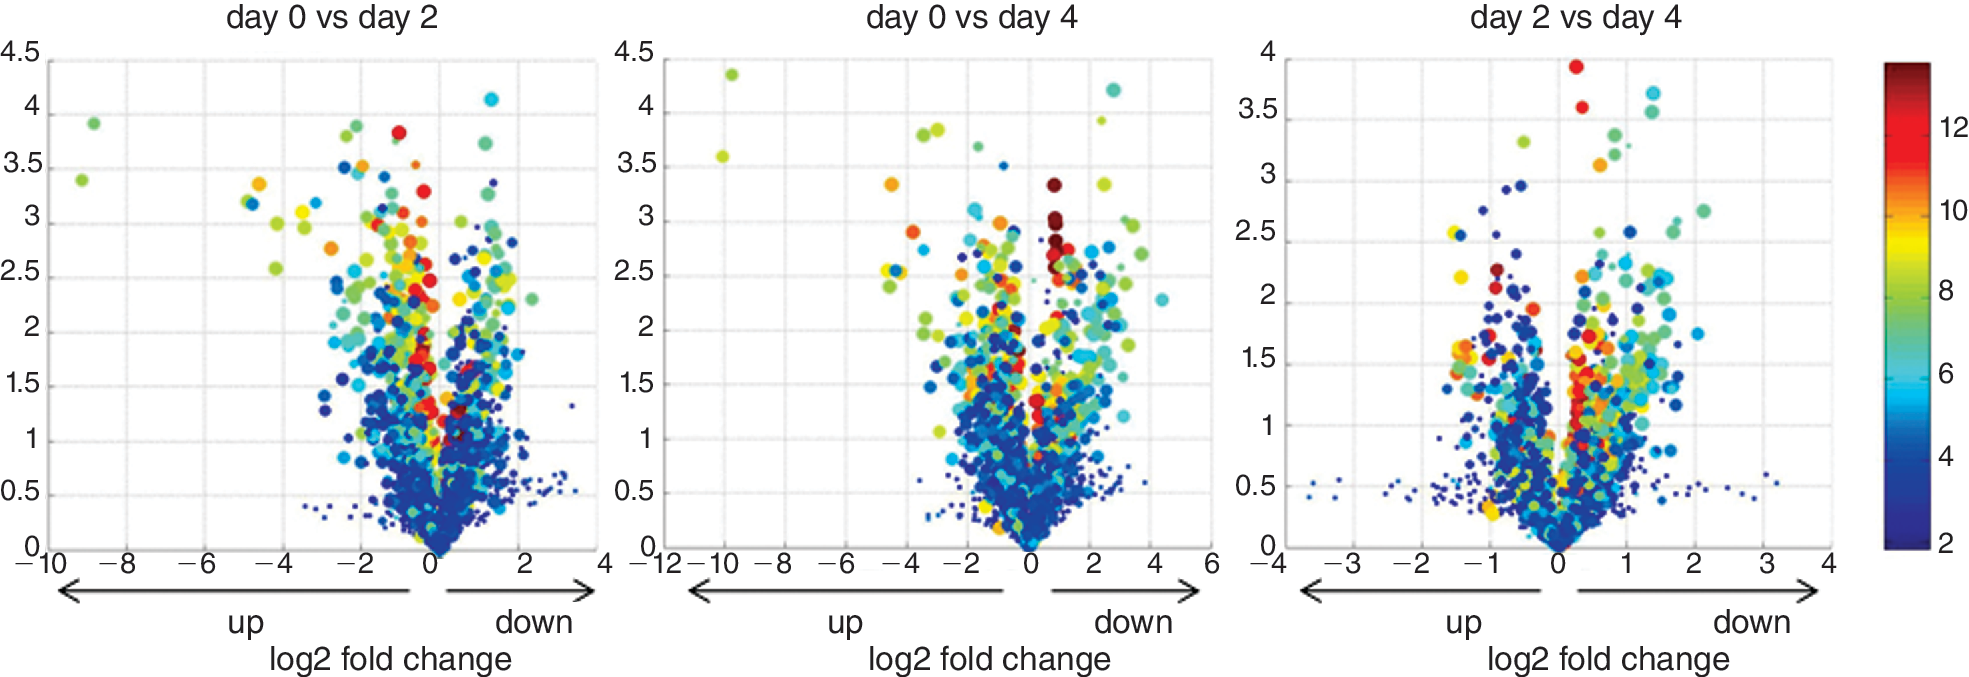
MicroRNA expression data for feeder-free differentiation presented in Volcano plots. Volcano plots provide a global comparison of the magnitude of the fold-change to the statistical significance level. The negative log10 of P values (y-axis) is plotted against the log2 of the fold-change between days of differentiation (x-axis). The circle is colored according to the average expression of the probe across the 2 groups. Microarray data can be viewed at GEO Web site,
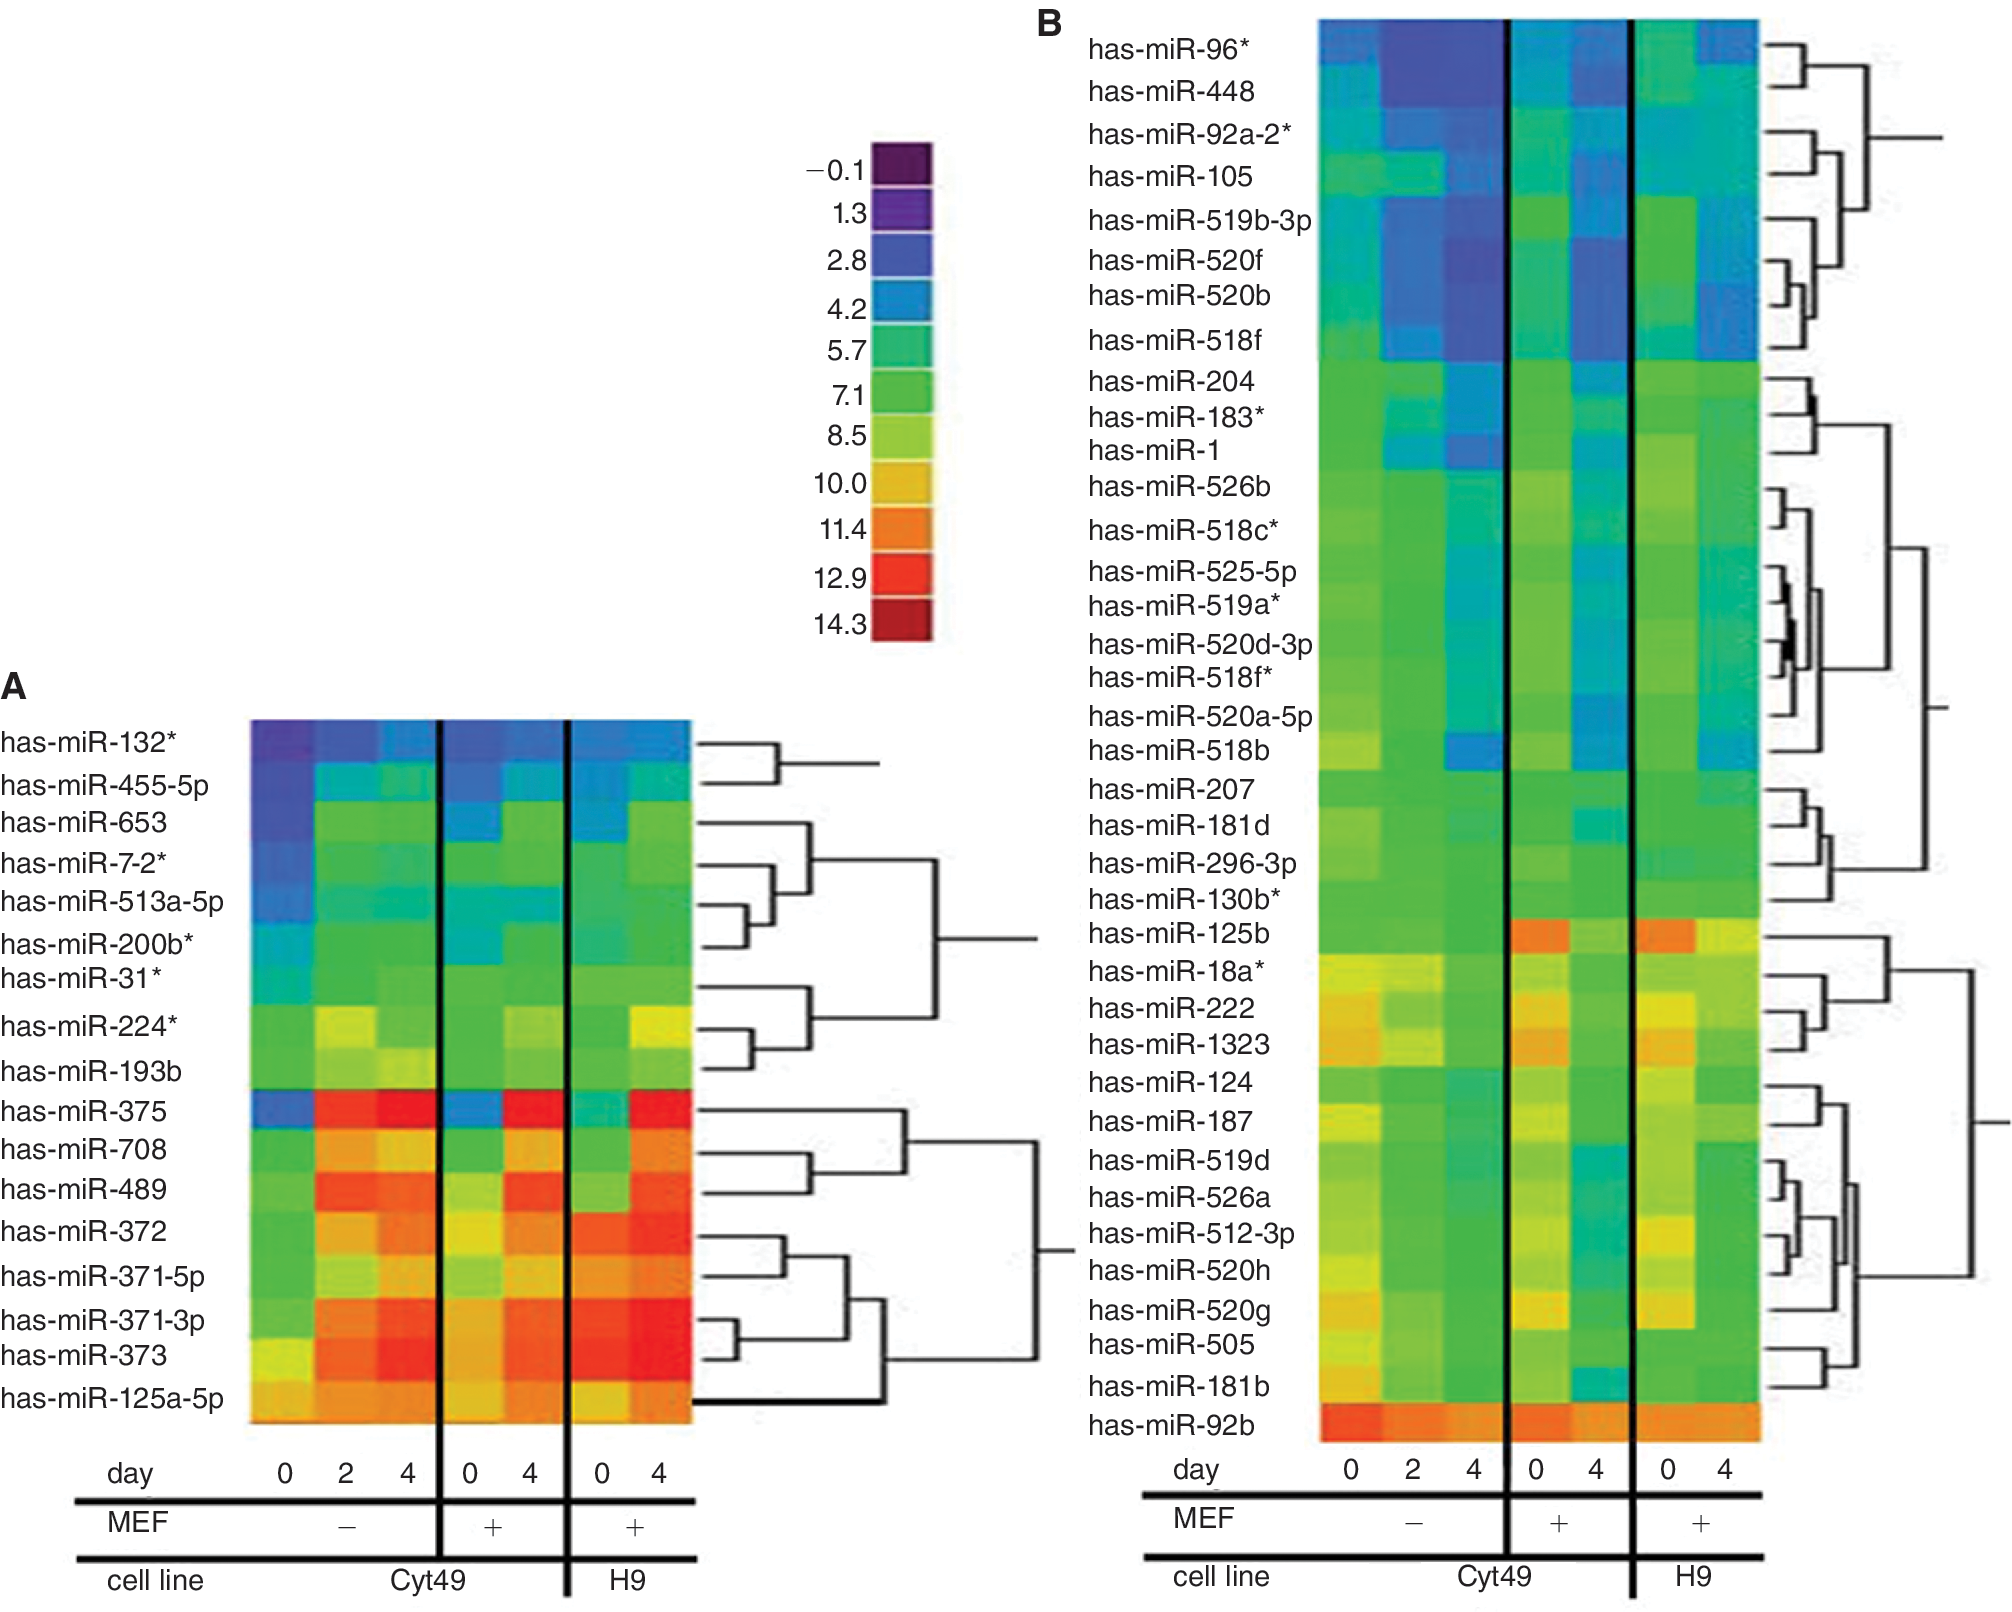
Microarray analysis of H9 and CyT49 cells differentiated into DE. Heat maps show mean log2 expression values indicated by relative fluorescence, comparing Cyt49 cells grown in feeder-free condition to Cyt49 cells grown on MEFs and H9 cells grown on MEFs. (
Profile of up-regulated DE miRNAs is established at an intermediate time point
Cyt49 cells differentiated under feeder-free conditions were harvested at 3 time points (days 0, 2, and 4) to include a period coincident with an intermediate mesendoderm-like stage. Although Figure 3 indicates that the miRNA profile of pluripotent hESCs (day 0) was more distinct than samples collected at day 2 and day 4 of differentiation, we focused on highly up-regulated miRNAs to show a more clear-cut signature of DE-related miRNAs. The log2 differences in expression between hESCs and differentiated cells are shown in Figure 4. Most DE-specific miRNAs were already expressed by day 2 at levels comparable to day 4. The presence of these miRNAs near the end of the mesendoderm transition, rather than appearing only as a result of DE formation, suggests possible roles early in DE specification. The most highly up-regulated miRNA during endoderm differentiation was miR-375, a gene that has also been described in pancreatic islet development and regulation of pancreatic β-cell function [12 –15].
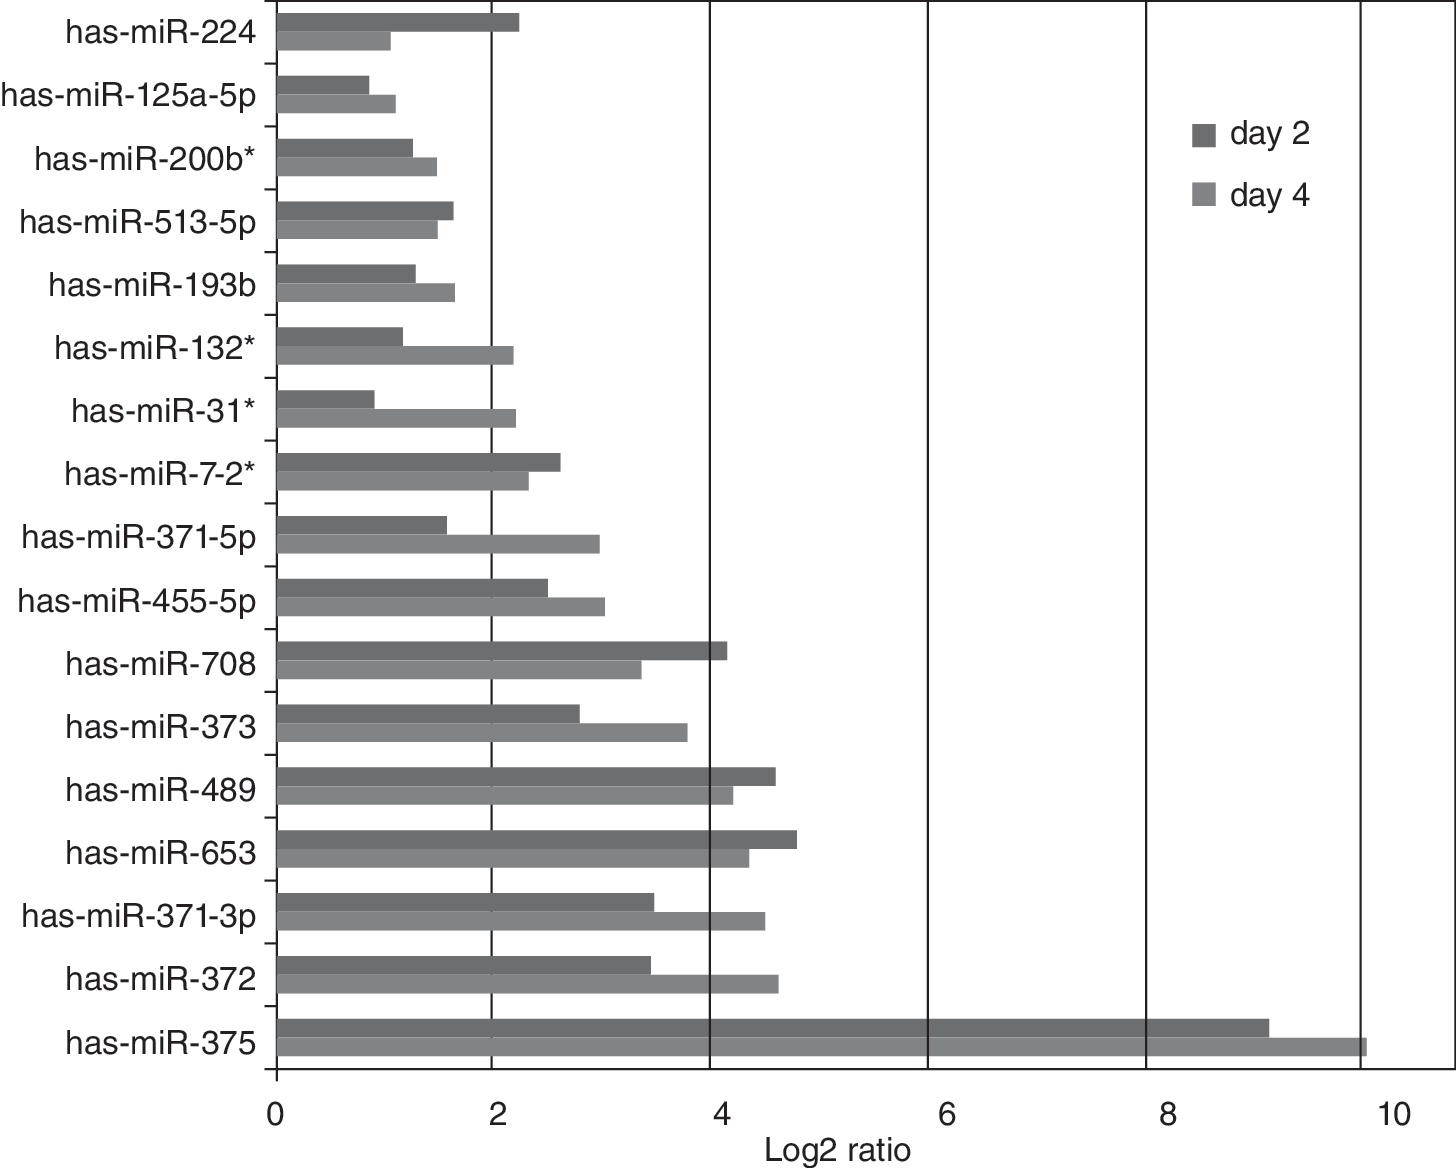
Up-regulated miRNAs in feeder-free differentiation of CyT49 cells. Comparison of up-regulated miRNA levels in day 2 and day 4 of differentiation. Data expressed as log2 difference between day 0 versus day 2 (red) and day 0 versus day 4 (blue).
MicroRNA signatures are similar in hESCs differentiated on MEFs and feeder-free conditions
Comparison of Cyt49 cells differentiated both with and without MEF feeder layers illustrates that similar miRNA profiles are created under both conditions (Fig. 3). However, members of the let-7 family of miRNAs exhibited high expression levels in the microarray analysis of feeder-fed hESCs, although they were previously reported not to occur in hESCs [8]. To investigate whether these miRNAs were of human or rodent origin, we analyzed RNA by qRT-PCR from hESCs plated on matrigel in absence of MEFs and from isolated MEFs, both treated with Activin A for 4 days (Supplementary Fig. 2A). We found that let-7 miRNAs were highly expressed in MEFs but not hESCs, indicating that the low percentage of MEFs included in the cell cultures were responsible for most of the let-7 miRNA signals detected on the microarrays. Subsequent microarray analysis of hESCs differentiated on matrigel (Supplementary Fig. 2B) confirmed this observation, and revealed that the let-7 family was apparently the only group of miRNAs expressed at high enough levels to cause significantly increased signals in MEF-fed hESCs.
Highly up-regulated miRNAs are unique to DE during early hESC differentiation
In these studies, we observed up-regulation of a characteristic set of miRNAs that was distinct from previously published miRNA profiles of differentiated ESCs [8,27 –30]. Although several reports described miRNA profiles comparing pluripotent ESCs to differentiated ESCs, most of the highly up-regulated miRNAs in our dataset were either not detected in those models, or reported as miRNAs down-regulated by differentiation. This may indicate a low percentage of endoderm in other differentiation protocols, or the fact that our model represents the first 4 days of differentiation, while other protocols differentiate ESCs for a longer time. To assess the endoderm specificity of selected miRNAs in DE differentiation, we treated Cyt49 cells for 4 days with factors that should induce endoderm (low serum, Activin A), ectoderm (low serum, Noggin + Activin inhibitor), or extraembryonic tissue (low serum, BMP4 + FGFR inhibitor). RNA expression was analyzed by qRT-PCR for lineage-specific markers of ESCs (Oct4), definitive endoderm (CXCR4, Sox17), ectoderm (Pax6), and extraembryonic tissues (Sox7, Cdx2) to confirm the differentiation of 4 distinct cell populations. Subsequently, qRT-PCR analysis indicated that miR-375, miR-708, miR-653, miR-373, miR-372, and miR-371–5p are specifically induced at high levels in DE, but not in ectoderm or extraembryonic tissues (Fig. 5). In contrast, miR-489 was significantly up-regulated in all 3 hESC-derived lineages, though levels were highest in DE. Consistent with the array results, miR-181b and miR-124 were down-regulated in endoderm lineage cells, and miR-302a did not change significantly during the hESC to DE transition.
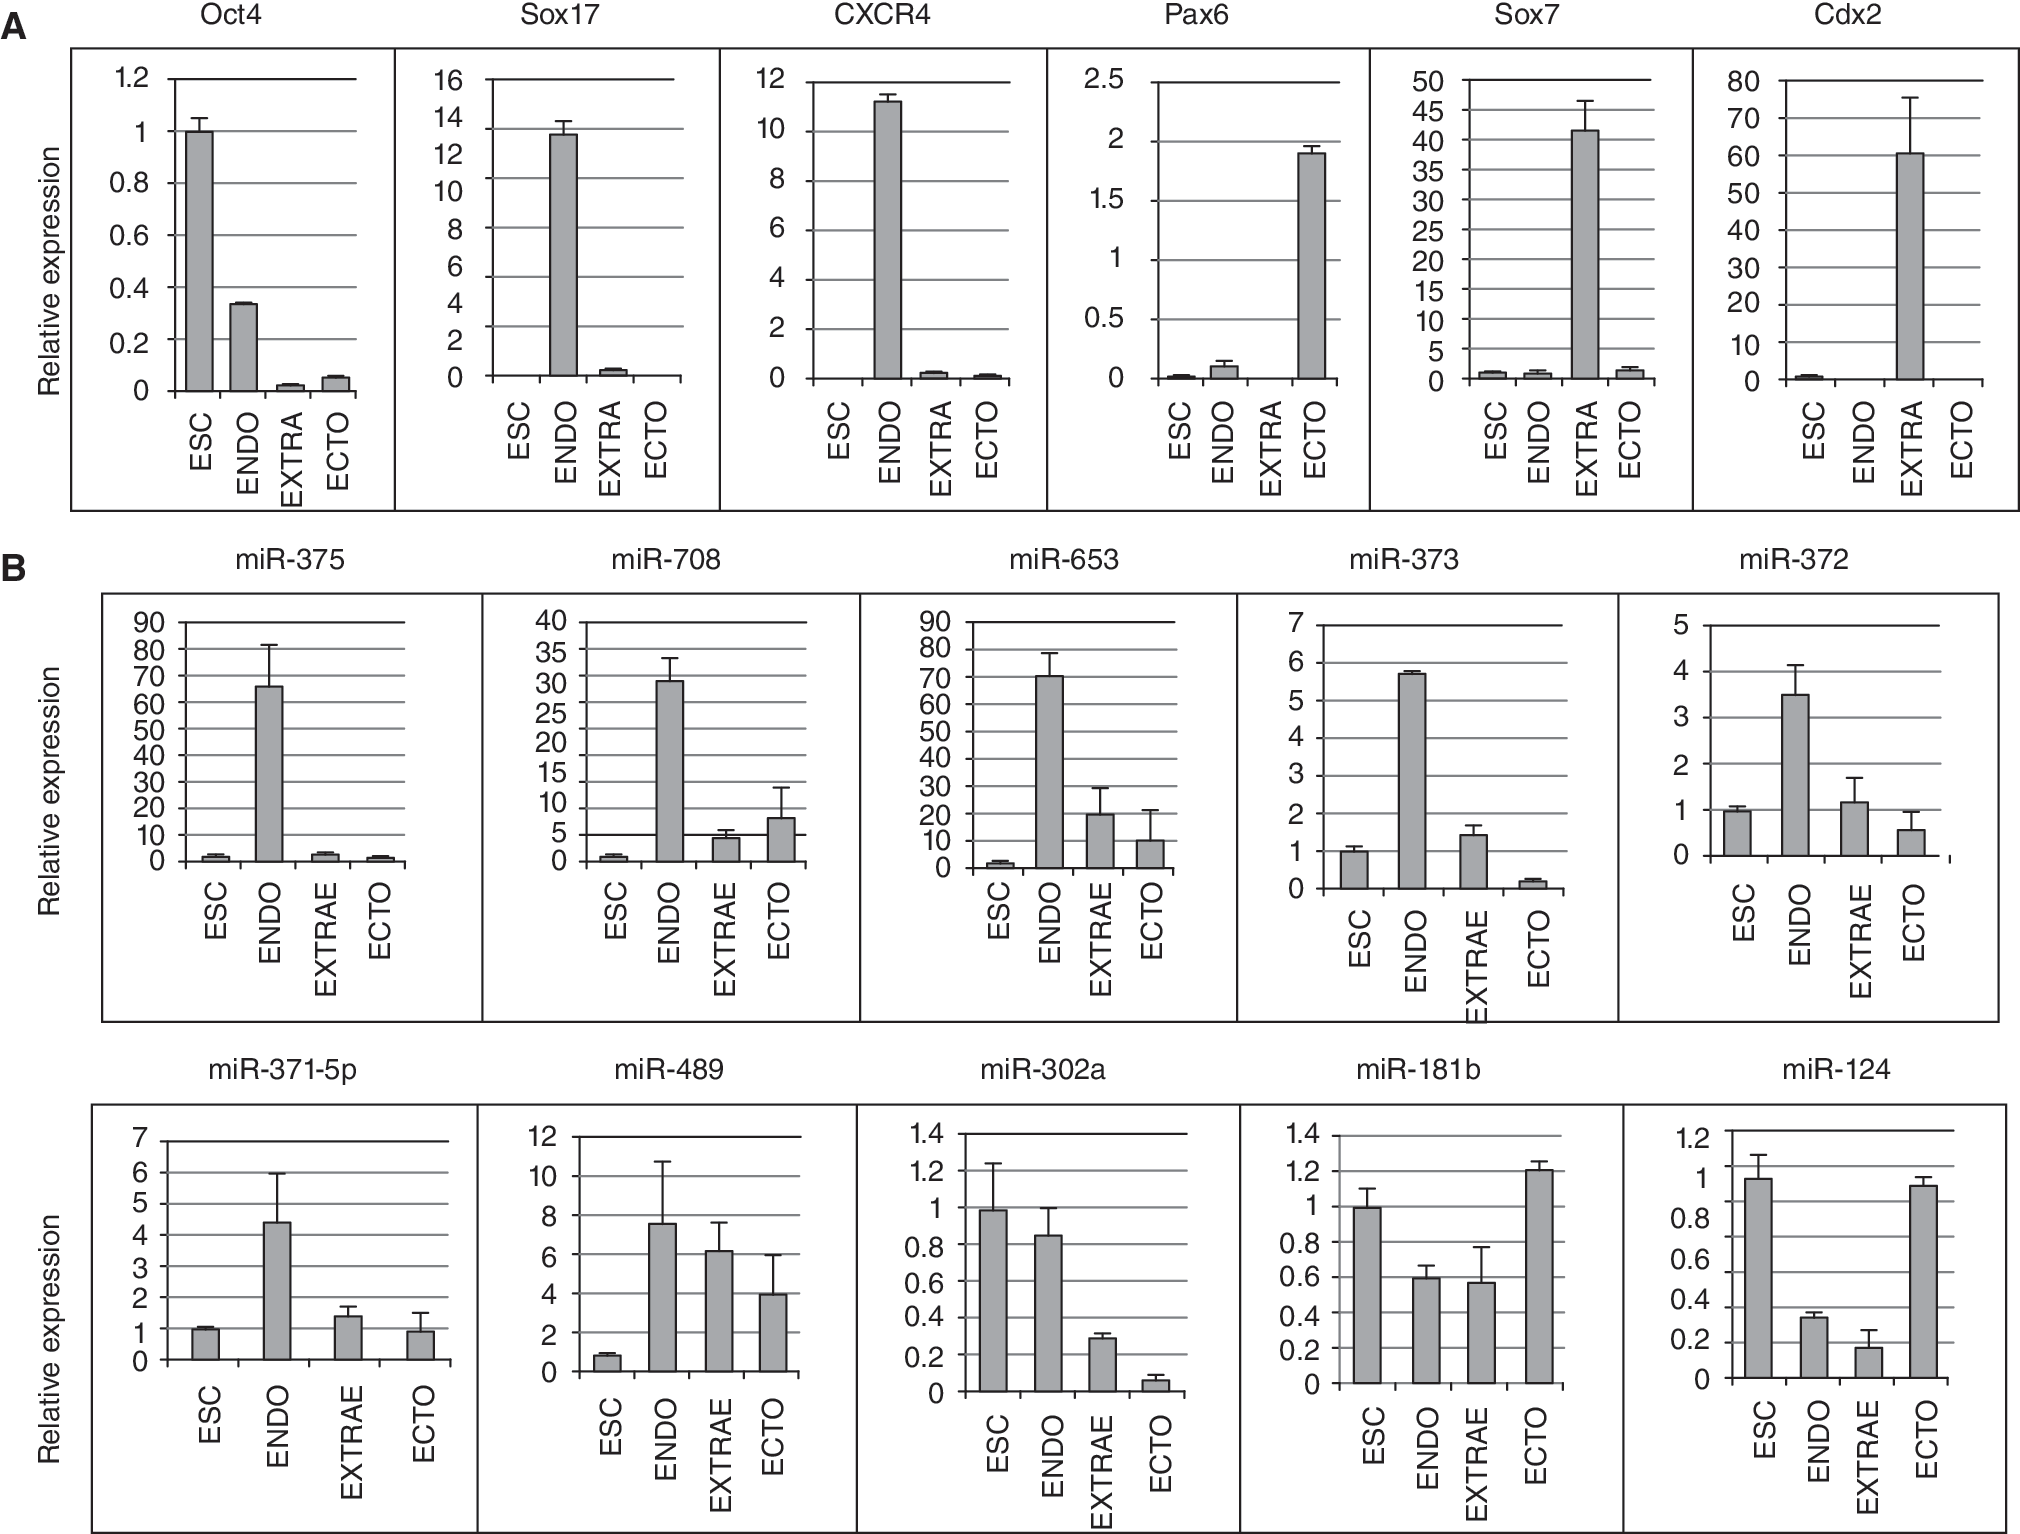
Lineage-specific expression of up-regulated miRNAs. CyT49 cells were treated with low serum for 4 days with the addition of Activin (ENDO), BMP4 + FGFR inhibitor (EXTRAE), or Noggin + ACTR inhibitor (ECTO). Expression of RNA analyzed by qRT-PCR, with levels expressed relative to day 0 RNA (ESC). (
Identification of putative targets for differentially regulated miRNAs
miRNAs have been reported to cause a decrease in levels of mRNA targets that are partially complementary [31]; therefore, we examined mRNAs that were also changed significantly during differentiation in our model system. Because it was the most highly up-regulated miRNA, we focused on miR-375 for target identification. To investigate potential direct targets, miR-375 was exogenously expressed in pluripotent Cyt49 cells by lentiviral transduction of a gene cassette with GFP bearing the miR-375 precursor sequence in its 3′ UTR. After FACS sorting of GFP+ cells, qRT-PCR analysis was performed to determine the effects on RNA levels of several putative targets. A list of putative miR-375 targets tested for RNA analysis is shown in Figure 6A. Putative-binding sites for miRNAs were identified by using computational algorithms at PicTar (
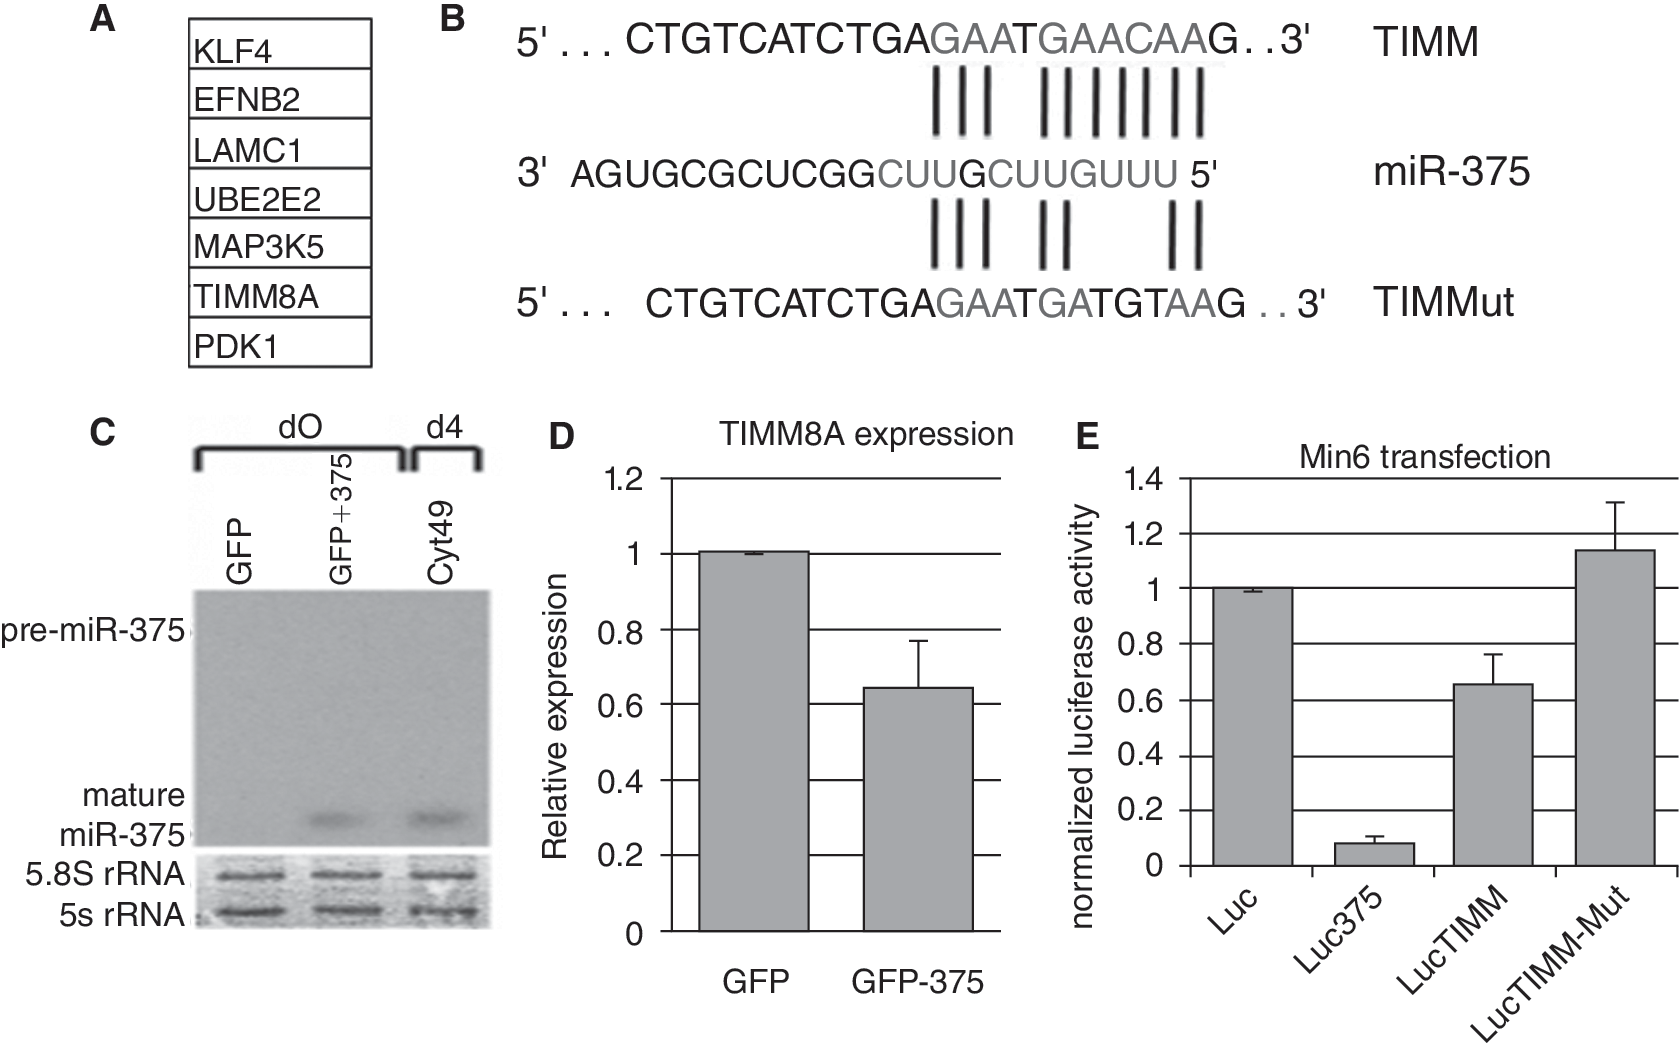
miR-375 suppresses TIMM8A expression in hESCs and in Min6 cells. (
Discussion
In this report, we describe a miRNA profile of DE that is distinct from previously described tissues. This profile is consistent in 2 different cells lines, and under 2 different cell culture conditions. The results show 17 significantly up-regulated miRNAs and 37 significantly down-regulated miRNAs, as well as several predicted miRNAs that have yet to be validated. Four of the up-regulated miRNAs derive from the “star” (*) strand, which is defined as the less dominant form to appear in the mature miRNA after processing of the pre-miRNA by Dicer. Moreover, we identified a set of miRNAs that are expressed at high levels at day 2 of differentiation, and are therefore likely to have roles in endoderm formation. The most striking finding was the robust up-regulation of miR-375 specifically in the endodermal lineage. This miRNA was previously reported to have regulatory roles in later stages of pancreatic development and our results indicate that it may also have an important role in commitment to the endoderm lineage.
MEFs were used for the maintenance of pluripotency with the original hESC lines, and various feeder-free protocols have since been developed in order to grow cells in vitro in the absence of any contaminating animal factors. The experiments in this study further confirm that feeder-free conditions can be used to differentiate hESCs into specific lineages with results that are comparable to MEF-fed cells. The one notable exception was the apparent down-regulation of let-7 family miRNAs in DE cells differentiated from hESCs cultured on feeder cells. While the possibility remains that MEFs secrete factors that induce let-7 expression in hESCs, the relatively high detection of let-7 miRNAs in feeder-fed hESCs provides a note of caution for creating molecular profiles in cell populations that are not completely homogeneous. For the MEF+ differentiations in this study, we estimated that mouse cells constituted <5% of the cell population, yet expression of homologous genes can be sufficiently robust to give a false positive signal in target cells.
Several of the highly up-regulated miRNAs in our model are specifically up-regulated in DE, including miR-375, miR-708, miR-653, miR-373, miR-372, and miR-371-5p (Fig. 5). Although several reports have described unique miRNA signatures for ESCs, most of them compared pluripotent cells to either fully differentiated cells, or hESCs differentiated for slightly longer periods of time than what we have analyzed in this DE model. Furthermore, descriptions of miRNAs in differentiated ESCs have involved protocols, such as embryoid body (EB) formation, expected to result in little to no endoderm formation. Interestingly, several miRNAs reported to have decreasing expression levels in EBs significantly increase in our DE model. Alternatively, some miRNAs up-regulated in DE are also up-regulated in EBs, implicating potential roles in differentiation of several other lineages. Most of our miRNA data that coincide with other studies of differentiated hESCs include the down-regulated miRNAs, further implicating them with a role in maintenance of pluripotency. Interestingly, expression of the miR-371/372/373 cluster has previously been described as specific to hESCs [8,28 –30]. In this report, we confirmed that members of this cluster were highly expressed in hESCs. However, upon differentiation, expression was maintained specifically in DE but decreased in ectodermal and extraembryonic lineages. Unique miRNA signature profiles of specific tissues will obviously be revised as new studies continue to characterize closely related tissues.
Since target mRNA degradation is a common outcome of miRNA regulation, numerous studies have used microarrays to identify targets of specific miRNAs. Overexpression or inhibition of miRNAs can result in down- or up-regulation of genes at the mRNA level, respectively. Potential direct targets are filtered by virtue of harboring 3′ UTR sequences complementary to the miRNA of interest with a focus on pairing to the 5′ end of the miRNA (“seed”). Our computational analyses of genes differentially expressed in hESCs versus DE showed that no seed sequences were specifically enriched in these mRNAs. In our cell differentiation model, dynamic changes in multiple miRNAs may obscure the detection of specific direct mRNA targets. Additionally, genes regulated primarily at the translational level would be missed by the microarray approach and thus not included in computational searches for enriched seeds in regulated genes.
The specific functions of miR-375 in endoderm formation are unclear at this point, although miR-375 has been implicated in regulation of pancreatic development [11] and insulin secretion in mammalian β cells [14]. Because miR-375 is highly and specifically up-regulated early in endoderm differentiation, we sought to identify its targets in hESCs. Selected putative targets were screened for responsiveness to ectopic expression of miR-375 by lentiviral transduction. TIMM8A was the only candidate from the putative target list that decreased in hESCs in response to miR-375 expression, and its putative miR-375-binding site caused repression of luciferase activity when inserted into the 3′ UTR of the luciferase reporter (Fig. 6). The significance of TIMM8A repression in this system is, at this time, unclear, as it has not yet been implicated in any known signaling or developmental pathways. Other putative targets tested did not decrease in miR-375-transduced hESCs. On the other hand, some of them increased in RNA levels, including Pdk1 (data not shown). PdK1 was reported to be down-regulated by miR-375 in β-cells [15], indicating that interactions between miRNAs and potential targets may be dependent on cellular context. It is possible that pluripotent hESCs lack some necessary factors that facilitate miRNA targeting and are present only in differentiating cells, or that perhaps proteomic analysis would be necessary to detect translational inhibition. It is also possible that miR-375 targets with clearer roles in the induction of non-endodermal lineages do not appear in our screen, which is not permissive for their expression.
miRNAs down-regulated during ESC to DE differentiation are possibly implicated in the Activin/Nodal pathway that is central to endoderm formation since they must be present in pluripotent cells to inhibit differentiation. Supplementary Figure 3 illustrates the pathway containing several genes that are putative targets for differentially regulated miRNAs. Several down-regulated miRNAs are potentially targeting the Activin receptor type II (ACVR2), which increases during endoderm specification. Moreover, some down-regulated miRNAs that inhibit endoderm formation specifically may be necessary for specification of alternate lineages. For example, miR-181b and miR-124 potentially target ACVR2, and also exhibit increasing RNA levels in the ectodermal lineage in our study (Fig. 5). miR-124 also has been reported to increase during neuronal lineage specification [32]. Interestingly, miR-302a is expressed in hESCs and, upon differentiation, is maintained specifically in the endodermal lineage (Fig. 5). This result is in accordance with a recent report that miR-302a promotes the mesendodermal lineage in hESCs at the expense of neurectoderm formation [33]. The described mechanism of miR-302a in differentiating hESCs is the repression of Lefty, an inhibitor of the Activin/Nodal pathway.
In conclusion, we have characterized a profile of miRNAs that is induced during DE formation in a hESC differentiation model. Several miRNAs are differentially regulated in 2 cell lines and in both the presence and absence of a MEF feeder layer. Selected up-regulated miRNAs were induced in hESC-derived endoderm, but not in ectodermal or extra-embryonic lineages. The unique miRNA signature described herein is clearly distinct from other miRNA profiles reported in differentiated ESCs; this is most likely due to the timing and specificity of DE differentiation. These miRNAs could be used as markers to monitor lineage-specific differentiation protocols. Endoderm-specific up-regulation was also demonstrated for miR-375, a miRNA that has been previously implicated in pancreatic development. Further investigation of this and other miRNAs in this cell lineage may provide insights into regulatory networks that control development.
Footnotes
Acknowledgments
This work was supported by grants from the Juvenile Diabetes Research Foundation (35–2008-622), the Larry L. Hillblom Foundation, and from the Emerald and Keck Foundations. We thank Kevin D'Amour for valuable technical assistance with hESC differentiation protocols. We also thank Ayse Kiyali and William Strauss for their helpful suggestions during the preparation of this manuscript.
Author Disclosure Statement
The authors indicate no potential conflicts of interest.
References
Supplementary Material
Please find the following supplemental material available below.
For Open Access articles published under a Creative Commons License, all supplemental material carries the same license as the article it is associated with.
For non-Open Access articles published, all supplemental material carries a non-exclusive license, and permission requests for re-use of supplemental material or any part of supplemental material shall be sent directly to the copyright owner as specified in the copyright notice associated with the article.