
Abstract
Several innovative therapies with human umbilical cord blood stem cells (SCs) are currently developing to treat central nervous system (CNS) diseases. It has been shown that cord blood contains multipotent lineage-negative (LinNEG) SCs capable of neuronal differentiation. Clinically useful cord blood samples are stored in different biobanks worldwide, but the content and neurogenic properties of LinNEG cells are unknown. Here we have compared 5 major methods of blood processing: Sepax, Hetastarch, plasma depletion, Prepacyte-SC, and density gradient. We showed that Sepax-processed blood units contained 10-fold higher number of LinNEG cells after cryopreservation in comparison to all other methods. We showed in this study that multipotent SCs derived from fresh and frozen cord blood samples could be efficiently induced in defined serum-free medium toward neuronal progenitors (NF200+, Ki67+). During neuronal differentiation, the multipotent SCs underwent precise sequential changes at the molecular and cellular levels: Oct4 and Sox2 downregulation and Ngn1, NeuN, and PSD95 upregulation, similar to neurogenesis process in vivo. We expect that data presented here will be valuable for clinicians, researchers, biobanks, and patients and will contribute for better efficacy of future clinical trials in regeneration of CNS.
Introduction
Various techniques of blood processing are used by major biobanks worldwide, providing different yield of MNCs and CD34+ cell. Recently, we have shown that processing methods had significant influence on hematopoietic SC number and survival after cryopreservation [15]. Considering the therapies of CNS, we have described a unique population of nonhematopoietic, multipotent, lineage-negative (LinNEG) SCs capable for robust neuronal differentiation [16,17]. Similar fractions of immature SCs present in cord blood have also been reported by other groups [18,19]. Also, the amount and quality of these lineage-negative multipotent SCs remain unknown in the cryostored cord blood units available at different private and public biobanks. In this study, we compare different processing methods, which have a significant influence on multipotent SC content in cryopreserved cord blood units used for therapy.
Systemic infusion of naive MNCs isolated from cord blood has been shown effective in a number of preclinical studies and ongoing clinical trials on CNS therapy [2,9 –12,20]. It seems that MNCs contain a population of immature SCs, revealing strong trophic and immunomodulatory effects on the injured brain tissue, which reduces inflammation and glial scar formation and stimulates endogenous neurogenesis and brain repair processes [2,21]. However, very few preclinical studies reported engrafted cells with neuron-like characteristic to be found in the brain tissue [3,21,22]. Systemic delivery of naive MNCs isolated from cord blood units can be therefore considered as an equivalent of pharmacotherapy. However, very limited self-repair capacity of human brain requires administration of exogenous neuroblasts capable of replacing of lost brain circuits in situ of the injury.
We have previously shown that tissue-engineered neuronal networks derived from cord blood–originated multipotent SCs could spontaneously generate an electric action potential in vitro [9]. Recently, several innovative clinical approaches have been initiated to use neuronally induced cells for regeneration of damaged neurons [23 –27]. A positive effect of direct intracranial transplantation of neuroblasts was previously confirmed in several preclinical studies [28 –30]. A most recent case study has shown a positive effect of intraventricular administration of neuronally committed cord blood SCs into a 16-month-old child after global brain ischemia [23]. Further development of such advanced methods of CNS therapy requires, however, more detailed knowledge about the molecular and cellular changes occurring during neuronal induction of multipotent SCs in vitro.
We have already shown in the rat brain organotypic model that successful integration of grafted cells was dependent on their previous neuronal induction [31,32]. The readiness of grafted cells to respond to molecular signals in the host brain tissue determines their survival and differentiation fates. These observations were also confirmed in in vivo studies in which cell survival and proper axonal sprouting were dependent on neuronal stimulation preceding transplantation [30,33]. In this work, we present a detailed molecular and cellular analysis of sequential changes that occur during neuronal induction and differentiation of cord blood multipotent SCs in vitro.
Materials and Methods
Collection of the cord blood samples
Human cord blood samples were collected from the Maternity Unit at The Royal Victoria Infirmary, Newcastle upon Tyne, UK, and from The Hospital Privé Natecia, Lyon, France, only after written and informed consent was obtained from the parents. The collection and consenting protocols were reviewed and approved by the local ethics committee in France and UK. A negative viral and infection status was required for all collected samples. For logistical reasons, samples were collected from both normal deliveries and caesarean sections (n=82). Collection of blood was performed according to a previously described protocol [15]. All umbilical cord blood samples used in this study were processed within 24 h from collection time.
Processing methods
Freshly isolated cord blood samples were processed with 5 different methods used in major public and private biobanks worldwide: Hetastarch (Baxter; n=19), plasma depletion (n=17), Sepax (Biosafe; n=15), Prepacyte-CB (BioE; n=24), and density gradient separation such as Ficoll-Paque™ PREMIUM (GE Healthcare; n=2) or Lymphoprep (Greiner Bio-One; n=5). Total MNCs were separated according to the protocols previously described for density gradient separation [16] and for Hetastarch and Prepacyte-CB separations [15].
Plasma depletion selection
A sterile collection bag (Baxter) with blood was connected to a 300-mL transfer bag (Baxter) so the product was allowed to flow through. The collection bag was thoroughly mixed prior to removing the sample. After blood transfer, the tubing and collection bag were removed and heat sealed. A scale was used to balance a bag for subsequent centrifugation: 10 min at 460 g (temperature: 15°C–26°C). Subsequently, the bag was carefully removed from the centrifuge and placed on a plasma extractor (Baxter). A new 150-mL waste bag (Baxter) was connected to collect plasma. The hemostat was clamped on the transfer bag tubing near the spike and the bag was placed onto an electronic scale. The hemostat was slowly released to allow the calculation plasma volume flow. Tubing was reclamped after transfer of plasma and the transfer bag was removed from the plasma extractor. The bag was thoroughly mixed and immediately moved for cryopreservation.
Sepax separation—an automated blood processing system
This method allows separation in a closed and sterile system, which is controlled by a computer software. Sepax could isolate the SC-rich buffy coat of MNCs to a final volume of 10–90 mL. Each unit was separated with a single-use kit, which was inserted into the machine. The cord blood was added to the machine, where it filled the central rotating chamber. While filling, the sample was spun at a speed of up to 1,900 g and the blood components were concentrically separated. Then, using optical sensors and motorized stopcocks, the blood components were directed to individual blood bags (see also at presentation on Biosafe website:
The 1 mL samples were taken for analysis from fresh blood units [Pre] and immediately after all processing [Post].
Cell counting
Total number of MNCs was measured in fresh blood samples [Pre], after processing [Post], and after thaw [Thaw]. The cells were counted with an automatic hematological cell counter Coulter AC T diff2 (Beckton Coulter). Cell viability was assessed by manual counting of the cells stained with Trypan Blue (1:1; Sigma).
Absolute number of LinNEG cells was calculated as t N×t R×t V×l N, where t N is total number of MNCs in fresh blood, t R is percentage of MNCs recovery at each step related to t N, t V is percentage of MNC viability at each step, and l N is percentage of LinNEG cells in MNC fraction at each step.
Immunomagnetic separation of LinNEG cells
We used MACS technique (Miltenyi Biotec) for cord blood depletion from cells of hematopoietic lineage. Before separation, cord blood units were processed with density gradient technique described earlier. The obtained MNCs were immediately mixed with the StemSep Human Primitive Hematopoietic Progenitor Cell Enrichment Cocktail (Miltenyi Biotec) containing antibodies against 12 antigens: CD2, CD3, CD14, CD16, CD19, CD24, CD36, CD38, CD45RA, CD56, CD66b, and glycophorin A. The labeling was performed according to the manufacturer's recommendations. All procedures were performed on ice-cooled equipment and media to increase cell viability. Labeled MNCs were separated in ice-cooled LS columns placed in MidiMACS separator (Miltenyi biotec). The separation was performed by gravity force and the plunger was gently used only at the final step of separation. After separation, cells were immediately moved to appropriate culture media or for analysis.
Neuronal differentiation
The LinNEG cells and MNCs (fresh and frozen) were exposed to a 3-step protocol of neuronal differentiation in defined serum-free media as previously described [16]. In brief—first step (neuronal induction): at day 0 the naïve LinNEG or MNCs were seeded on round glass inserts [coated with collagen IV (Sigma)] and placed in standard 24-well plates (NUNC) for confocal analysis, calcium imaging or directly seeded in plastic 96 or 24-well plates (NUNC) for epifluorescence microscopy or in plastic T25 culture bottles (25 cm2) (NUNC) for RT-PCR and cytogenetics. Regardless of the culture plates type, the cells were placed at the same density of 0.5–1×10⁷ cell/mL of serum-free culture medium: neurobasal medium (Invitrogen), B27 (1:100) (Invitrogen), N2 (1:50) (Invitrogen), SCF (5 ng/mL) (ImmunoTools), epidermal growth factor (EGF) (20 ng/mL) (ImmunoTools), basic fibroblast growth factor (bFGF) (20 ng/mL) (ImmunoTools), heparin (5 μg/mL) (Sigma), fibronectin (1 μg/mL) (Sigma), and antibiotics (1:100) (Lonza). After 10 days of neuronal induction, differentiation medium was introduced (step 2): neurobasal medium (Invitrogen), B27 (1:50) (Invitrogen), N2 (1:25) (Invitrogen), EGF (10 ng/mL) (ImmunoTools), brain-derived neurotrophic factor (BDNF) (20 ng/mL) (ImmunoTools), retinoic acid (5 μM) (Sigma), fibronectin (1 μg/mL) (Sigma), and antibiotics (1:100) (Lonza). Subsequently, after 1 week of differentiation, the maturation medium was introduced at day 17 (step 3): neurobasal medium (Invitrogen), B27 (1:50) (Invitrogen), N2 (1:25) (Invitrogen), EGF (10 ng/mL) (ImmunoTools), BDNF (20 ng/mL) (ImmunoTools), nerve growth factor (NGF) (10 ng/mL) (ImmunoTools), cell membrane-permeable di-Butyryl cyclic AMP (dBcAMP) (100 μM) (Sigma), retinoic acid (5 μM) (Sigma), fibronectin (1 μg/mL) (Sigma), and antibiotics (1:100) (Lonza). Maturation was performed for 1 week until the end of experiment at day 24. Half of the medium was changed every 2 days. Cells were cultured in the incubator supporting the 37°C, 5% CO2, and 95% humidity.
Flow cytometry analysis
FACS analysis was performed on Becton Dickinson FACSCalibur machine. Description of the cells immunolabeling, washing, and scanning techniques were previously described [34]. FACS data were analyzed using Cyflogic 1.2.1 software (CyFlo Ltd.). Gates were set based on selecting the mononuclear cells fraction (7AAD- and CD235a-negative cells) as the total population of MNCs. Linage-negative cells were selected from MNCs by being negative for CD7, CD33, and CD45 markers colabeling as described previously [6,16]. The antibodies used for FACS analysis are described in Table 1.
First letter in the isotype description indicates host animal (M, mouse; R, rabbit; G, goat), second letter indicates polyclonal (P) or monoclonal (M) antibody, and abbreviation at the end indicates immunoglobulin isotype of an antibody including isotype subtype.
Cryopreservation of umbilical cord blood samples
We used 2 methods for cryopreservation of processed cord blood units: (1) clinical-grade computer-controlled cryopreservation in liquid nitrogen and (2) research-grade cryopreservation in isopropanol at −80°C. The first method was used for FACS analysis of LinNEG cells in the cord blood units processed with 5 different techniques described above. Samples stored in isopropanol were used for neuronal differentiation of MNCs and LinNEG cells. Description of clinical-grade cryopreservation technique: cord blood units were cooled to 4°C before being transferred to a cryostore bag (Quest Biomedical), filled with dimethyl sulfoxide (DMSO) (Origen), mixed with Dextran 40 (Baxter Healthcare), and precooled to 4°C. Both components were added to a final concentration of 10%. The samples were cryopreserved in a controlled rate freezer Kryo 560–16 (Planar) using the following parameters: start temperature=4°C, step 1=hold at 4°C for 10 min, step 2=−2°C /min to−5°C, step 3=−1°C /min to −40°C, step 4=−5°C/min to −100°C. Subsequently, samples were transferred to the vapors of liquid nitrogen. Description of isopropanol cryopreservation: immediately after separation MNCs were mixed with serum-free cryopreservation medium Cryo-3 (Stem Alpha) containing 10% DMSO (Sigma) in 2 mL cryotubes (NUNC). Cells were mixed thoroughly and the cryotubes were immediately transferred to a cryobox filled with isopropanol and then placed at −80°C. The isopropanol allowed a slow decrease of sample temperature at a rate of −1°C/min.
All samples were frozen for a minimum of 14 days before thawing.
Immunostaining
Floating cells were attached to the glass slides covered with silan (Sigma) by centrifugation in the cytospin (Shandon) for 3 min at 25 g. Adherent cells were dried and washed with PBS before fixation. Cells were fixed with Accustain (Sigma) at room temperature (20 min). For surface marker analysis, 4% paraformaldehyde (Fisher Scientific) solution was used as fixative. Nonspecific binding epitopes were blocked with 5% albumin (Sigma) and 5% goat serum (Sigma) in PBS (1 h in room temperature). For internal marker exposition, cell membranes were permeabilised with 1% Triton X-100 solution in PBS (Sigma) (1 h in room temperature). The primary antibodies, indicated in Table 1, were diluted in PBS and added to the cells for over-night incubation at 4°C. Subsequently, after washing, the appropriate secondary antibodies were used against the primary antibodies host isotype: Alexa Fluor 488 (green), Alexa Fluor 546 (red), or Alexa Fluor 594 (red), all at a dilution of 1:1,000 (Invitrogen), and incubated in the dark for 1 h at room temperature.
RT-PCR
Total RNA was extracted with TRIzol (Invitrogen) from MNCs obtained from cord blood units processed with Ficoll according to the manufacturer protocol. RNA was extracted from (1) naïve freshly isolated MNCs (Naïve MNCs), (2) neuronal SCs generated from naïve MNCs after 10 days induction (see neuronal differentiation methods), and (3) neuronal SCs generated from cryopreserved MNCs after 10 days induction (see neuronal differentiation). Total RNA from a human brain tissue (Invitrogen) was used as a positive control. DNA was synthesized from 500 ng of mRNA, using the High capacity cDNA reverse transcription Kit (Invitrogen). Reverse transcription was performed in a final reaction volume of 20 μL and carried out on a Bibby Thermal Cycler TC-512 (Techne) with thermal conditions suggested by manufacturer. Negative controls were performed with the same cDNA synthesis reaction but without addition of the reverse transcriptase enzyme. Real-time PCR was carried out on a Mastercycler ep realplex2 (Eppendorf), 4 μL of RT product (100 ng) was used as template in the presence of 0.5 μL of forward and reverse gene-specific primers (Table 2), and 10 μL of EXPRESS SYBR® GreenER™ qPCR Supermix Universal (Invitrogen) in a final reaction volume of 20 μL. Brain internal GAPDH-positive CTRL and a standard curve of 2 internal glyceraldehyde-3-phosphate dehydrogenase and r18S house keeping genes for each sample were performed using the same method and plate. Negative controls were performed for every sample using the same cDNA synthesis reaction but without the addition of the reverse transcriptase enzyme. Cycling conditions were 2 min at 95°C, 40 cycles of 3 s denaturation at 95°C, and 30 s annealing at optimal annealing temperature for each specific primer. Ct data were captured by Eppendorf Mastercycler ep realplex 2.2 software with threshold in CalQplex method. The relative gene expression level (2 ^ (−ΔCt)) was calculated by ΔCt=Ct (Gene of Interest) – (Average [Ct (House Keeping Gene)]) as an average of 2 samples for every T-test. A fold change of >2 was considered as significant. Data obtained were selected by P<0.05.
Karyotyping
Cells were exposed to 0.7% colcemid (Invitrogen) diluted in the induction culture medium for 3 h. Subsequently, cells were detached with trypsin (Invitrogen) and centrifuged, and the pellet was re-suspended in 0.075 M KCl for 2 min in room temperature. Cells were then centrifuged again, re-suspended in the fixative [methanol with acetic acid (3:1)], and stored at −20°C for at least 2 days. G-band staining was performed in Giemsa/Leishman's staining solution.
Calcium imaging
Imaging of intracellular calcium level was performed as previously described [35]. In short, cells after maturation (day 24) was loaded with Oregon Green 488 Bapta 1 (OGB1)-AM ester (Molecular Probes-Invitrogen) mixed with 8 μL DMSO and 2 μL pluronic acid F-127 solution (10% in DMSO; Molecular Probes-Invitrogen) diluted in culture medium. The final concentrations were OGB1-AM ester ∼12 μM; 0.6% DMSO and 0.002% Pluronic F-127. The cultures were incubated for 30–40 min at 37°C and then washed and transferred to the recording chamber, which was mounted on an upright Olympus BX51 DSU confocal microscope (Olympus) fitted with Scientifica Patchmaster micromanipulators (Scientifica). In the recording chamber, the cultures were bathed in a continuously flowing stream (1–3 mL/min) of artificial cerebrospinal fluid (ACSF: NaCl 125 mM; NaHCO3 26 mM; glucose 10 mM; KCl 3.5 mM; CaCl2 1.2 mM; NaH2PO4-1.26 mM; MgSO¬4 1 mM). Glutamate (1 mM in ACSF) was applied directly from patch pipettes (5–7 MΩ when filled with K-methylsulfate patching solution) using a picospritzer. The timing of the pressure applications was controlled using the Master 8 pulse stimulator (Digitimer). We calculated that the average bolus for a 10 ms pressure application through these pipettes was about 1.6 nL.
Image processing and statistical analysis
The confocal imaging of immunostained cells was performed by LSM 510 confocal system (Zeiss). The images were analyzed with LSM Image Browser software (Zeiss). The epifluorescence images and DIC transmitted light images were performed by inverted microscope Eclipse Ti-S (Nikon) equipped with cooled digital camera DS-Ri1 (Nikon). The images were analyzed with NIS-Elements software (Nikon) and figures were produced in Corel Draw v. 14 (Corel Corp.) with necessary linear adjustments of contrast and brightness. Scanning electron microscopy (SEM) images were obtained in Electron Microscopy Research Services at Newcastle University, Newcastle upon Tyne, UK. Cambridge Stereoscan 240 microscope was used for digital images collection.
The calcium influx spike image series were detected by Olympus BX51 DSU confocal microscope (Olympus) equipped with a C9100/13 Hamamatsu camera (Hamamatsu) connected to a Dell personal computer running Digital Pixel software. The camera collected the images series at 10 Hz. Subsequently, the images were analyzed by ImageJ software (NIH). The digitized values of fluorescence intensity obtained from selected representative region of interests were transferred to spread sheet document and further analyzed by Excel software (Microsoft).
Statistical analysis was carried out using the statistical software Prism GraphPad. The data were analyzed using nonparametric, one-way ANOVA Kruskal–Wallis test with Dunns post-test comparison. Real-time PCR data were compared between the test and control plates and statistical significance was assessed by T-test. A P<0.05 was considered to be statistically significant. All the experiments were at least doubled and performed on SCs isolated from minimum of 2 independent donors. The results are presented as mean±SD.
Results
Cord blood processing methods significantly influence the amount and viability of multipotent LinNEG cells
Average volume of collected cord blood unit was 97.46±32.04 mL (n=82), and the amount of MNCs in single cord blood unit was 931.19×10⁶ cells±439.68×10⁶ cells, with the viability of 95.54%±6.77%. We have characterized the multipotent lineage-negative SCs (LinNEG) in freshly isolated human umbilical cord blood samples [Pre] in comparison to the samples after clinical grade processing (mononucleated cells separation) [Post] and following cryopreservation in a liquid nitrogen control rate freezer [Thaw] (Fig. 1). FACS analysis revealed the LinNEG cells as a very small cell faction negative for hematopoietic markers of myeloid lineage CD33, protein tyrosine phosphatase CD45, and T cells marker CD7 (Fig. 1A, B, C, respectively). The fraction of LinNEG cells is indicated in red on Fig. 1A–C and constitutes 0.67%±0.4% (n=28) of total MNCs isolated from fresh umbilical cord blood units (Fig. 1D). The number of LinNEG cells and MNCs significantly decreased after processing but the main drop of the cells number occurred after cryopreservation and thawing (Fig. 1D, E). We have investigated an influence of 5 different processing methods: Sepax, Hetastarch, Plasma depletion, Prepacyte-SC, and Density gradient on LinNEG cells amount and viability. Our data showed that separation with Prepacyte and Sepax methods significantly gave the highest percentage of LinNEG cells in MNCs after processing [Post] (0.7%±0.16% and 0.55%±0.32%, respectively) and after cryopreservation [Thaw] (0.62%±0.11% and 0.65%±0.34%, respectively) in the relative values to total MNCs at each step (Fig. 1D). However, the relative values did not corresponded to absolute number of LinNEG cells due to low recovery of MNCs processed with Prepacyte method (Fig. 1E).
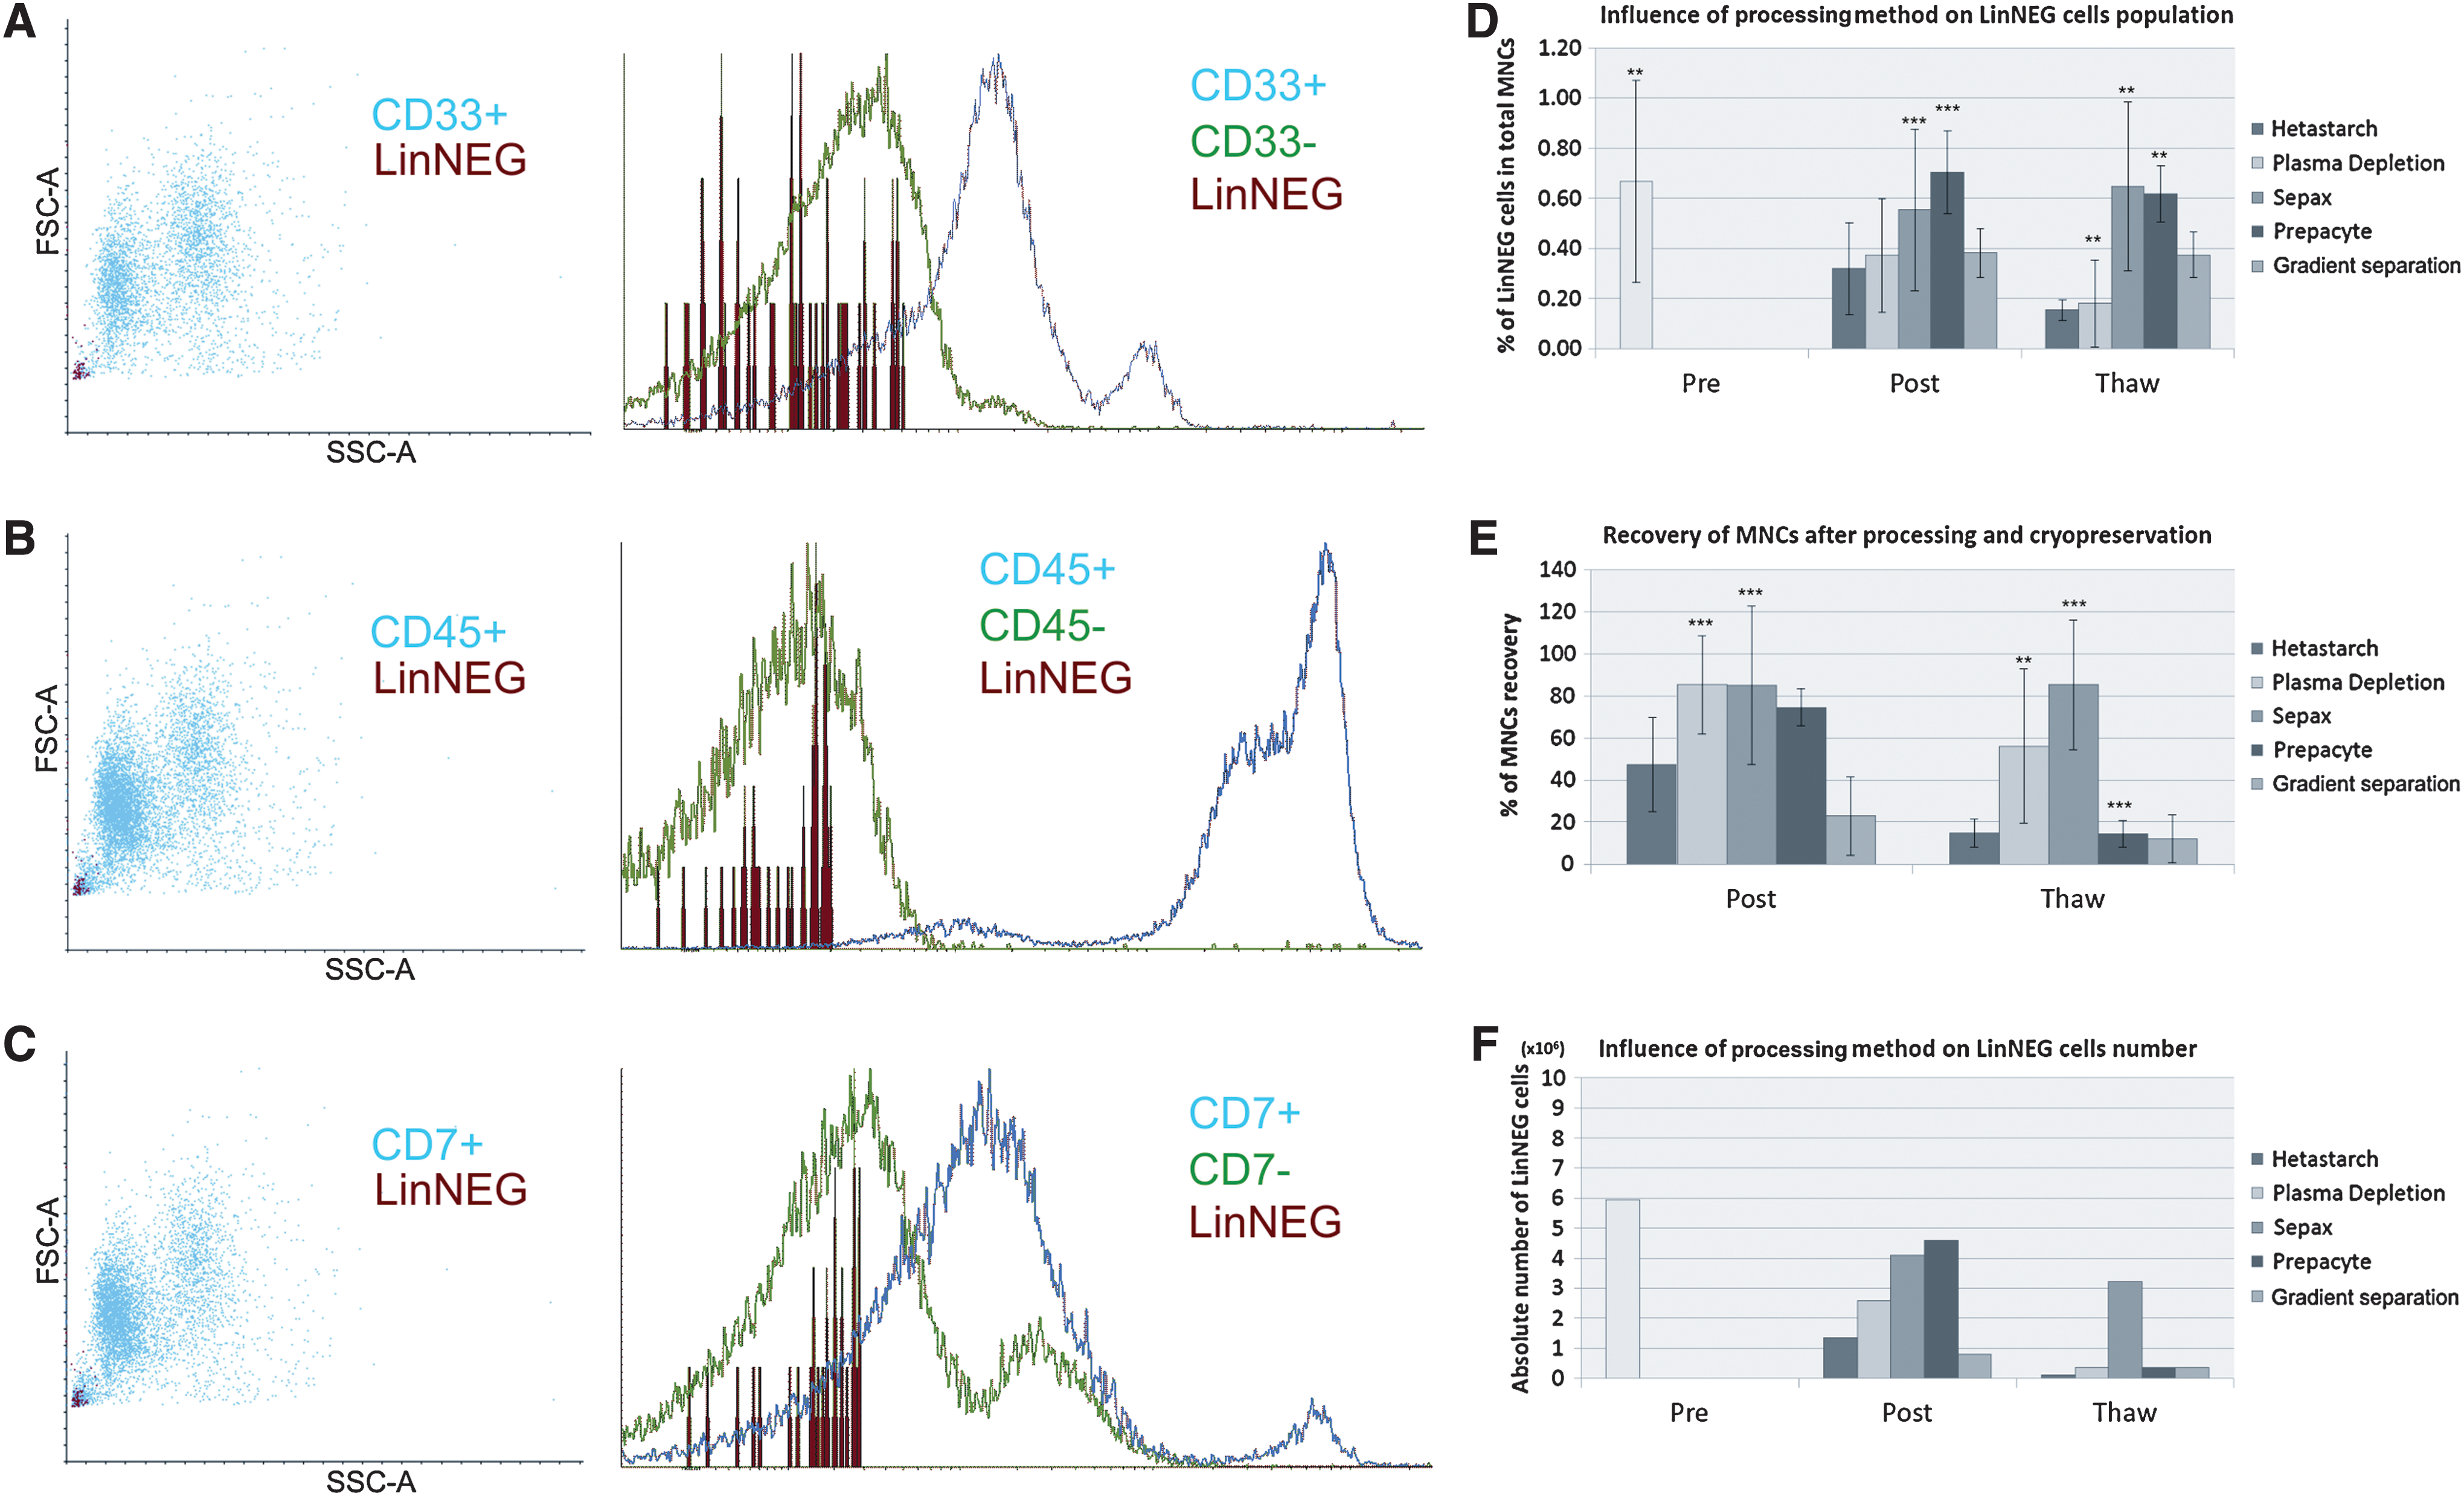
FACS analysis of LinNEG cells population in cord blood units. LinNEG cells are indicated in red among CD33+
Calculation of absolute LinNEG cells number (see formula in the Materials and Methods section) revealed a significantly higher real number of LinNEG cells available after thawing from Sepax-processed units in comparison to other processing methods (Fig. 1F). Cryopreserved blood samples processed with Sepax gave an average number of 3.23×10⁶ LinNEG cells per cord blood sample, corresponding to 46% decrease of their initial number present in the fresh cord blood (Fig. 1F). Cord blood units processed by the other 4 methods gave an average number of ∼0.3×10⁶ LinNEG cells per cord blood sample after thawing (Fig. 1F).
Sequential neuronal differentiation of LinNEG cells in vitro resembles neurogenesis steps in vivo
To investigate the neurogenic potential of nonhematopoietic SCs present in the umbilical cord blood units, we used MACS technique to isolate the most immature lineage-negative SCs (LinNEG). Freshly isolated naïve LinNEG cells were very small and nonadherent (Fig. 2A), and expressed markers typical for pluripotent SCs: Oct4, Sox2, Nanog, and Ki67 (Fig. 2C and Supplementary Fig. S1; Supplementary Data are available online at

A sequence of morphological changes in LinNEG cells during the 3-step neuronal differentiation. Naïve floating LinNEG cells
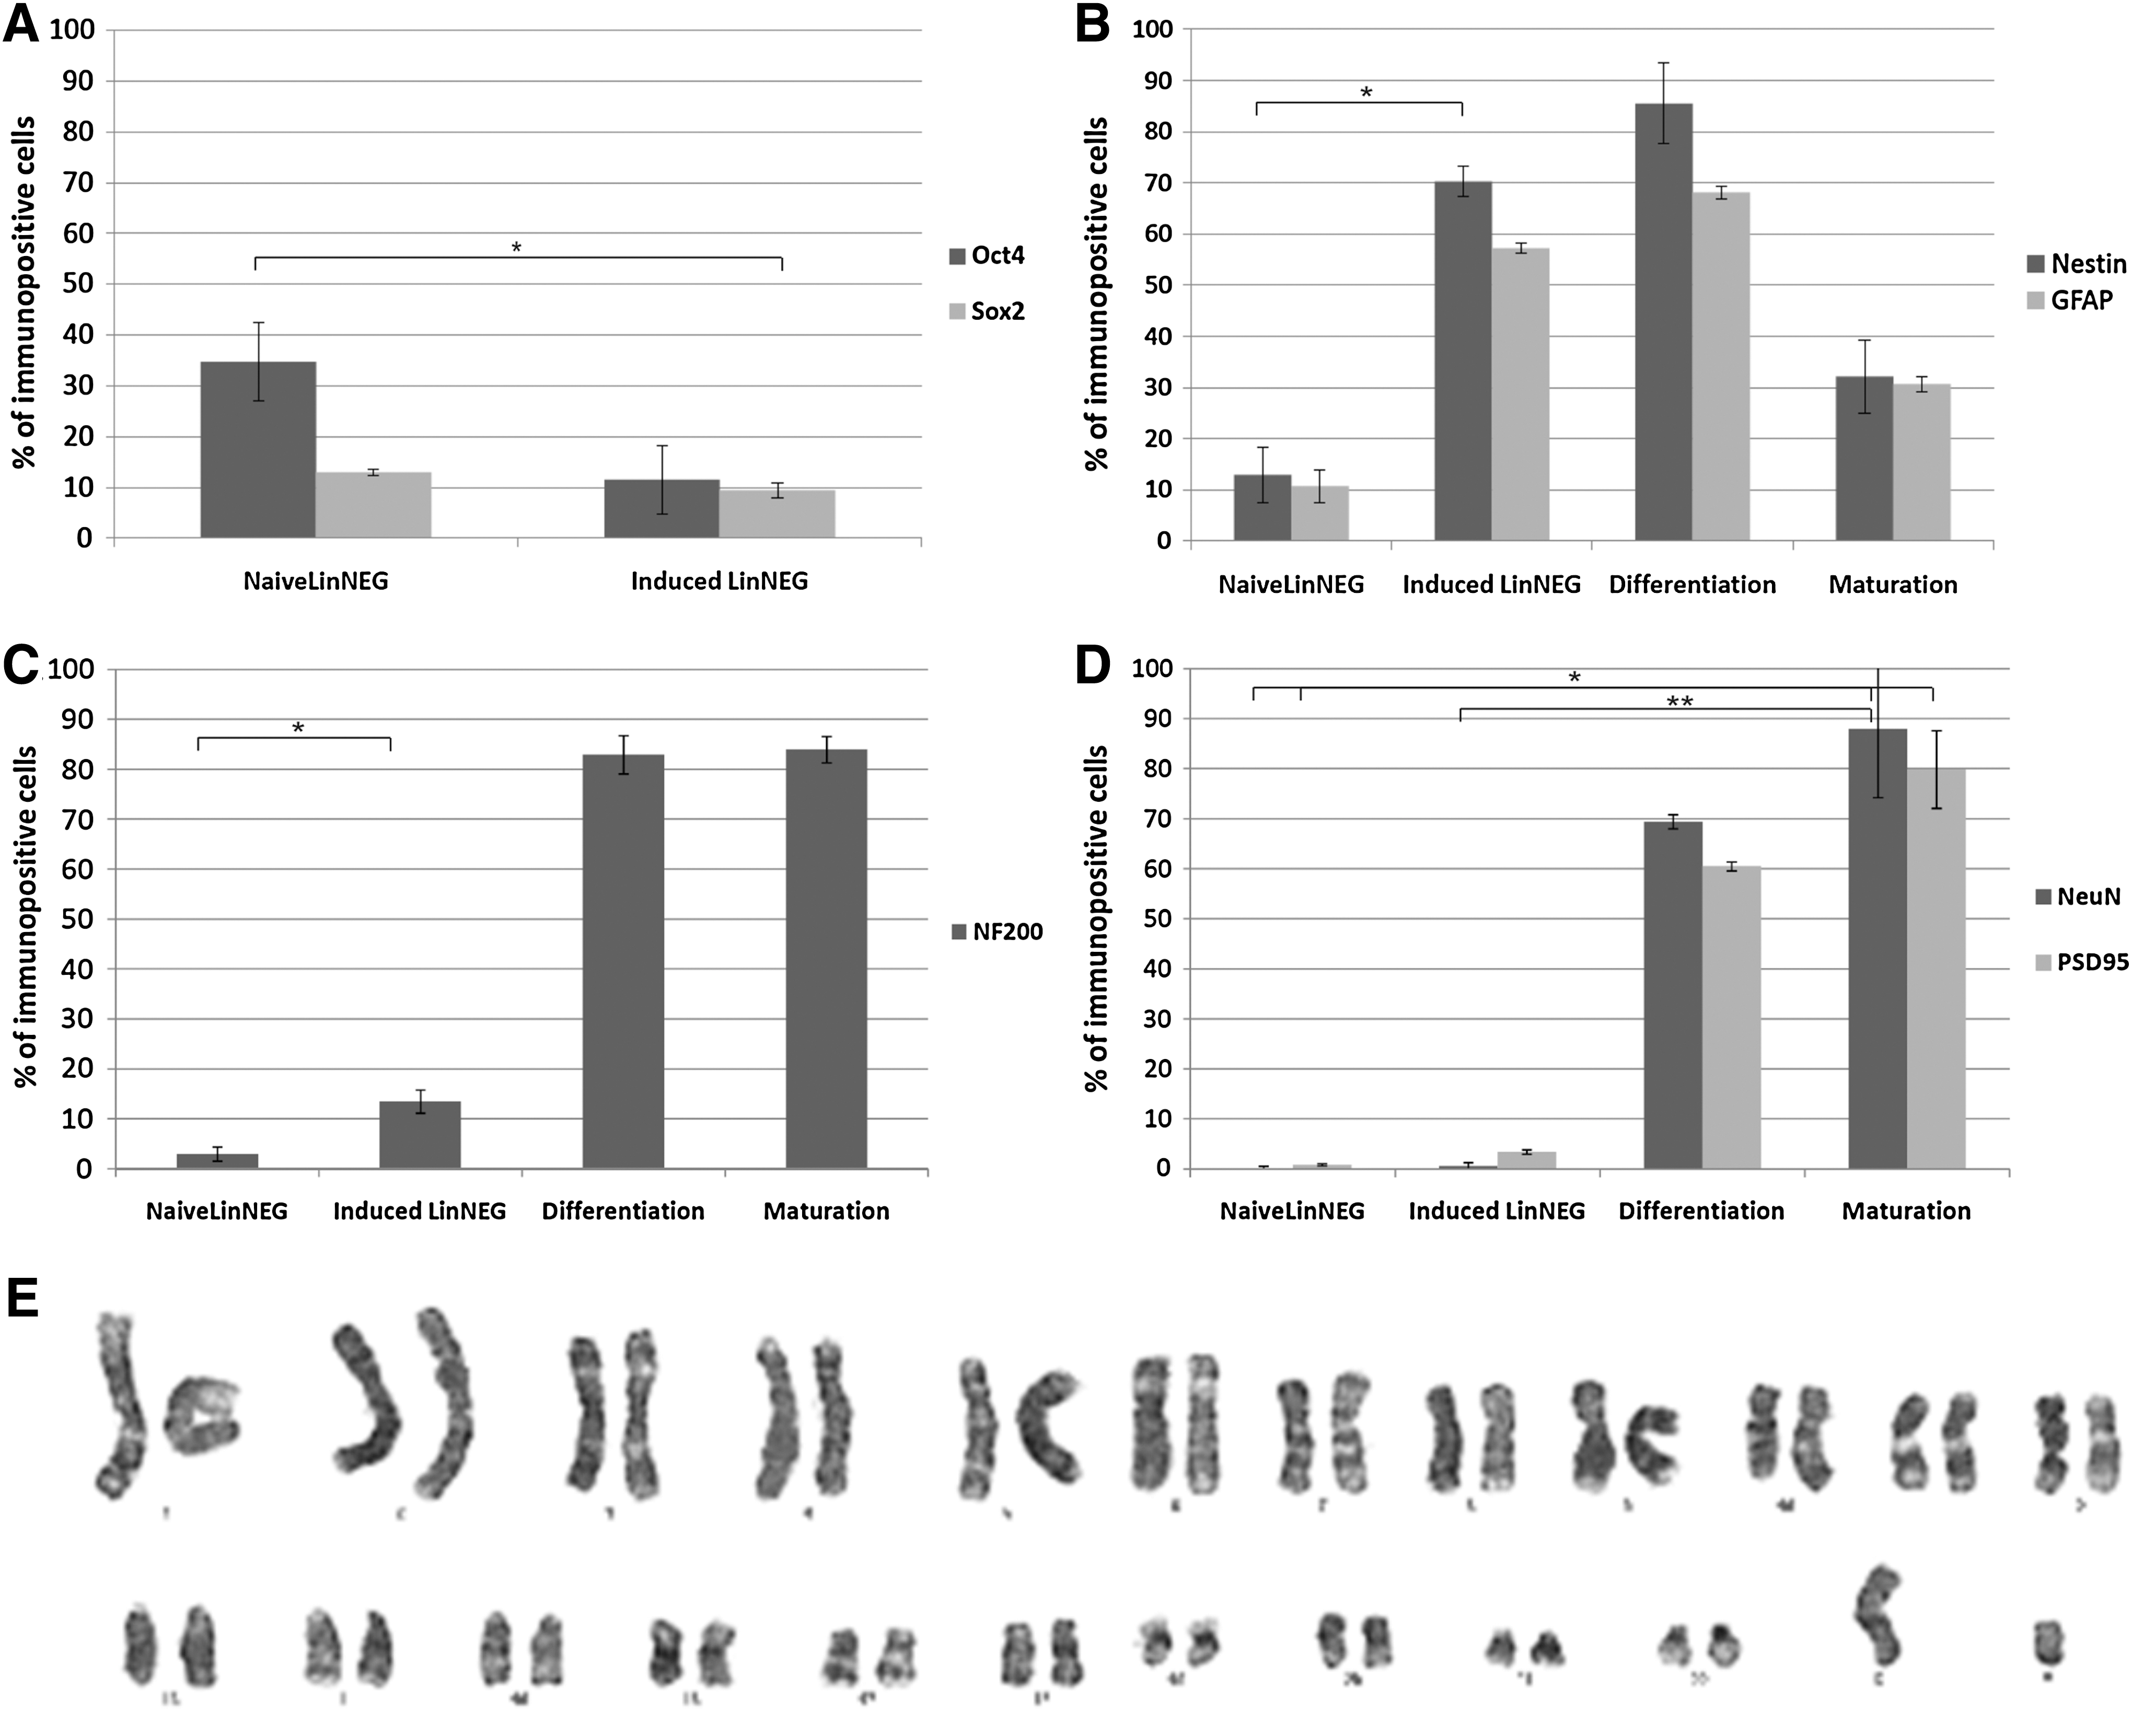
Analysis of neuronal markers expression during in vitro differentiation. LinNEG cells revealed temporal expression pattern of developmental neuronal markers correlated with defined steps of differentiation protocol. We observed downregulation of pluripotency genes
LinNEG cells were cultured in defined serum-free media according to a 3-step protocol of neuronal induction, differentiation, and maturation [16]. In this study we investigated the key molecular, cellular, and phenotypical changes accompanying the process of neuronal differentiation in vitro. We observed that naïve LinNEG cells exposed to neuronal induction medium formed 3D clusters after 24 h (Fig. 2B, arrow). During 10 days of neuronal induction the clusters of LinNEG cells grew in size (Fig. 2D, E, arrows) due to cell proliferation (positive Ki67 staining) (Supplementary Fig. S1). At day 10 of neuronal induction the LinNEG cells constituted the clusters positive for markers of neural SCs: Nestin 70.27%±7.18% and GFAP 57.20%±1.45% (Figs. 2F and 3B). During neuronal induction some cells became also positive for NF200—a marker typical for more mature neuroblasts (13.49%±3.83%) (Fig. 3C). Noteworthy, very few cells were positive at this stage for mature neurons markers: NeuN 0.6%±0.54% and PSD95 3.4%±0.9% (Fig. 3D). Also, less than 1% of freshly isolated LinNEG cells (day 0) were positive for the markers typical for neuroblasts and mature neurons (Fig. 3C, D). However, we reported that 12.92%±5.47% of naïve LinNEG cells expressed Nestin, and 10.7%±3.24% cells were positive for GFAP marker (Fig. 3B). Interestingly, the amount of LinNEG cells positive for Nestin increased rapidly to 42.92%±2.94% after 24 h when 3D cell clusters appeared (M. Jurga, unpublished).
As already mentioned, the first step of neuronal induction was accompanied with intensive proliferation of SCs; therefore, we performed cytogenetic analysis of LinNEG cells at the end of induction (day 10) to investigate potential chromosomal aberrations. All investigated cells in metaphase of the cell cycle had normal karyotypes (Fig. 3E).
Subsequently in step 2, the cells were exposed to differentiation medium containing retinoic acid and neurotrophins. Upon this stimulation, cells become adherent and spindle shaped after 24 h (day 11) (Fig. 2G, arrows). Within next 7 days the cells started to form elongated bipolar phenotypes characteristic for immature migrating neuroblasts (Fig. 2H, arrows). Detailed sequences of morphological changes that occur during neuronal induction of LinNEG cells are present in Supplementary Fig. S2. At the end of differentiation (day 17) most of the cells were positive for neural SC markers Nestin 85.47%±4.54% and GFAP 68.13%±5.05%, the neuroblasts marker NF200 82.91%±2.64%, and mature neuronal markers NeuN 69.40%±7.92% and PSD95 60.5%±7.78% (Figs. 3B, C, D, 2I and Supplementary Fig. S3).
Administration of cell membrane-permeable dBcAMP in the final stage 3 of neuronal maturation induced branching of the cell protrusions characteristic for mature neurons (Fig. 2J–L). Cells were grown in 2D neuron-like network with dense cell–cell connections (Fig. 2J). Scanning electron microscopy revealed the neurite-like protrusion (Fig. 2K, arrowhead) and several Y-branched dendrite-like protrusions (Fig. 2K, arrows). Confocal analysis revealed that percentage of cells positive for neuroblast marker NF200 remained at the same level as was shown for previous differentiation stage 2 (Fig. 3C). Number of cells positive for mature neuron markers increased significantly to 88%±7.07% for NeuN and 79.87%±4.38% for PSD95 (Fig. 3D). It is worth to stress that the number of cells positive for neural SC markers decreased at this point to 32.13%±8.16% for Nestin and 30.68%±8.79% for GFAP (Fig. 3B).
Cord blood samples retrieved from biobanks can be efficiently induced toward neuroblasts in clinical grade serum-free media
We have investigated whether cryopreserved MNCs, containing LinNEG cells, could be efficiently induced toward neuroblasts in defined serum-free media without depletion of lineage-committed cells. We used fresh and frozen MNC cells processed with density gradient technique. After thawing, the cells were neuronally induced in vitro within 10 days (step 1) according to previously described protocol (see the Materials and Methods section). We showed that after neuronal induction the number of cells from fresh MNCs decreased to 87.55%±31.92% and from frozen MNCs decreased to 28.82%±14% in relation to total processed MNCs at day 0 [Post].
We have shown slightly higher percentage of NF200+ neuroblasts and Ki67+ proliferating cells in thawed units of cord blood in comparison to fresh MNCs; however, the differences were not statistically significant (Fig. 4A). We performed also colabeling with NF200 and Ki67 antibodies to show the number of proliferating neuroblasts. We have identified 6.58%±3.89% of colabeled neuroblasts in total MNCs from fresh blood samples and 6.18%±3.02% colabeled neuroblasts from thawed samples (Fig. 4A).
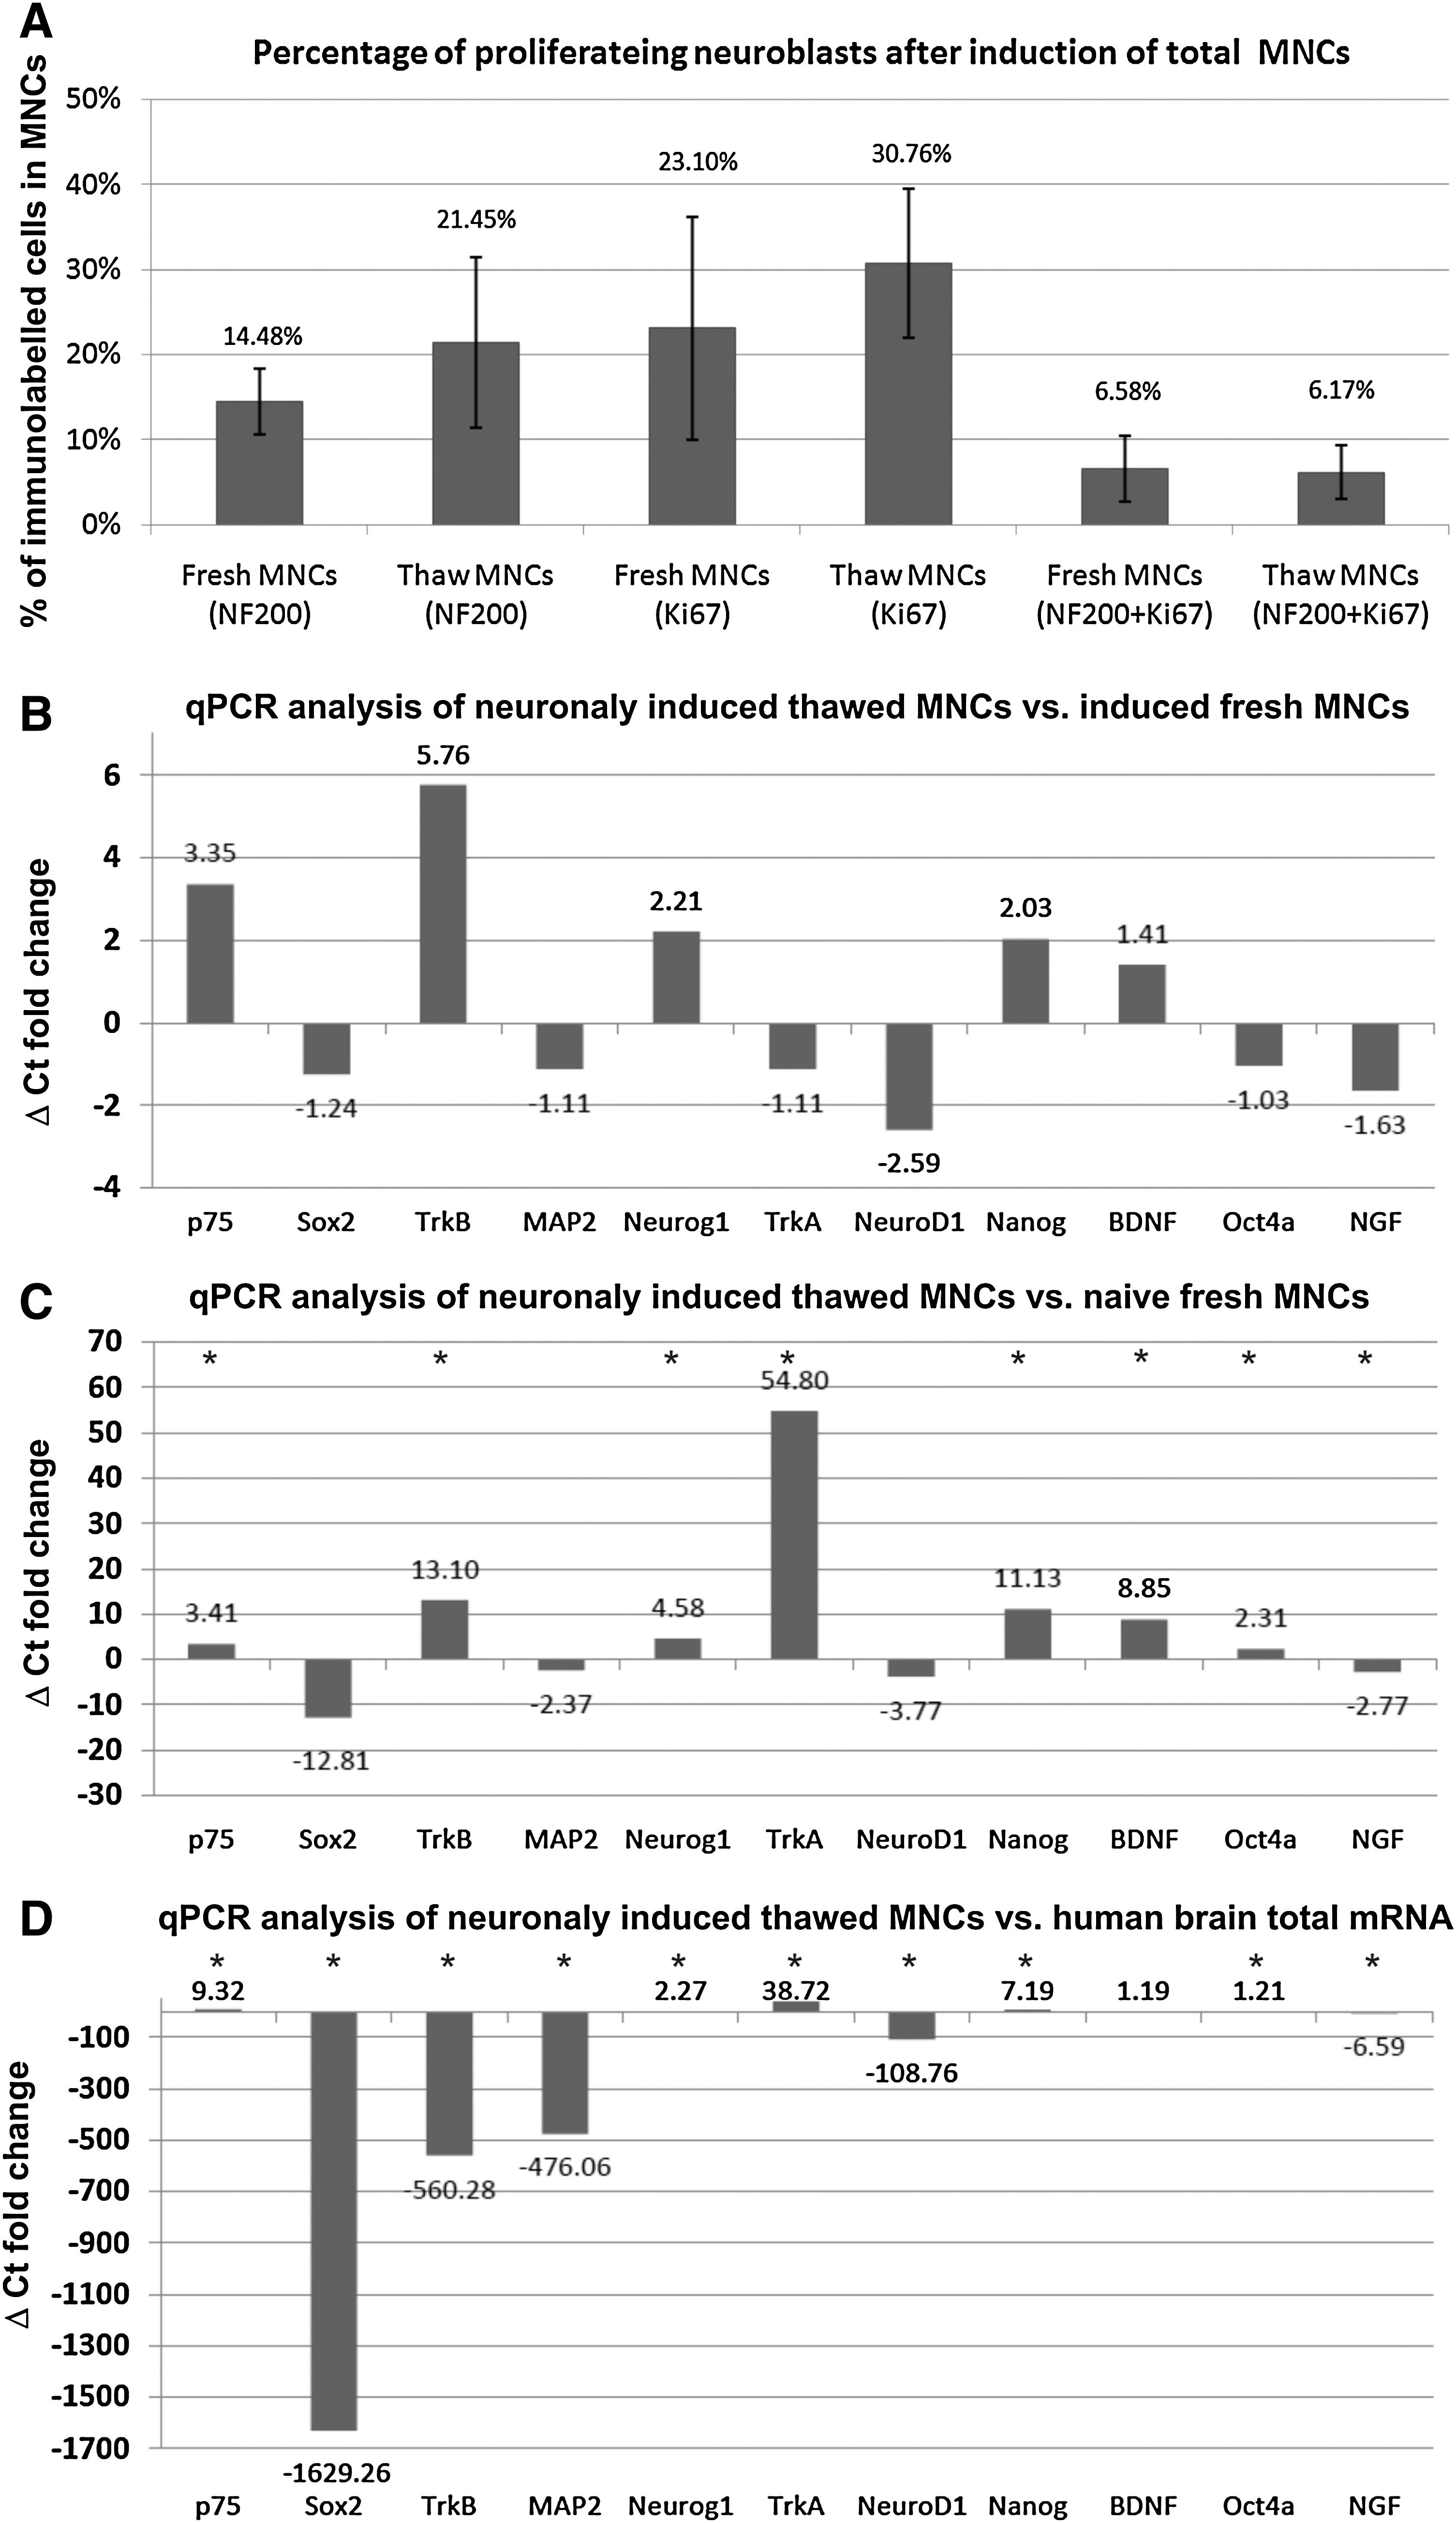
Molecular analysis and neuroblasts production efficiency after neuronal induction of frozen cord blood MNCs. Immunoctytochemical analysis
We used real-time PCR analysis to compare the molecular profile of the neuroblasts generated from fresh and frozen MNCs to naïve MNCs and control human brain tissue (Fig. 4B–D). We did not observe significant differences between the neuroblasts induced from fresh and thawed MNCs (day 10) (Fig. 4B). Induced MNCs had significantly higher expression of neurotrophin receptors TrkA, TrkB, and p75 in comparison to freshly isolated naive MNCs (Fig. 4C). After induction we have observed also higher expression of transcription factors Neurogenin 1, Nanog, and Oct4 (Fig. 4C). Among the neurotrophins we observed increase of BDNF mRNA and small decrease of NGF mRNA after neuronal induction (Fig. 4C). We have compared these relative values of neuronal induction to control mRNA isolated from human brain tissue (Fig. 4D). We found that induced MNCs had significantly lower expression of BDNF receptor, neurotrophin NGF, mature neuron marker MAP2, and transcription factors Sox2 and NeuroD1 in comparison to control samples of human brain tissue (Fig. 4D). Expression of some genes was, however, increased in induced MNCs in comparison to brain tissue; these were transcripts for neurotrophins receptors TrkA and p75, and transcription factors Neurogenin1, Nanog, and Oct4 (Fig. 4D).
LinNEG cells and MNCs can be differentiated in vitro into glutamate-responsive cells
We investigated the functional properties of neuroblasts derived from purified LinNEG cells and from MNCs. Cells were differentiated in defined serum-free media following the 3-step protocol. We detected changes in intracellular calcium level in response to glutamate stimulation (Fig. 5A). No changes have been observed in undifferentiated cells stimulated with glutamate (data not shown). We identified glutamate responsive cells in both investigated cell populations (Fig. 5B). We estimated the percentage of glutamate responsive cells derived from both cells populations. After maturation the LinNEG cells generated 73.33%±11.55% of glutamate-responsive cells in comparison to 42.05%±12.81% of neuronally differentiated MNCs responded to glutamate induction (Fig. 5D).
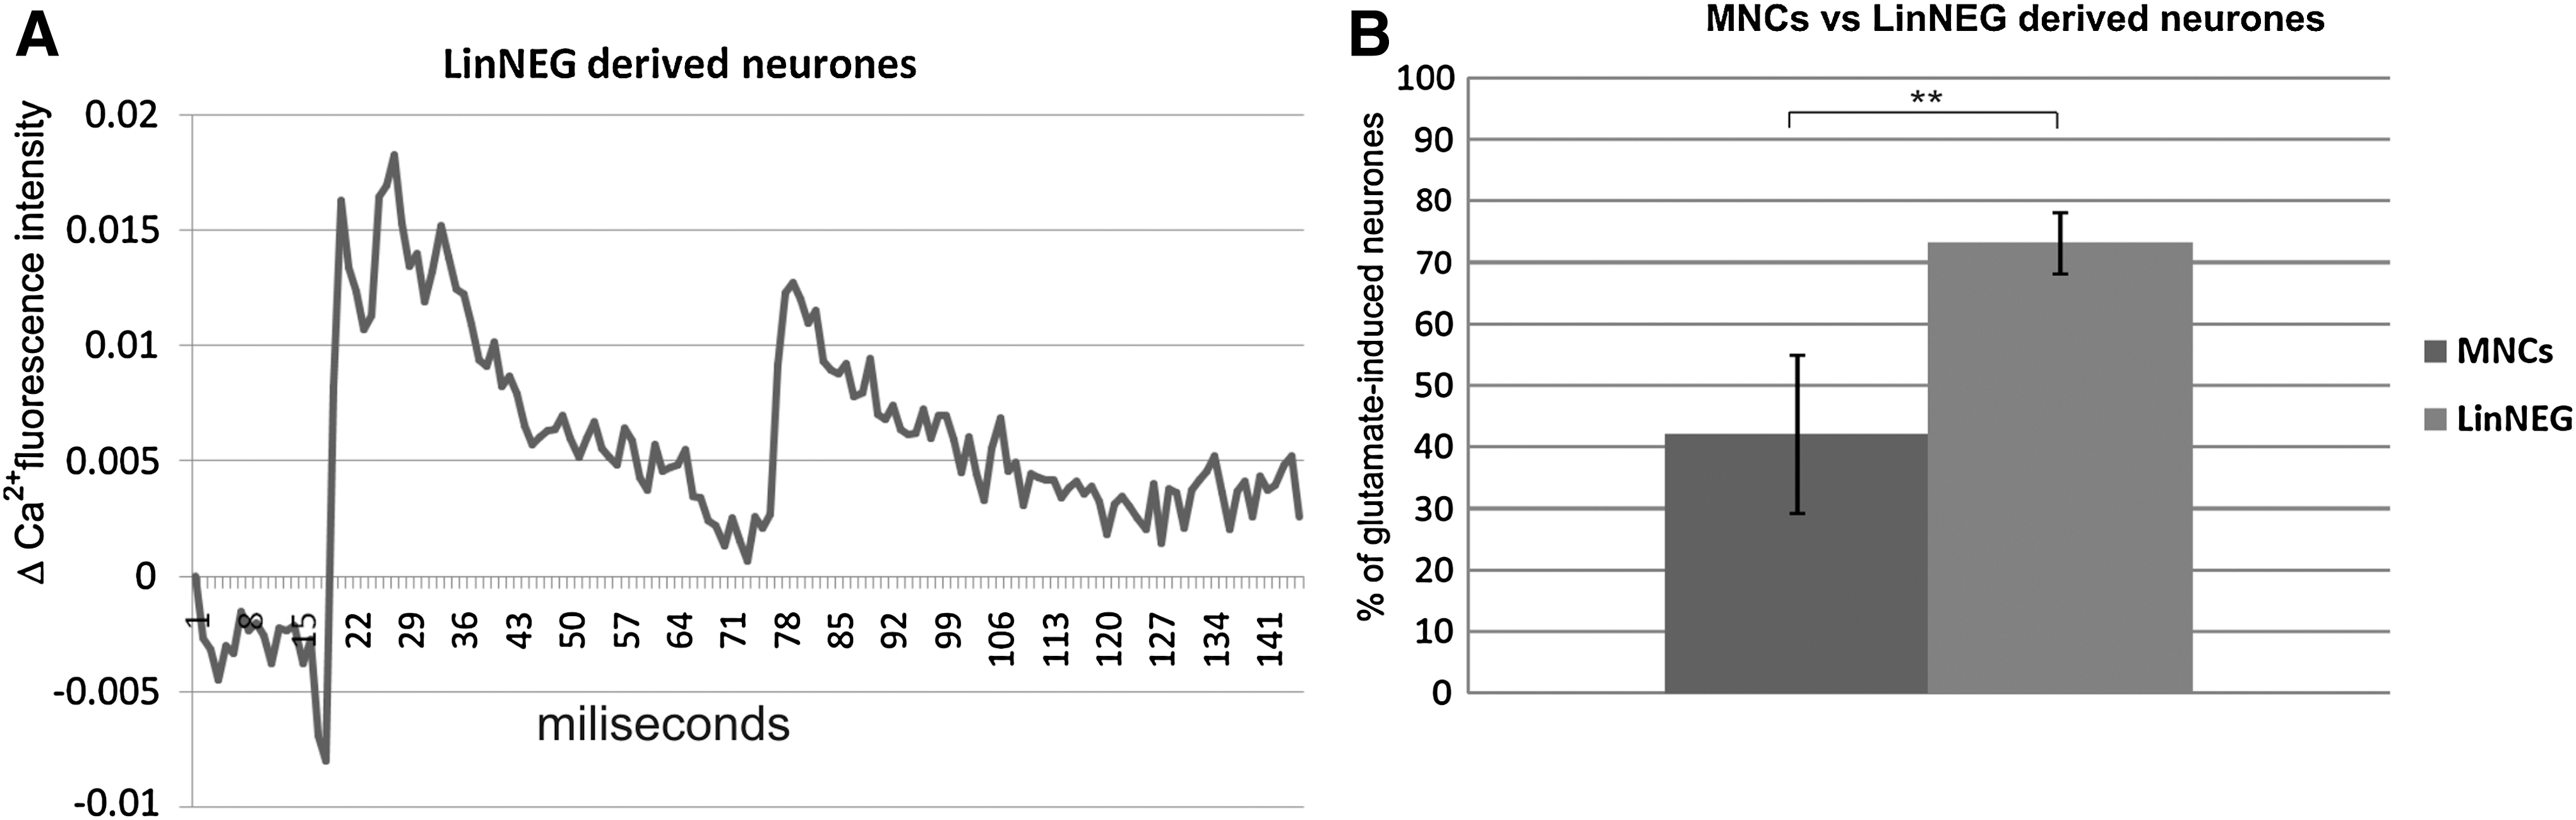
Functional analysis of neuronal activity. Neuroblasts derived from purified LinNEG cells revealed response for glutamate induction
Discussion
Recently, SC therapy of injured CNS became a reality and novel advanced technologies are developing now for more effective regeneration of damaged neuronal tissue [23,36 –38]. The work we present here is aimed at scientists and clinicians working on translational research and developing new therapies based on cord blood SCs, but we would also like to draw the attention of the biobanks and their clients to consider different aspects of cord blood storage, which will be important for the future nonhematological therapies.
First, we have investigated a robustness of multipotent, lineage-negative SC (LinNEG) isolation from cord blood units. Since HSCs are very well defined by expression of CD34+ marker, the LinNEG cell population is individually set by the researchers' choice of the markers used for depletion of lineage-committed cells. In our study we have used 2 techniques to deplete the cells of hematopoietic lineages: the commercial MACS kit detecting 12 different epitopes of hematopoietic lineage at 1 step and the custom MACS kit containing 3 antibodies (CD33−, CD45−, and CD7−) that deplete most of the hematopoietic cells in 3 step protocol [16]. Both techniques gave a very similar fraction of highly immature SCs which expressed transcription factors and surface markers considered as determinants of multipotency (Oct4, Sox2, Nanog, Tra1, SSEA-4, and SSEA-3). This gives the opportunity for clinical-grade negative separation of multipotent SCs giving, upon neuronal induction, the population of cells highly enriched with neuroblasts phenotypes. The advantage of this method is clinical safety, considering the isolation of LinNEG cells free from magnetic beads and antibodies attachment.
To assess the content of LinNEG cells in the cord blood units dedicated for clinical intervention, we compared the main techniques of cord blood processing that are widely used in clinics, biobanks, and in research. We found that automated Sepax system and antibody-based Prepacyte-SC techniques gave significantly highest yields of MNCs and LinNEG cells content. Noteworthy recovery of LinNEG cells [Post] were correlated with the recovery of hematopoietic SCs (CD34+ and CD133+/−) for Plasma depletion, Sepax, and Prepacyte techniques [15, and M. Jurga (unpublished data)]. Therefore, the number of HSCs may be considered in some cases as indication for nonhematopoietic treatments with noncryopreserved cord blood.
Considering neurological interventions the fresh samples of cord bloods are not available in most cases (except some treatments of neonatal encephalopathy), and cryopreserved material must be retrieved from the biobanks (autologous or allogeneic HLA-matched). Above-mentioned correlation between the counts of HSCs and LinNEG cells [Post] was not valid, however, after thawing of the samples [Thaw] processed with different methods. Cryopreservation of MNCs separated by Prepacyte and Plasma depletion resulted in high mortality of MNCs and LinNEG cells. Ultimately, only the cord bloods processed with Sepax technique gave a significantly higher absolute number of LinNEG cells after retrieval from cryostorage (nearly 10-fold difference in comparison to all other techniques). This significant difference in survival rate of LinNEG cells may be due to unknown modifications in the cell membrane permeability by chemicals used for separation, whereas Sepax technique does not require additional chemicals for cell separation. In case of Plasma depletion, another chemical-free technique, a low number of LinNEG cells after thawing were rather due to low processing yield.
It has been shown that transplantation into the brain tissue of naïve lineage-negative cells derived from cord blood did not effect in their differentiation into neuronal phenotypes [39]. Moreover, there are evidence that transplantation of unrestricted SCs into the CNS may cause aberrant axonal sprouting leading to false signal transmission and hypersensitivity [30]. Recently, it has been also shown that infusion of naïve autologous HSCs into patients' kidney resulted in neoplastic malformations of hematopoietic origin [40]. Detailed molecular and cellular analysis of SCs exposed on neuronal induction media is necessary for clinical safety and for determination of optimal induction protocol. We have shown in this study that LinNEG cells were capable of generating a high number of neuroblasts after in vitro induction in defined serum-free media. We observed that neuronal induction of over 70% of LinNEG cells toward neuroblasts requires at least 10 days of culture. However, our results showed a significant increase (over 40%) of neuroepithelial Nestin-positive phenotypes in the 3D aggregates as soon as 24 h after isolation. We showed that over 70% of LinNEG cells could be induced toward neuroblasts in comparison to nearly 20% of neuroblasts generated from a heterogeneous fraction of total MNCs. Moreover, over 6% of such NF200 neuroblasts proliferate (Ki67/NF200 colabeled), which would be highly desired for regeneration of large deficits in brain tissue. It is worth to underline here that the percentages of neuroblasts generated after induction (step 1) of LinNEG cells and MNCs correlated with the number of glutamate-responsive cells generated after differentiation.
Extrapolation of the neuroblasts percentages generated from LinNEG and MNCs to the absolute numbers of these cells available from cryopreserved samples gave 0.25×10⁶ versus 22.83×10⁶ total neuroblasts in case of gradient separation and 2.25×10⁶ versus 162.53×10⁶ neuroblasts after Sepax-processed LinNEG and MNCs, respectively. Extrapolation of the results obtained from other processing methods allow for following estimation of absolute neuroblasts number—Plasma depletion: LinNEG (0.25×10⁶) and MNCs (106.44×10⁶); Hetastarch: LinNEG (0.06×10⁶) and MNCs (28.11×10⁶); Prepacyte: LinNEG (0.25×10⁶) and MNCs (27.37×10⁶). It is important to stress that these mathematically extrapolated values are presented here only to illustrate the theoretical efficiency of different methods and may not reflect exactly the real number of neuroblasts upon induction in vitro, for example, due to different proportions of MNCs and LinNEG cells. For comparison, it has been shown that systemic delivery of minimum 2.5×10⁷ nucleated cells or 2×10⁵ CD34+ cells (counted before cryopreservation) per kg of body weight was therapeutically effective in treatment of hematopoietic diseases [3,14]. When considering the intraparenchymal delivery, the SCs were injected in the range 1–10×104 cells in the animal stroke models [26,41] and 1–20×106 cells in ongoing clinical trials for stroke therapy [13]. Also, neuronal tissue engineering approach, developed recently in our group for reconstruction of brain lesions, requires low amount of cells (105 cells in 20 μl scaffold) to be encapsulated in bioactive scaffolds before their transplantation [42]. This makes it possible to use LinNEG cell-derived neuroblasts for cell and tissue engineering therapy of CNS.
The alternative approach would be to induce total MNCs, considering the large amount of neuroblasts, which could be obtained in comparison to LinNEG cells (estimated 162.53×10⁶ vs. 2.25×10⁶ neuroblasts from cells processed with Sepax, respectively). However, low purity of MNC-derived neuroblasts in comparison to LinNEG cell-derived neuroblasts (30% vs. 70%, respectively) would require additional selection of MNC-derived neuroblasts. It is worth considering that FACS- or MACS-positive selection carries additional risk related to antibody binding to the critical cell surface molecules used for selection (eg, NCAM). High homogeneity and detailed characteristic of neural SCs is especially important when intracranial transplantation is performed. This safety protocol is also very important after in vitro treatment of the cells with growth factors like EGF and bFGF, having strong effect on cell proliferation and differentiation. Such precautions should be applied to minimize a risk of undesired cell differentiation and proliferation as described already in preclinical study and clinical case report [30,40]. The therapeutic effect of these 2 methods needs to be confirmed in clinical trials and also in a dose response study in case of MNC-derived neuroblasts.
Intraparechymal delivery of naïve SCs, which are unable to respond via functional receptors to the molecules present at the site of injury, may result in low differentiation and increased apoptosis or anoikis [43]. In our study neuronal induction of MNCs was confirmed by qPCR analysis, which indicated significant increase of mRNA for all 3 types of neurotrophin receptors characteristic for CNS [high-affinity TrkA (NGF-ligand), TrkB (BDNF-ligand), and low-affinity p75]. Moreover, we have shown that neuronally induced MNCs expressed mRNA for BDNF at a significantly higher level than naïve MNCs and human brain tissue. This observation is of great importance considering the role of the neurotrophins in the process of neurogenesis in vivo [33]. A positive therapeutic effect after transplantation of neuronally induced cells that secreted brain-specific growth factors and neurotrophins was shown in previous preclinical studies [44,45].
LinNEG neuronal induction was followed by differentiation and maturation in vitro in the presence of neurotrophins (NGF, BDNF) and neuromorphogens (retinoic acid, cAMP) to reveal the molecular and cellular changes that could be expected after intracranial delivery and exposure to similar factors present at the injury site. We have shown here precise temporal changes in the molecular signatures of LinNEG-derived developing neurons. Administration of neuromorphogenes corresponded with rearrangement of cytoskeleton components of differentiating neurons and switch from intermediate neurofilaments (Nestin+) to NF200+ and TUJ1+ phenotypes (data not shown). Maturation of cytoskeleton was correlated with expression of nuclear NeuN and cell surface PSD95 proteins characteristic for mature neuronal phenotypes. These temporal changes of neuronal markers shown in our study were also described as characteristics for certain stages of neurogenesis in vivo [46]. The time taken for neuronal differentiation of cord blood LinNEG cells (3 weeks) corresponded also to maturation time of new born neurons in the subventricular zone of human brain [46].
Considering the molecular changes during neuronal induction and differentiation, we have observed a switch from of transcription factors responsible for multipotency (Oct4, Sox2, and Nanog) expressed in naïve LinNEG and MNCs to tissue-specific neuronal transcription factors of bHLH family: NeuroD1 and Neurogenin1. BHLH transcription factors are involved in regulation of neurogenesis and neuronal versus glial specifications of neural SCs [46 –48]. It has been shown that similar changes in control of tissue-specific gene expression were correlated with morphological changes and cell shape typical for mature neurons [49].
Conclusions
Here we have shown the influence of major methods of cord blood processing and cryopreservation on LinNEG cell recovery, viability, and their neurogenic potential. We have shown that LinNEG cells could be efficiently induced toward neuroblasts in serum-free medium with no chromosomal abnormalities. We have described the key steps, achieved by LinNEG cells at cellular and molecular level, during neuronal differentiation into glutamate-induced excitatory neurons in vitro. As an alternative to LinNEG cell separation, we have proposed a simple method for neuronal induction of total MNCs retrieved from cryopreserved cord blood units, based on clinically compliant defined, serum-free media. More clinical studies are required to evaluate the neurogenic potential of cord blood SCs. We believe that our work will contribute for better efficacy of future clinical trials in regeneration of CNS.
Footnotes
Acknowledgments
We thank the obstetrics and gynecology staff of the Royal Victoria Infirmary, Newcastle, United Kingdom; St Joseph–St Luc Hospital, Lyon, France; and Natecia Hospital, Lyon, France for their help and support in collecting and supplying the umbilical cord and cord blood samples. We are grateful to NovusSanguis charity foundation for supporting this project.
Author Disclosure Statement
No competing financial interests exist.
References
Supplementary Material
Please find the following supplemental material available below.
For Open Access articles published under a Creative Commons License, all supplemental material carries the same license as the article it is associated with.
For non-Open Access articles published, all supplemental material carries a non-exclusive license, and permission requests for re-use of supplemental material or any part of supplemental material shall be sent directly to the copyright owner as specified in the copyright notice associated with the article.