
Abstract
Neuroinflammation is associated with the pathogenesis of all types of neurological disease, in which microglial cells play a critical role. In response to disturbances in the microenvironment, microglia (MG) become activated and differentiate into either an M1 phenotype, which has a proinflammatory damaging effect, or an M2 phenotype, which plays an anti-inflammatory and reparative role. Thus, modulating microglial polarization is a suitable strategy to treat neuroinflammatory disorders. Glial cell-derived neurotrophic factor (GDNF) is a neurotrophic mediator that exerts neuroprotective effects during neurological diseases. In this study, we predicted that adipose-derived stem cells (ADSCs) could produce GDNF and investigated the effects of GDNF on microglial M1/M2 polarization. Furthermore, we determined whether GDNF modulates microglial activation and polarization via the phosphoinositide-3-kinase (PI3K)/AKT signaling pathway. We found that the secretion of inflammatory cytokines in lipopolysaccharide-stimulated MG was downregulated, whereas the anti-inflammatory mediators in interleukin-4-stimulated MG were upregulated obviously, following pretreatment with ADSCs or GDNF. In addition, GDNF produced by ADSCs inhibited the MG M1 phenotype and promoted the M2 phenotype by upregulating the PI3K/ATK pathway. These results reveal that GDNF produced by ADSCs might be useful for the regulation of neuroinflammatory disorders.
Introduction
Numerous studies have revealed that the central nervous system (CNS) is immune-exempt based on the absence of lymphatic infiltration and existence of various barriers. Recently, both epidemiological and genetic studies have shown that the inflammatory response is involved in the occurrence and development of CNS damage and disorders [1,2]. Neuroinflammation is a self-protective response of the CNS that occurs to clear pathogenic factors and repair wounded tissues. However, inflammatory mediators such as cytokines, chemokines, and free radicals can aggravate the damage to nerve cells and exacerbate brain injury [3,4]. Maintaining the balance between the protective and destructive features of the inflammation response is very important to take advantage of this process while alleviating potential injury.
Microglia (MG), which execute specific immune functions in inherent immunity, the maintenance of homeostasis, and neurotropic support, are resident mononuclear macrophages in the CNS [5,6]. Under pathological conditions, MG undergo a myriad of modulatory processes involving cell morphology and secrete a diverse range of molecules in response to neurotoxic agents or signals. Several studies have confirmed that microglial activation plays a vital role in the pathogenesis of neurological diseases [7,8]. Once activated, MG can differentiate into two phenotypes, specifically the classical (M1) and alternative (M2) activation types [9,10]. Normally, M1 MG are detrimental and produce a series of proinflammatory mediators, including interleukin (IL)-1β, tumor necrosis factor (TNF)-α, and IL-6, and upregulate markers, such as induced nitric oxide synthase, CD16, and CD86, among others. In contrast, M2 cells are commonly reparative and secrete a series of anti-inflammatory cytokines such as IL-10 and transforming growth factor (TGF)-β and upregulate other markers such as arginase-1 (Arg-1), CD206, and Ym-1/2, among others [4,11]. Thus, suppressing the M1 stage, while promoting the M2 phenotype, might be advantageous to treat neuroinflammatory disorders.
Adipose-derived stem cells (ADSCs), which are isolated from adipose tissue, are the most common type of stem cells used in cell therapy because of their associated ease in harvesting, high yield, high proliferation, and immune-privileged potential [12,13]. Numerous studies have confirmed that ADSCs can be used to treat neurological disorders, which is not only based on their ability to migrate to the damaged area but also on their capacity to differentiate into multilineage cells [14] and modulate the inflammatory state. Fat tissue has multiple immune-regulatory functions that are mediated by intricate mechanisms. These functions inhibit different immune cell subpopulations of innate and adaptive immunity by secreting paracrine factors, including insulin-like growth factor, hepatocyte growth factor, and basic fibroblast growth factor [15,16].
Accumulating studies have shown that glial cell-derived neurotrophic factor (GDNF) plays a neuroprotective role during neurological diseases [17,18]. Thus, GDNF might play an essential role in neural restoration. In the present study, we examined the modulatory effect of ADSCs on MG differentiation and the possible mechanisms underlying these effects. These findings will help us to understand the possible mechanisms of neurotropic protection and might provide new alternative methods to treat neuroinflammation-associated diseases.
Materials and Methods
Isolation of ADSCs and cell culture
All animal experiments performed in this study were approved by the Animal Ethics Committee of Zhujiang Hospital of Southern Medical University and were conducted in accordance with the instructions of our institute. C57BL/6 mice were provided by Southern Medical University (Guangzhou, China). During gynecological surgery, the cells were harvested from 2 to 5 g of subcutaneous fat from the abdominal wall. Tissues collected in calcium-/magnesium-free phosphate-buffered saline (PBS) were dissected into 1–2 mm3 pieces and dissociated with 0.1% collagenase I (Sigma, St. Louis, MO) for 60 min at 37°C in a shaker. After 40 min, the digested tissues were filtered through a 70-μm filter and centrifuged at 1,500 rpm for 10 min. After two washes, the pellet was resuspended in complete medium (Dulbecco's modified Eagle's medium containing 10% fetal bovine serum) and plated in 10-cm cell culture dishes. The medium was replaced every 2–3 days. Passages were performed when the cells reached 80%–90% confluence.
The murine microglial cell line BV2 was purchased from the ATCC (Manassas, VA) and cultured in Dulbecco's modified Eagle's medium (Gibco, Grand Island, NY) supplemented with 10% fetal bovine serum (Gibco) at 37°C with 5% CO2 saturation. Passages were performed every 3 days at a ratio of 1:3–6.
Experimental design
To analyze GDNF production following treatment with TNF-α, ADSCs were cultured for 24 h following pretreatment with TNF-α (PeproTech, NJ) at concentrations of 0, 1, 5, 10, 20, or 50 ng/mL. Then, the supernatants and whole cells were collected to measure GDNF production. Transwell coculture systems were used to analyze the effects of GDNF produced by ADSCs on the production of pro- and anti-inflammation mediators and the modulation of BV2 MG differentiation. Briefly, MG were seeded in the lower chamber of the Transwell (1 × 10⁴ cells/well) for 12 h and then stimulated with lipopolysaccharide (LPS) to prepare an M1 inflammation model, whereas IL-4 was used for the M2 anti-inflammation model. After 24 h, the GDNF-pretreated (500 ng/L; PeproTech) and TNF-α-pretreated ADSCs (1 × 10⁶ cells/well), and TNF-α-pretreated and GDNF-silenced ADSCs (see “siRNA Transfection” section) (1 × 10⁶ cells/well) were added to the upper chamber. After coculture for 24 h, the upper chambers were removed and protein in the cell supernatant and cells in the lower chamber were collected for assays.
siRNA transfection
For RNA silencing, ADSCs were transfected with 100 nM GDNF-siRNA (Santa Cruz Biotechnology, Dallas, TX) using Lipofectamine 2000 reagent (Invitrogen, Carlsbad, CA) following the manufacturer's protocol. The cells were collected for subsequent experiments after 48 h of culture.
Flow cytometry
Specific cell membrane markers of ADSCs and BV2 MG were detected by flow cytometry. Briefly, the cells were digested and collected by centrifugation at 1,200 rpm for 5 min. The total cell number was determined, and then, the cells were transferred to new Eppendorf tubes (106 cells/tube). ADSCs were incubated with the following antibodies: anti-CD45-FITC, anti-CD31-FITC, anti-CD90-FITC, and anti-CD29-FITC. BV2 MG were incubated with the following antibodies: anti-CD86-FITC and anti-CD206-APC (all antibodies from Thermo Fisher Scientific, Waltham, MA). Incubation was performed for 20 min at room temperature in the dark. The cells were washed twice with PBS and resuspended in 500 μL PBS. Cell surface expression was detected using a Beckman CytoFLEX FCM (Brea, CA), and the data were analyzed with FlowJo software (TreeStar, Ashland, OR).
Enzyme-linked immunosorbent assay
The concentrations of GDNF, IL-1β, TNF-α, IL-10, and TGF-β in the cell supernatants were determined by enzyme-linked immunosorbent assay (ELISA) according to the manufacturer's instructions (Mlbio, Shanghai, China). Briefly, the culture supernatant was collected by centrifugation at 1,200 rpm for 15 min, and 100 μL of the supernatant was added to each well of a 96-well plate. After incubation for 2 h at 37°C, the supernatant was removed and the plates were incubated sequentially with biotin-conjugated primary detection antibody followed by horseradish peroxidase-conjugated secondary antibody for 1 h at 37°C; the plates were washed three times between steps. After adding the chromogenic substrate, the plates were incubated in the dark for 30 min at 37°C. After the reaction was stopped, the optical density was immediately detected at 450 nm using the Rayto RT-6100 (Rayto, Shenzhen, China).
Quantitative reverse transcription polymerase chain reaction
Total RNA was extracted from ADSCs and BV2 MG using the TRIzol reagent (Thermo Fisher Scientific) according to the manufacturer's instructions. The concentration of RNA was measured using a NanoDrop-1000 (NanoDrop Technologies, Wilmington, DE) and sample purity was evaluated by determining the absorbance ratio at 260 and 280 nm; RNA purity was between 1.9 and 2.1. cDNA was synthesized from total RNA using the miRcute miRNA First-Strand cDNA Synthesis kit (Tiangen, Beijing, China), according to the manufacturer's instructions. All quantitative reverse transcription polymerase chain reactions (qRT-PCRs) were performed in 96-well plates on a Chromo4 Real-Time PCR System (Bio-Rad, Hercules, CA) using SYBR Green PCR Master Mix Reagent (Tiangen) with Opticon Monitor detection software. The expression level of the gene of interest was normalized using glyceraldehyde triphosphate dehydrogenase (GAPDH), and the CT value represents a real-time fluorescent quantitative PCR value. The 2−ΔΔCT method was used to calculate relative changes in gene expression. No treatment affected the expression of GAPDH mRNA. The primer sequences are shown in Table 1.
Quantitative Reverse Transcription Polymerase Chain Reaction Primers
GAPDH, glyceraldehyde triphosphate dehydrogenase; GDNF, glial cell-derived neurotrophic factor; IL, interleukin; TGF, transforming growth factor; TNF, tumor necrosis factor.
Western blot analysis
Total protein was extracted from BV2 MG using the RIPA lysis buffer (CWBIO, Beijing, China) according to the manufacturer's instructions. Protein samples were separated by sodium dodecyl sulfate/polyacrylamide gel electrophoresis and transferred to polyvinylidene fluoride membranes (Roche, Basel, Switzerland). The membranes were blocked in 5% bovine serum albumin for 2 h at room temperature and then incubated at 4°C overnight with rabbit polyclonal or monoclonal antibodies to detect phosphoinositide-3-kinase (PI3K p85, 1:1,000, ab191606), p-PI3K (1:500, ab182651), pan-AKT (1:500, ab8805), p-AKT (1:500, ab38449), and GAPDH (1:1,000, ab9484), which was used as an internal control. After washing in tris-buffered saline, the membranes were incubated with the goat anti-rabbit IgG (horseradish peroxidase conjugated, 1:1,000, ab7090) secondary antibody at room temperature for 1 h. Positive signals were developed with an EasyBlot ECL Kit (Sangon Biotech, Shanghai, China) and analyzed with ImageJ software (National Institutes of Health, Bethesda, MD).
Double immunofluorescence staining
To examine the expression of BV2 microglial M1 and M2 markers, double immunofluorescence (IF) staining was carried out. Briefly, we used the mouse anti-Iba1 antibody (GeneTex, Irvine, CA) to label BV2 MG and rabbit anti-CD16/32 and anti-CD206 antibodies to identify M1 and M2 MG. Before double IF staining, slides were warmed up at room temperature for 30 min and then fixed in 4% paraformaldehyde in PBS pH 7.2–7.4 for 15 min at room temperature. Samples were then washed three times with ice-cold 0.01 M PBS, for 5 min per wash. After fixation, samples were incubated for 5 min with 70% formic acid and washed three times with ice-cold 0.01 M PBS, for 5 min each. The samples were then incubated with 5% bovine serum albumin (BSA) for 30 min to block nonspecific antibody binding and then incubated in a mixture of two primary antibodies (mouse anti-Iba1 antibody, 1:100; rabbit anti-CD16/32 and anti-CD206 antibody, 1:500) in 1% BSA in a humidified chamber overnight at 4°C. The mixture solution was dedecanted, and the samples were washed three times with ice-cold 0.01 M PBS, for 5 min per wash. The samples were incubated with a mixture of two secondary antibodies with two different fluorochromes (anti-mouse IgG Alexa Fluor 555, 1:100; anti-rabbit IgG Alexa Fluor 488, 1:100) in 1% BSA for 1 h at room temperature in the dark. The mixture of secondary antibody solution was decanted, and the samples were washed three times with ice-cold 0.01 M PBS for 5 min each in the dark. Samples were then incubated with 5 μg/mL DAPI for 10 min and rinsed with PBS. The coverslips were mounted with a drop of 50% glycerinum, and pictures were taken under a microscope. Double-stained brain samples were photographed using a fluorescence microscope.
Statistical analysis
All data are expressed as mean ± SEM. Statistical analysis was performed using SPSS 21.0 statistical software (SPSS, Inc., Chicago, IL). Statistical significance was tested by a two-tailed Student's t-test. One-way analysis of variance was used for comparisons among groups, and pairwise comparisons between sample means were performed using the Bonferroni method. Statistical significance was set at P < 0.05.
Results
Characterization and GDNF secretion of ADSCs
After 24 h of culture, isolated ADSCs attached to culture dishes and exhibited extensive proliferative capacity. After two to three passages, the cells had a uniform spindle-shape and fibroblast-like morphology (Fig. 1A). Flow cytometry showed that ADSCs at passage 3 were highly positive for the mesenchymal markers CD44 and CD90 but negative for CD31 and CD45 (Fig. 1B). Thus, the isolated cells from adipose tissues possessed the characteristics of ADSCs.
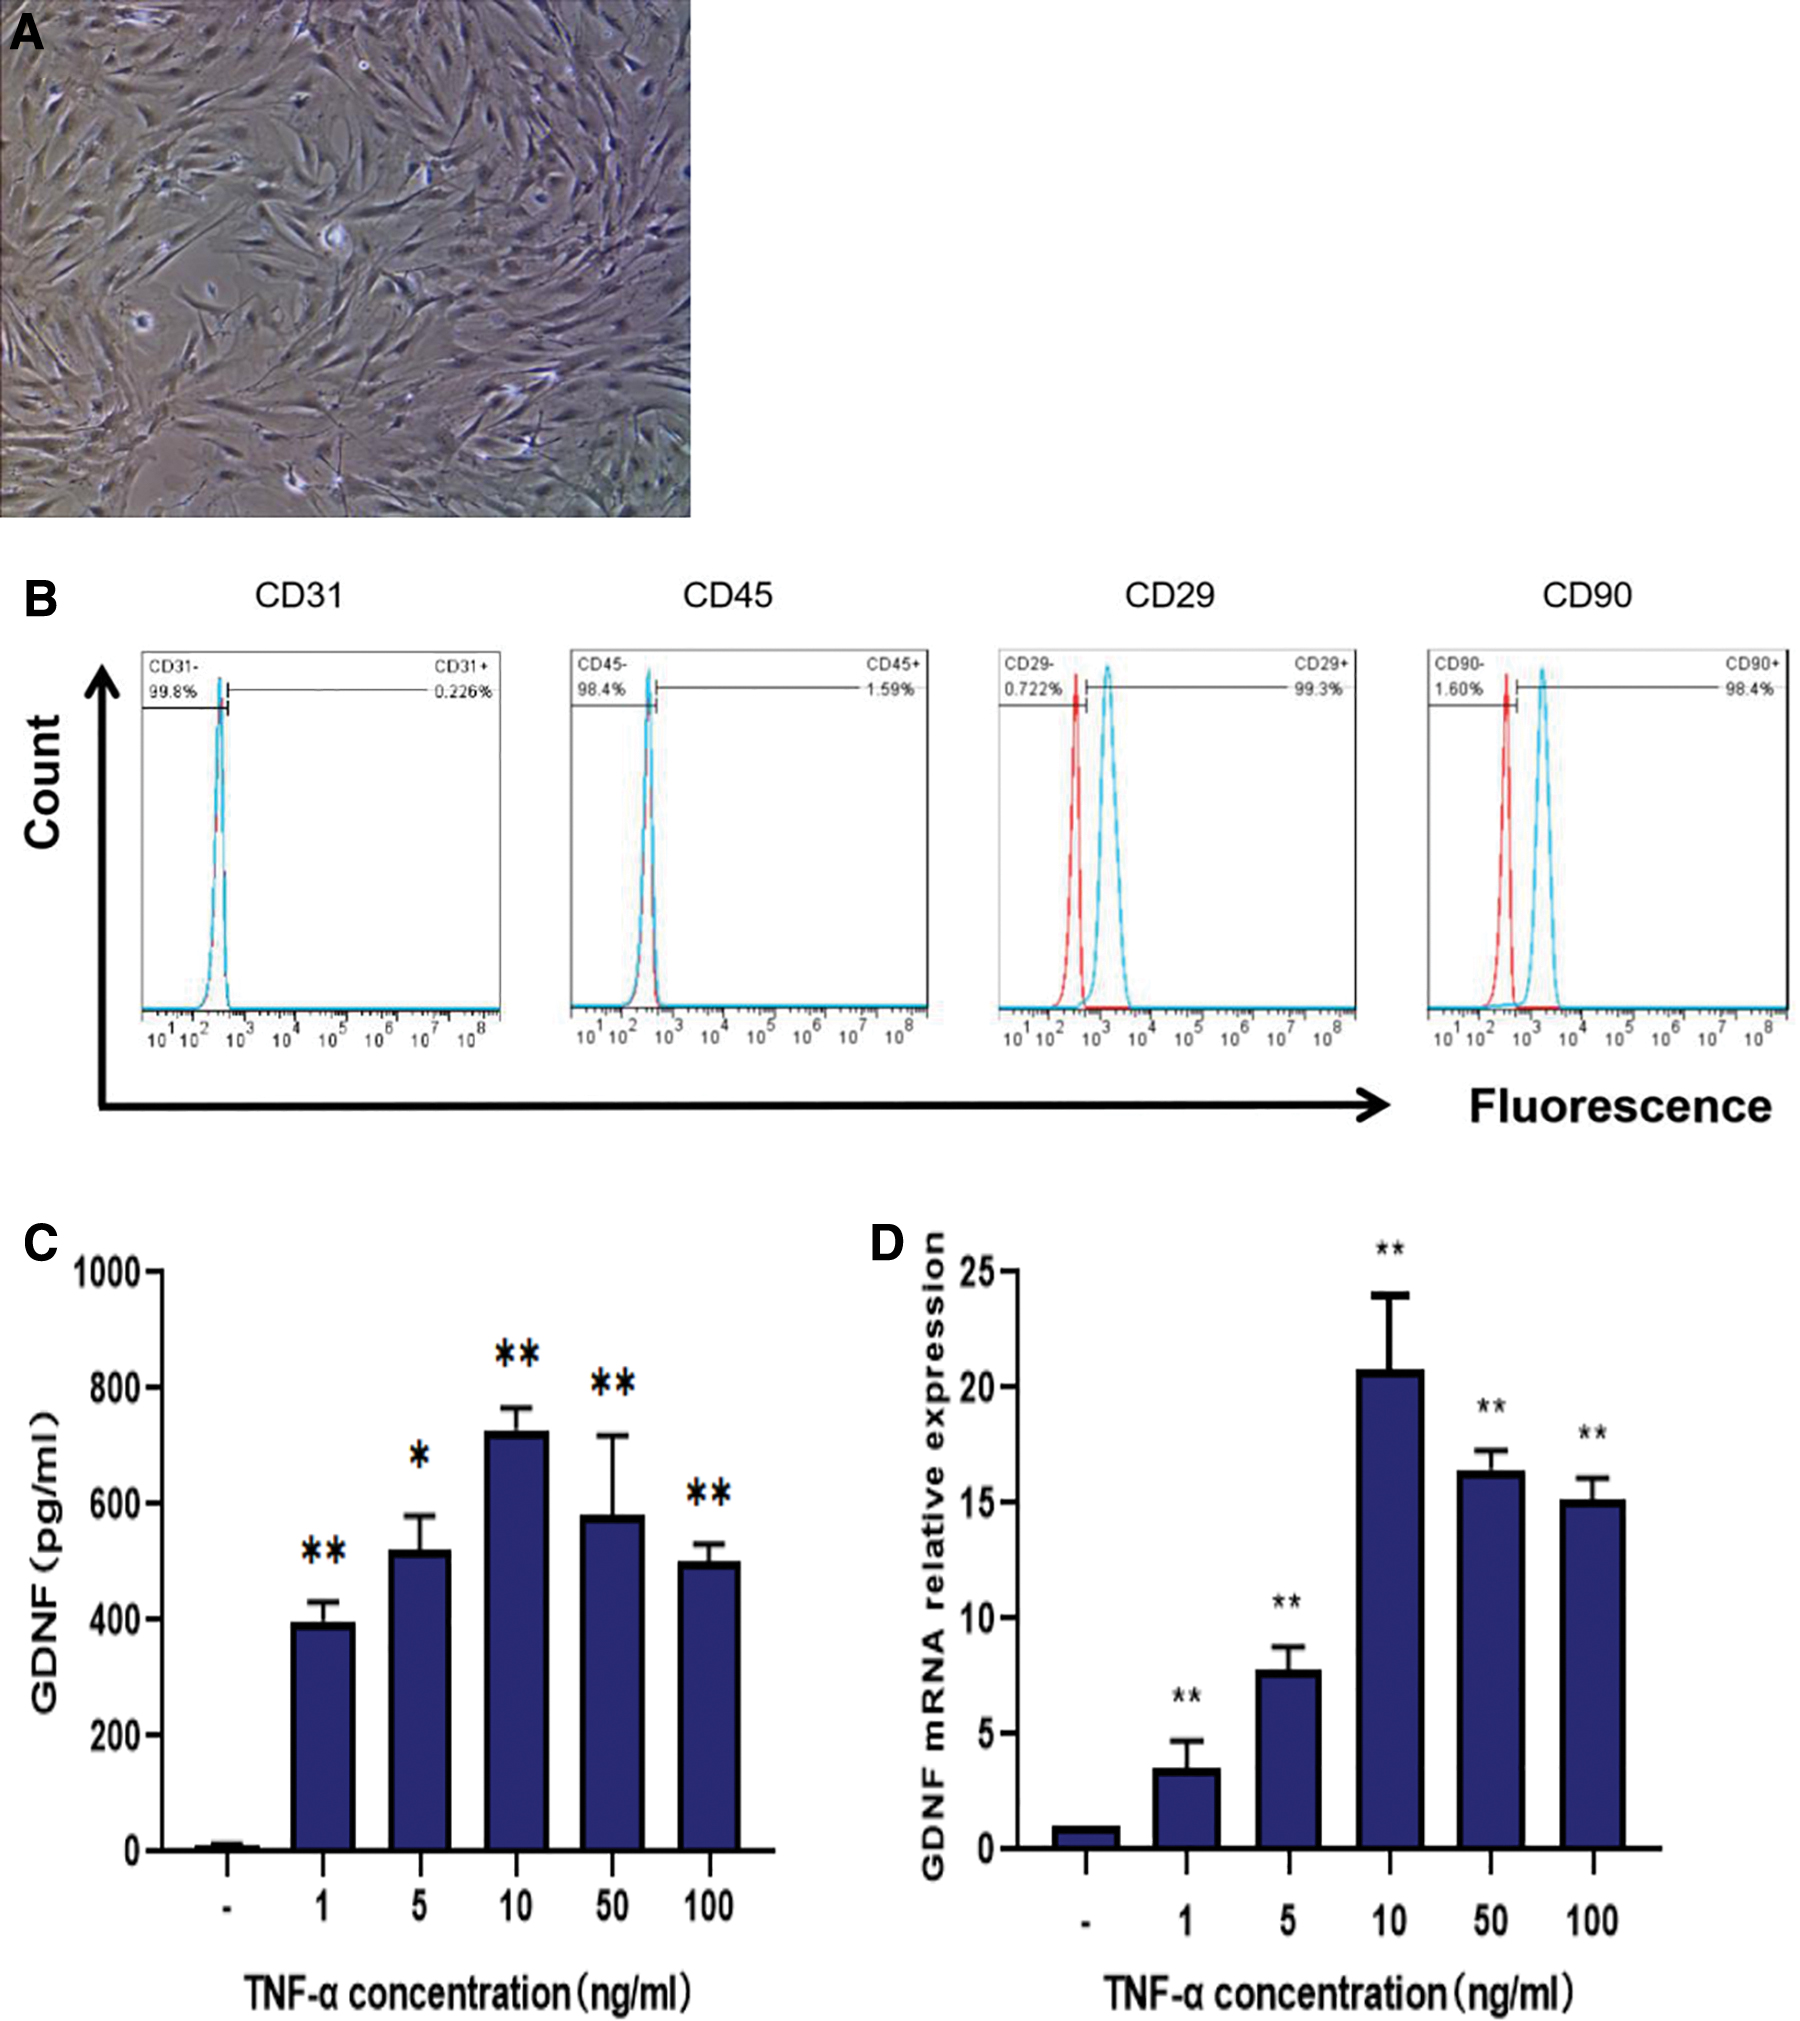
Identification and GDNF production of mouse ADSCs. (bar = 50 μm).
Next, we investigated GDNF concentrations in ADSC culture supernatants after treatment with different concentrations of TNF-α. Results showed that ADSCs produced significantly higher levels of GDNF after treatment with 10 ng/mL TNF-α, whereas treatment with other concentrations of TNF-α caused smaller increases in GDNF production (Fig. 1C). These results suggest that TNF-α, an inflammatory factor, induces GDNF production by ADSCs.
ADSCs regulate the production of IL-1β, TNF-α, IL-10, and TGF-β in LPS/IL-4-treated BV2 MG through GDNF
The production of IL-1β, TNF-α, IL-10, and TGF-β in the cell supernatants was measured by ELISA 24 h after the corresponding treatment. As shown in Fig. 2A and B, LPS induced an obvious increase in IL-1β and TNF-α production, whereas IL-4 induced a significant increase in IL-10 and TGF-β production, compared with those in the control group in BV2 MG culture supernatants. GDNF or ADSCs inhibited the production of IL-1β and TNF-α induced by LPS (Fig. 2A), whereas the production of IL-10 and TGF-β was significantly higher than that in the IL-4 group (Fig. 2B). These effects were partly abolished by GDNF silencing (Fig. 2A, B). These preliminary data indicate that GDNF produced by ADSCs inhibits the production of IL-1β and TNF-α induced by LPS in BV2 MG and upregulates the production of IL-10 and TGF-β.
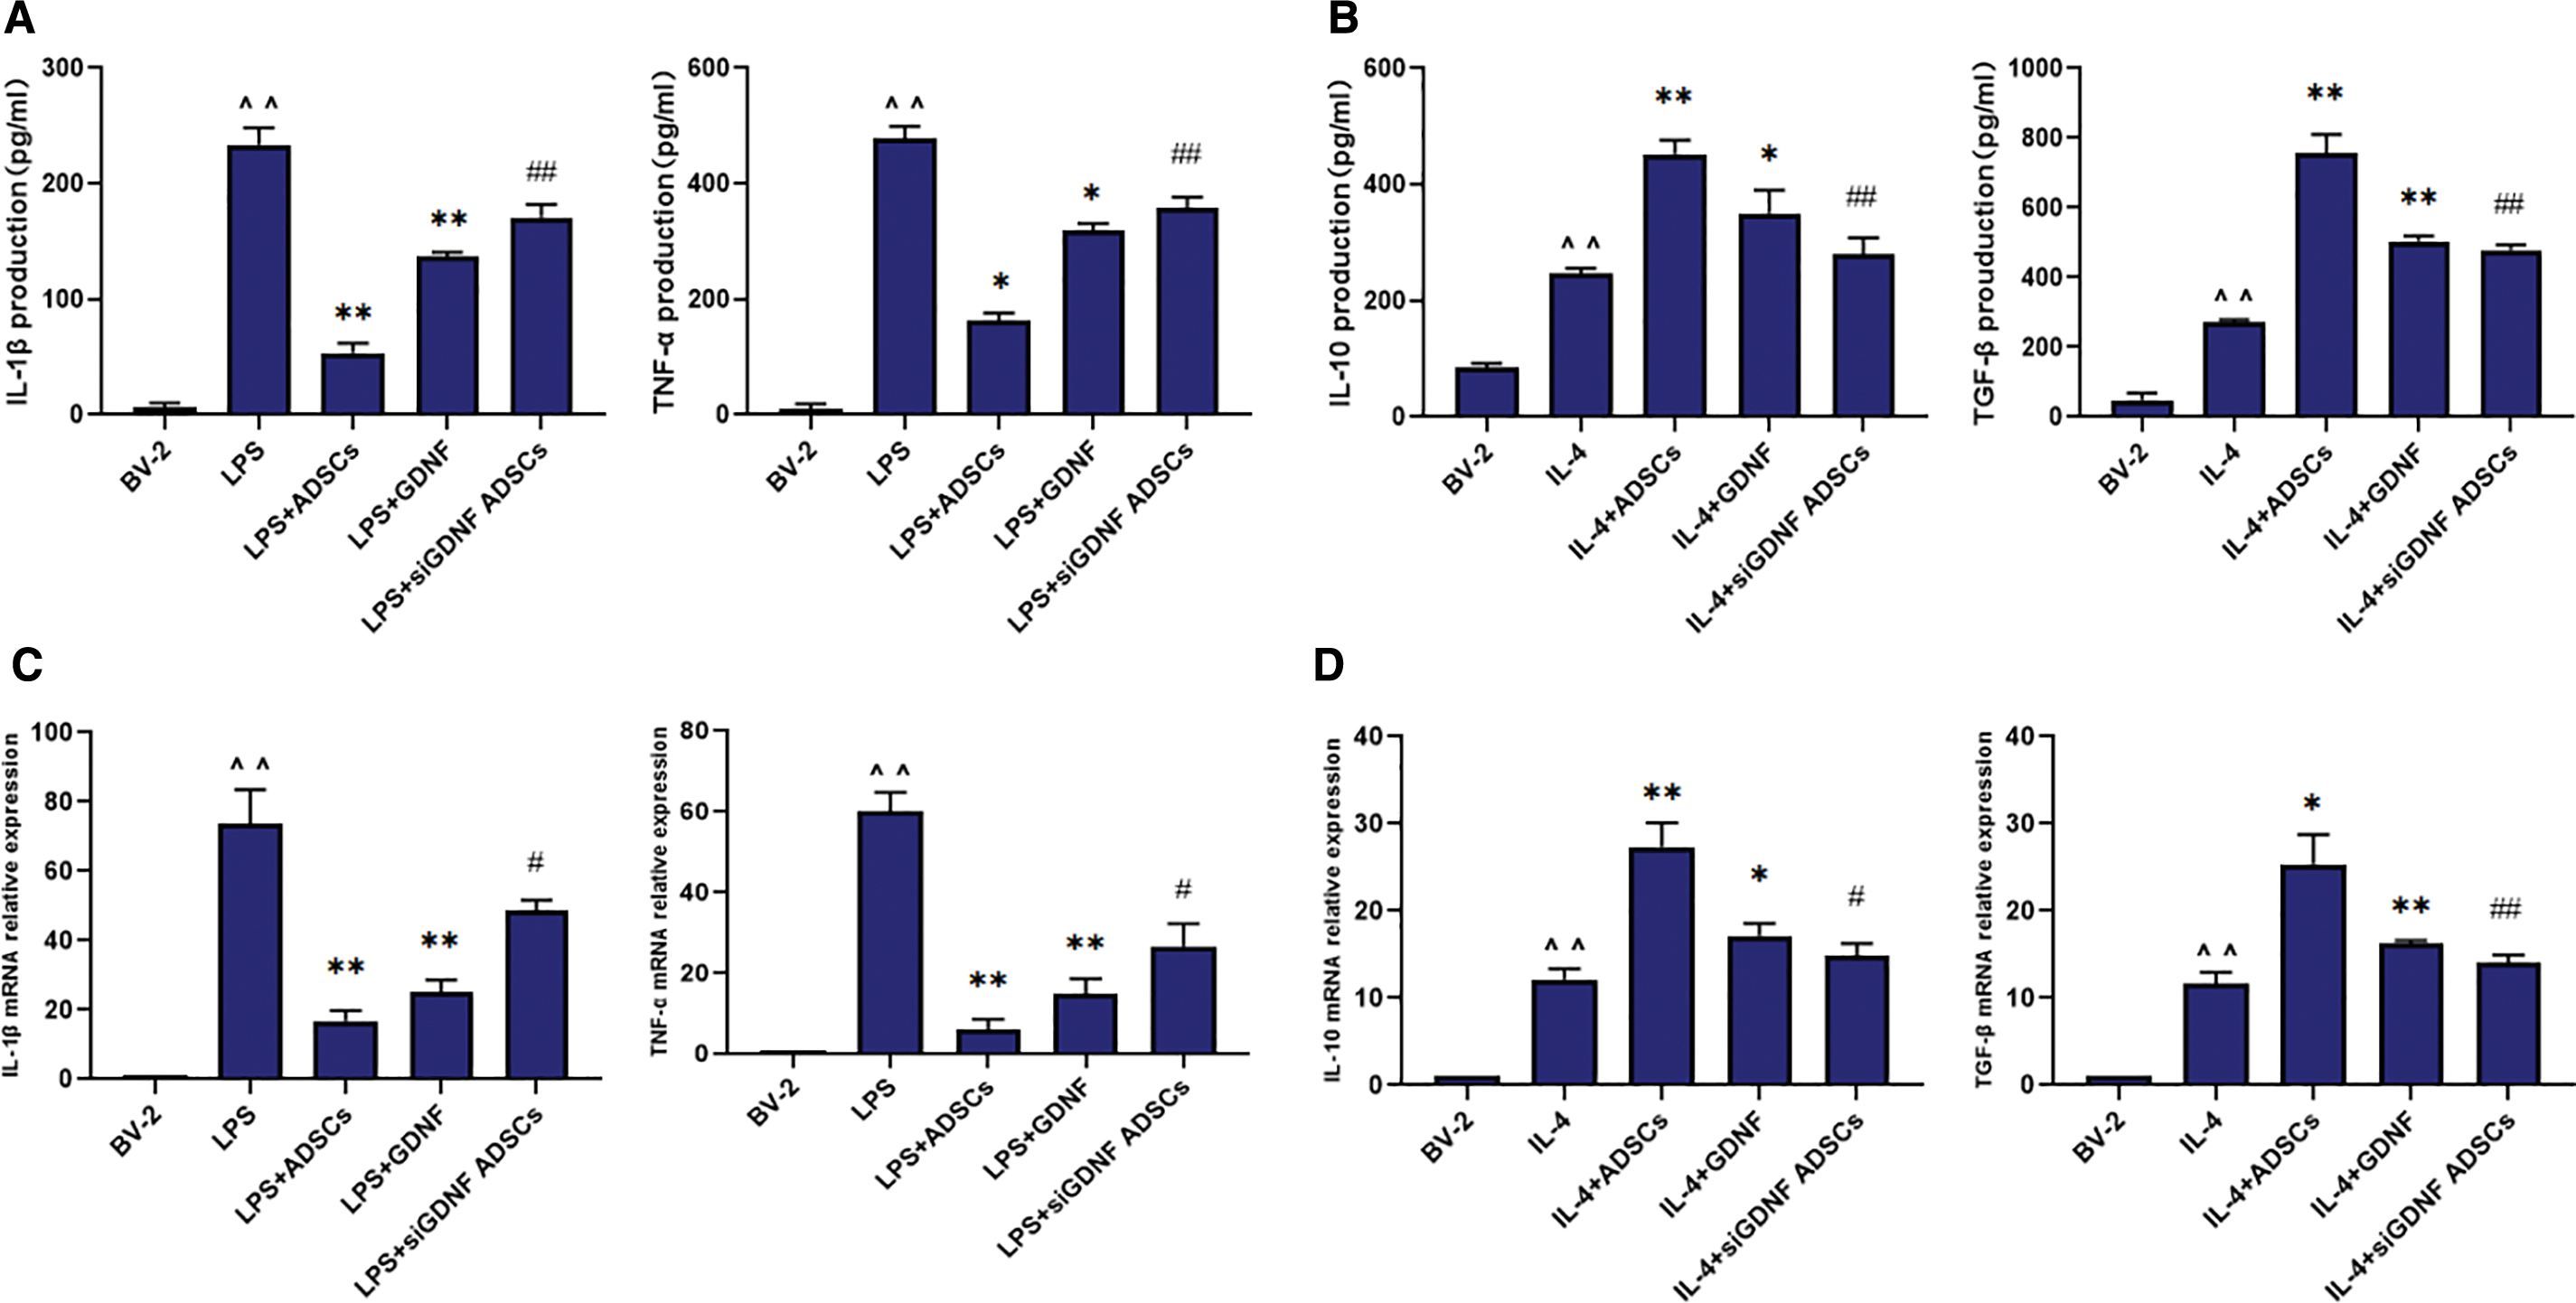
ADSCs affects the expression of IL-1β, TNF-α, IL-10, and TGF-β in LPS/IL-4-treated BV2 MG through GDNF. BV-2 cells were treated with ADSCs, GDNF, or GDNF-siRNA ADSCs for 24 h followed by LPS (100 ng/mL) and IL-4 (10 ng/mL) administration for 24 h. The levels of IL-1β, TNF-α, IL-10, and TGF-β in supernatant were detected by ELISA
After the corresponding treatment for 24 h, qRT-PCR was performed to measure the expression of mRNA encoding IL-1β, TNF-α, IL-10, and TGF-β. As shown in Fig. 2C and D, IL-1β and TNF-α mRNA increased significantly in the LPS-treated group, whereas IL-4 induced a significant increase in IL-10 and TGF-β mRNA in BV2 MG compared with levels in the control group. GDNF or ADSCs reduced LPS-induced IL-1β and TNF-α mRNA levels and upregulated IL-4-induced IL-10 and TGF-β mRNA (Fig. 2C, D). These effects were also partly abolished by GDNF silencing (Fig. 2C, D). Thus, GDNF produced by ADSCs downregulates the mRNA expression of IL-1β and TNF-α induced by LPS in BV2 MG and upregulates the mRNA expression of IL-10 and TGF-β induced by IL-4. In summary, GDNF produced by ADSCs inhibits the gene and protein expression of IL-1β and TNF-α, which are inflammatory factors related to M1 MG, while promoting the expression of the M2 MG anti-inflammatory factors IL-10 and TGF-β.
ADSCs affect LPS/IL-4-induced BV2 microglial morphological changes through GDNF
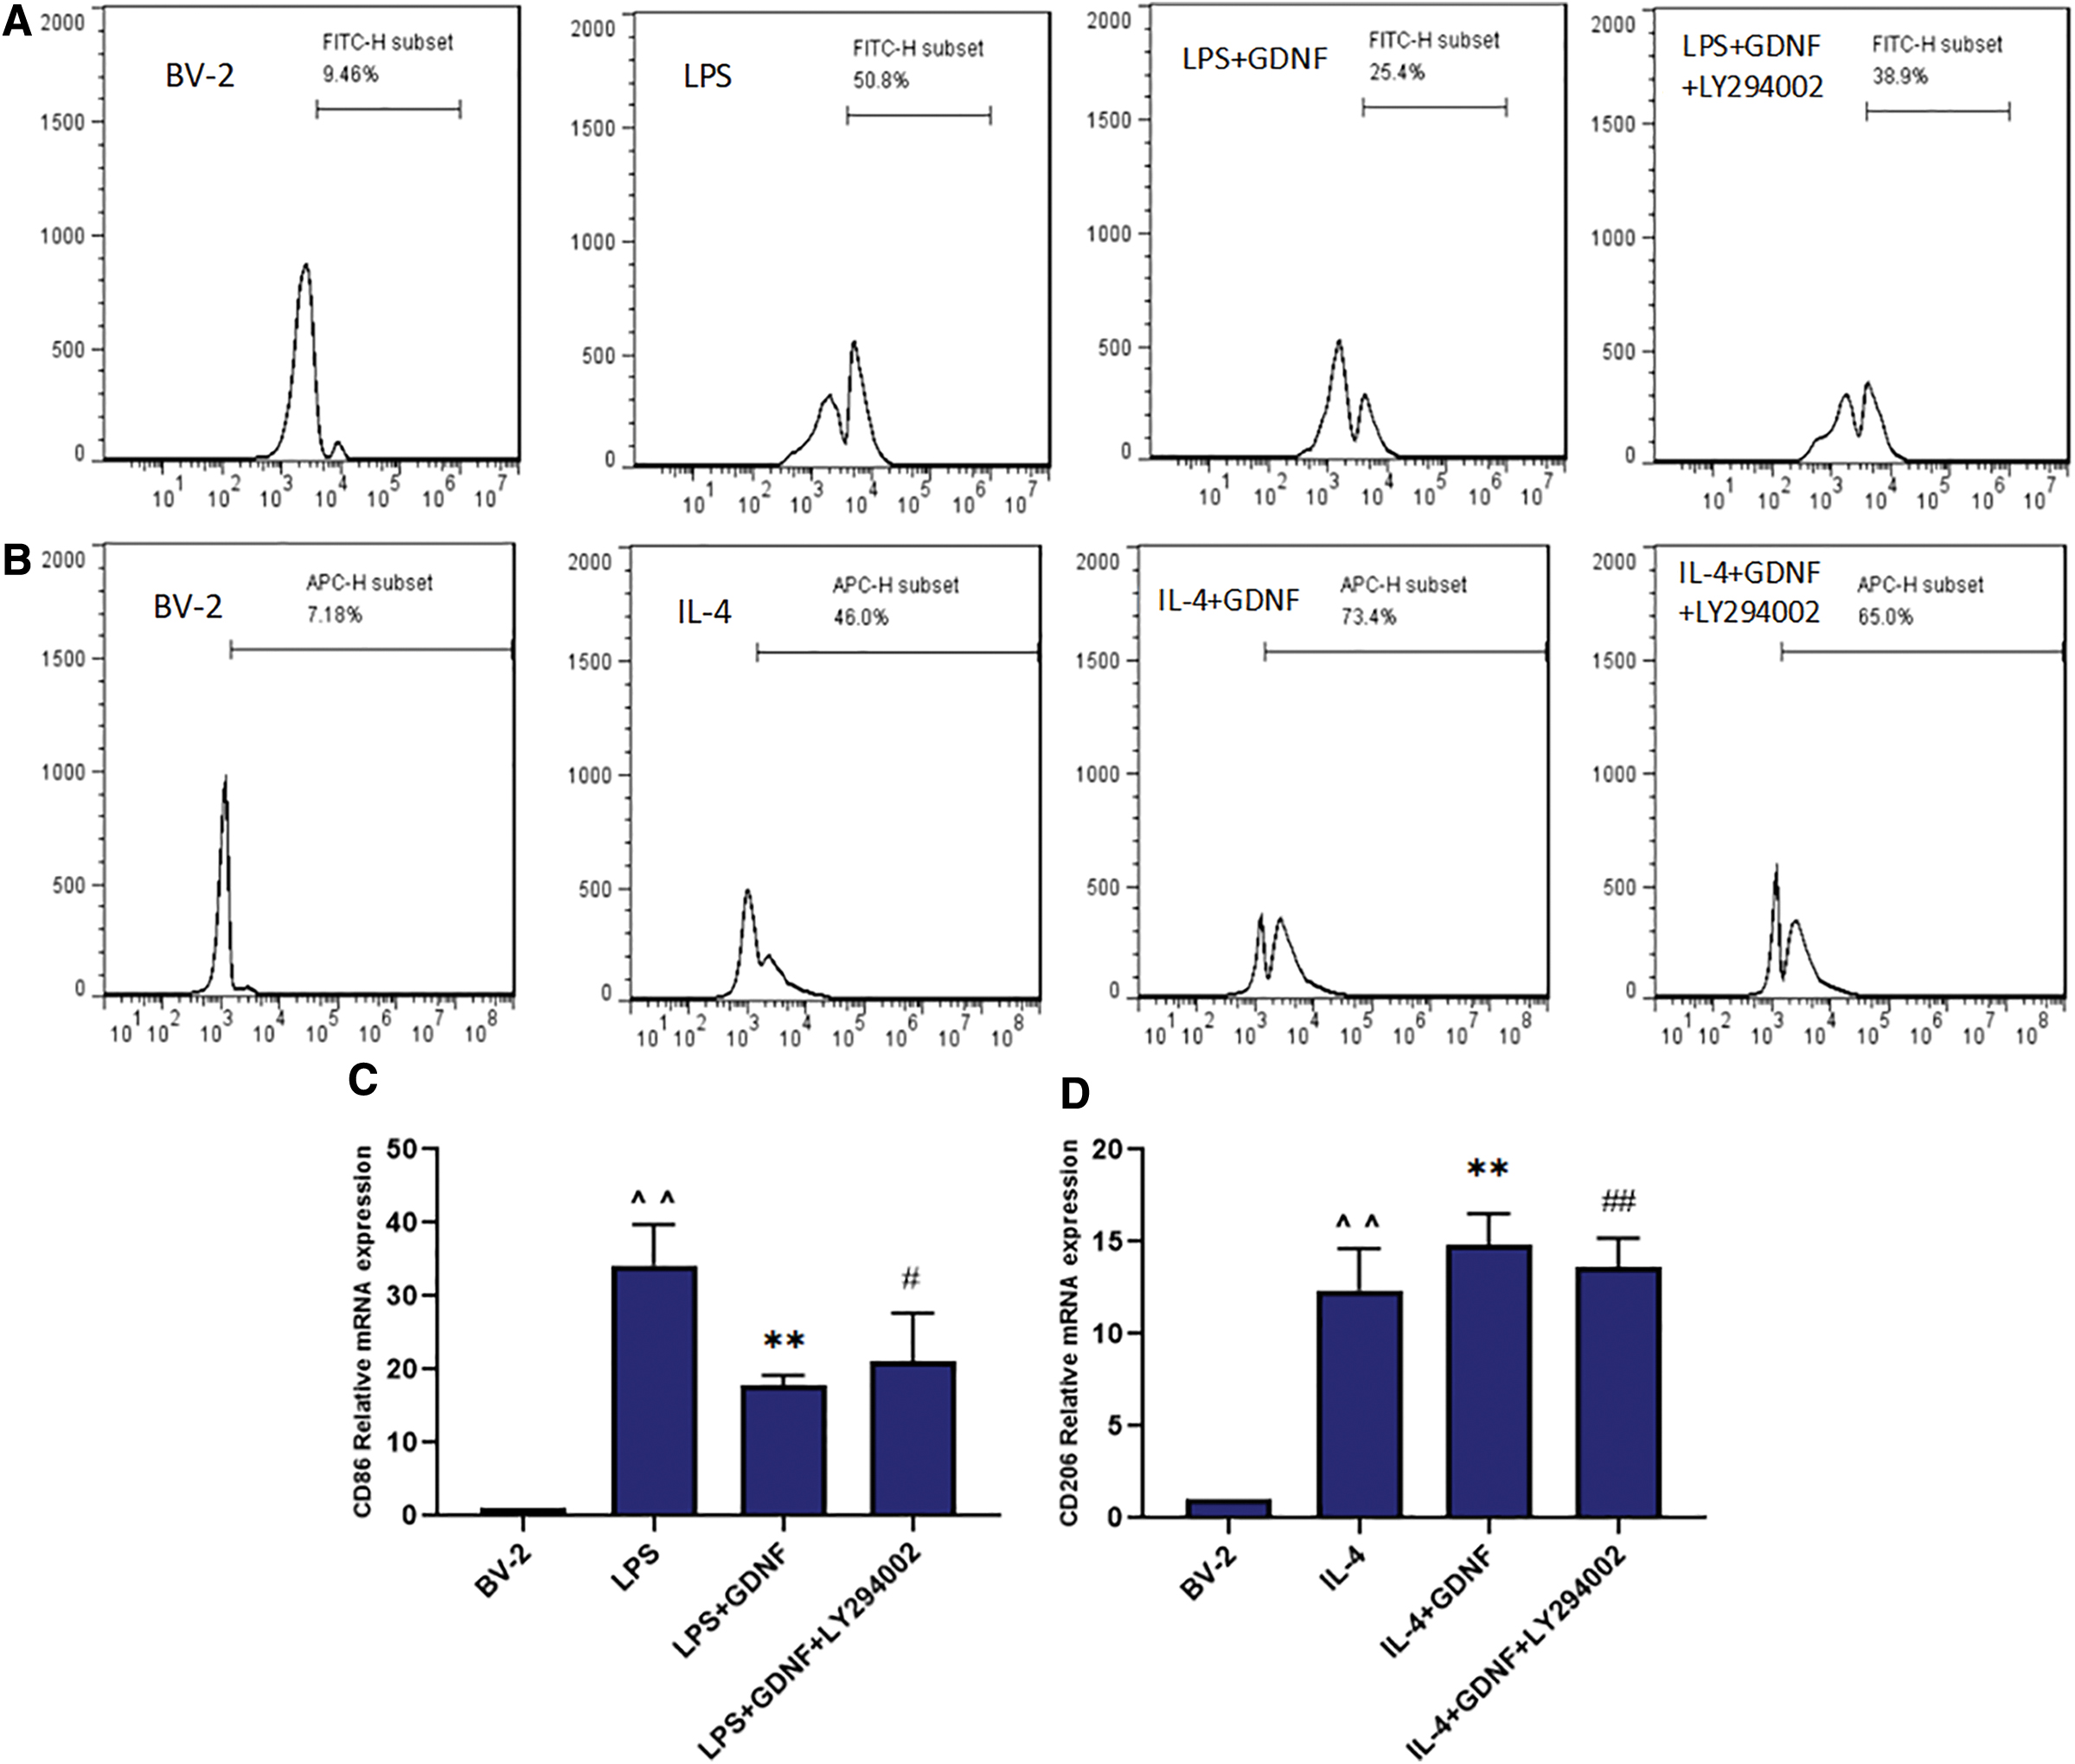
CD86 is an M1 MG cell membrane marker, whereas CD206 is an M2 MG marker that can be detected by flow cytometry. We observed CD86- and CD206-positive expression in each group at 24 h after the corresponding treatment. As shown in Fig. 3A and B, the average fluorescence intensity of CD86 in the control group was only 9.46%, indicating a low expression level. In the LPS group, the mean fluorescence intensity increased to 50.8%, indicating that CD86-positive expression was significantly enhanced. Treatment with ADSCs or GDNF induced the expression of CD86 and the mean fluorescence intensities were 12.3 and 25.4, respectively. These effects were partly abolished by GDNF silencing in the si-GDNF ADSC treatment group, with the average fluorescence intensity increasing to 28.5%. In contrast, the control group showed an average fluorescence intensity for CD206 of only 7.18%, a low expression level. In the IL-4 group, the mean fluorescence intensity increased to 46.0%, indicating a high expression level. In the group treated with ADSCs or GDNF, the mean fluorescence intensities significantly increased to 85.0% and 73.4%. In the group treated with si-GDNF ADSCs, the average fluorescence intensity decreased to 68.9%. Thus, GDNF secreted by ADSCs inhibits the expression of CD86 and upregulates the expression of CD206.
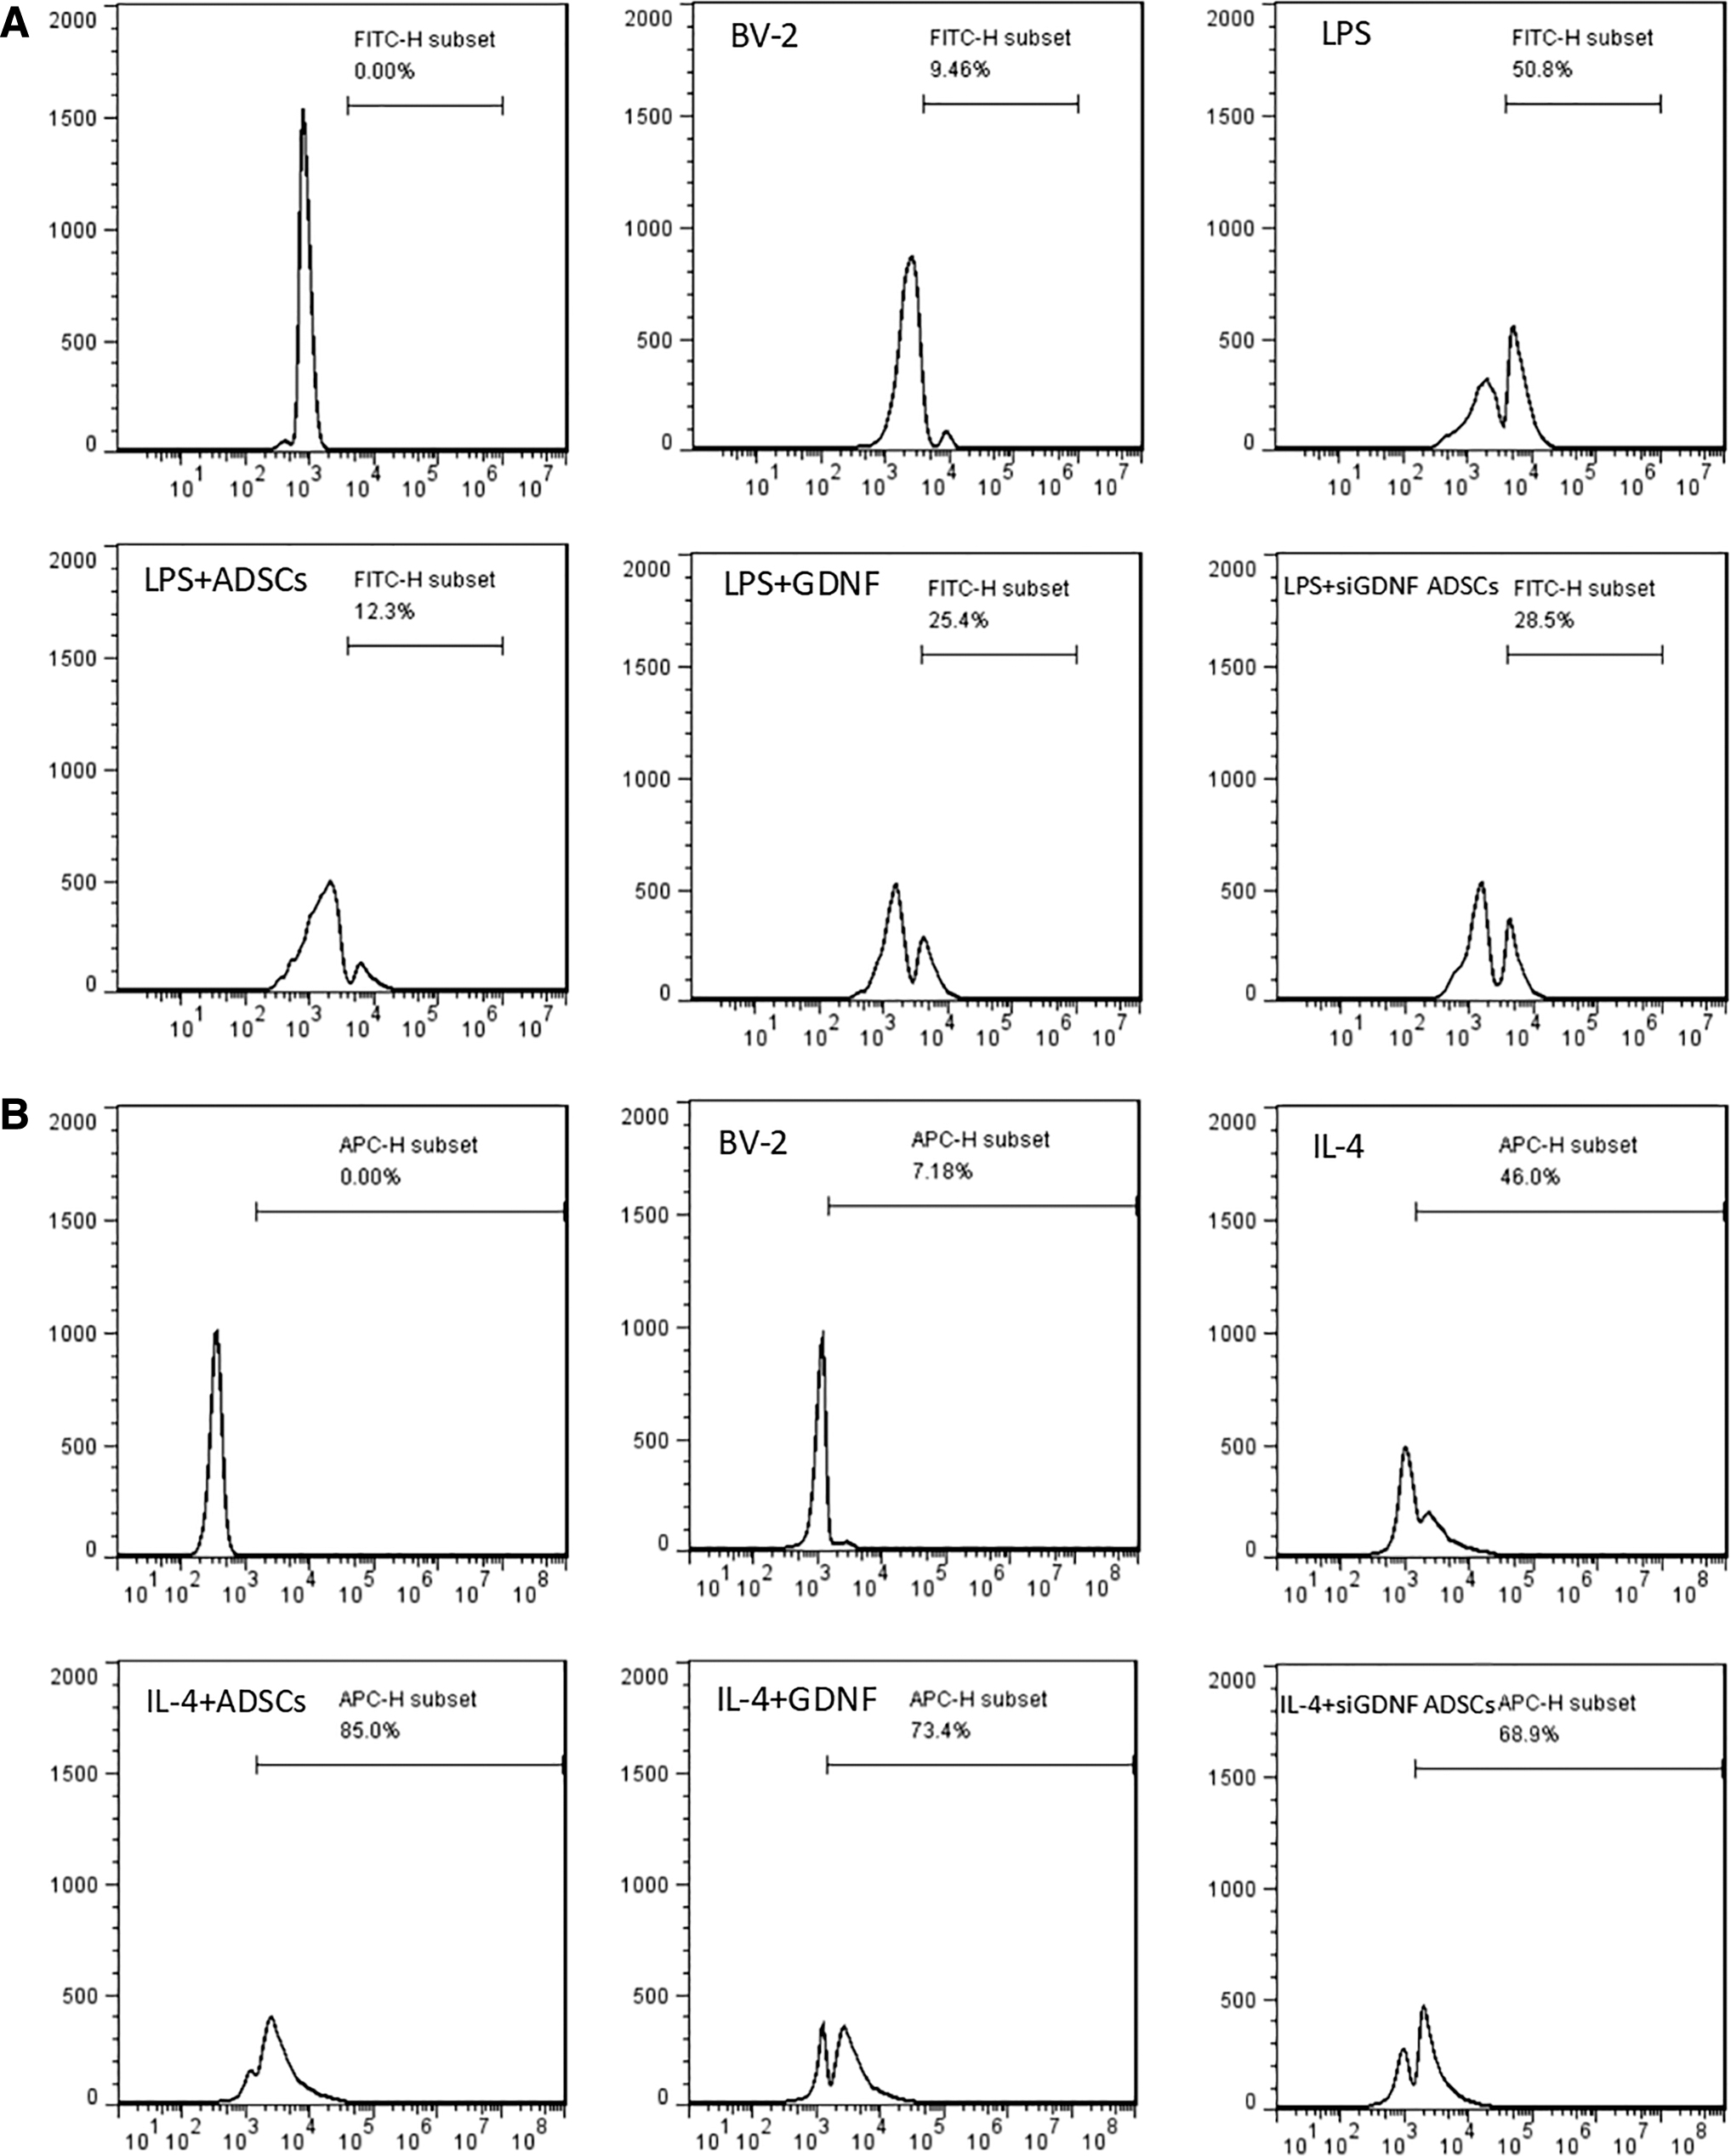
ADSCs affect LPS/IL-4-induced BV2 MG morphological changes through GDNF. BV-2 cells were pretreated with ADSCs, GDNF, or GDNF-siRNA ADSCs for 24 h followed by LPS (100 ng/mL)/IL-4 (10 ng/mL) administration for 24 h. The protein expression levels of CD86 and CD206 were measured by flow cytometry
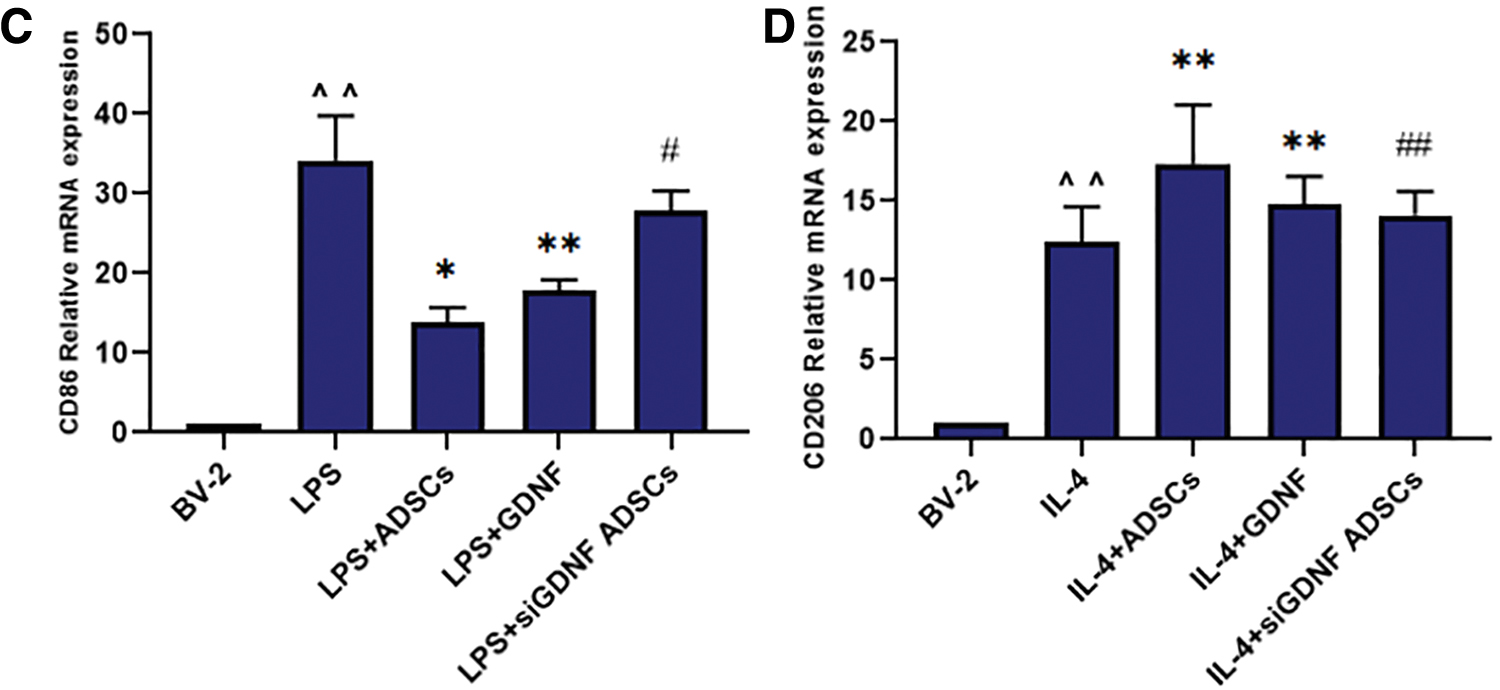
The expression of CD86 and CD206 mRNA was detected by qRT-PCR 24 h after the corresponding treatment. As shown in Fig. 3C and D, the relative expression of CD86 mRNA in the LPS group and CD206 mRNA in the IL-4 group was obviously increased compared with that in the BV2 MG group. After treatment with GDNF or ADSCs, the expression of CD86 was significantly decreased, whereas that of CD206 was obviously increased; these effects were partly abolished by GDNF silencing. Therefore, GDNF secreted by ADSCs inhibits the expression of the M1 marker CD86 and upregulates the expression of the M2 marker CD206 at the transcriptional level.
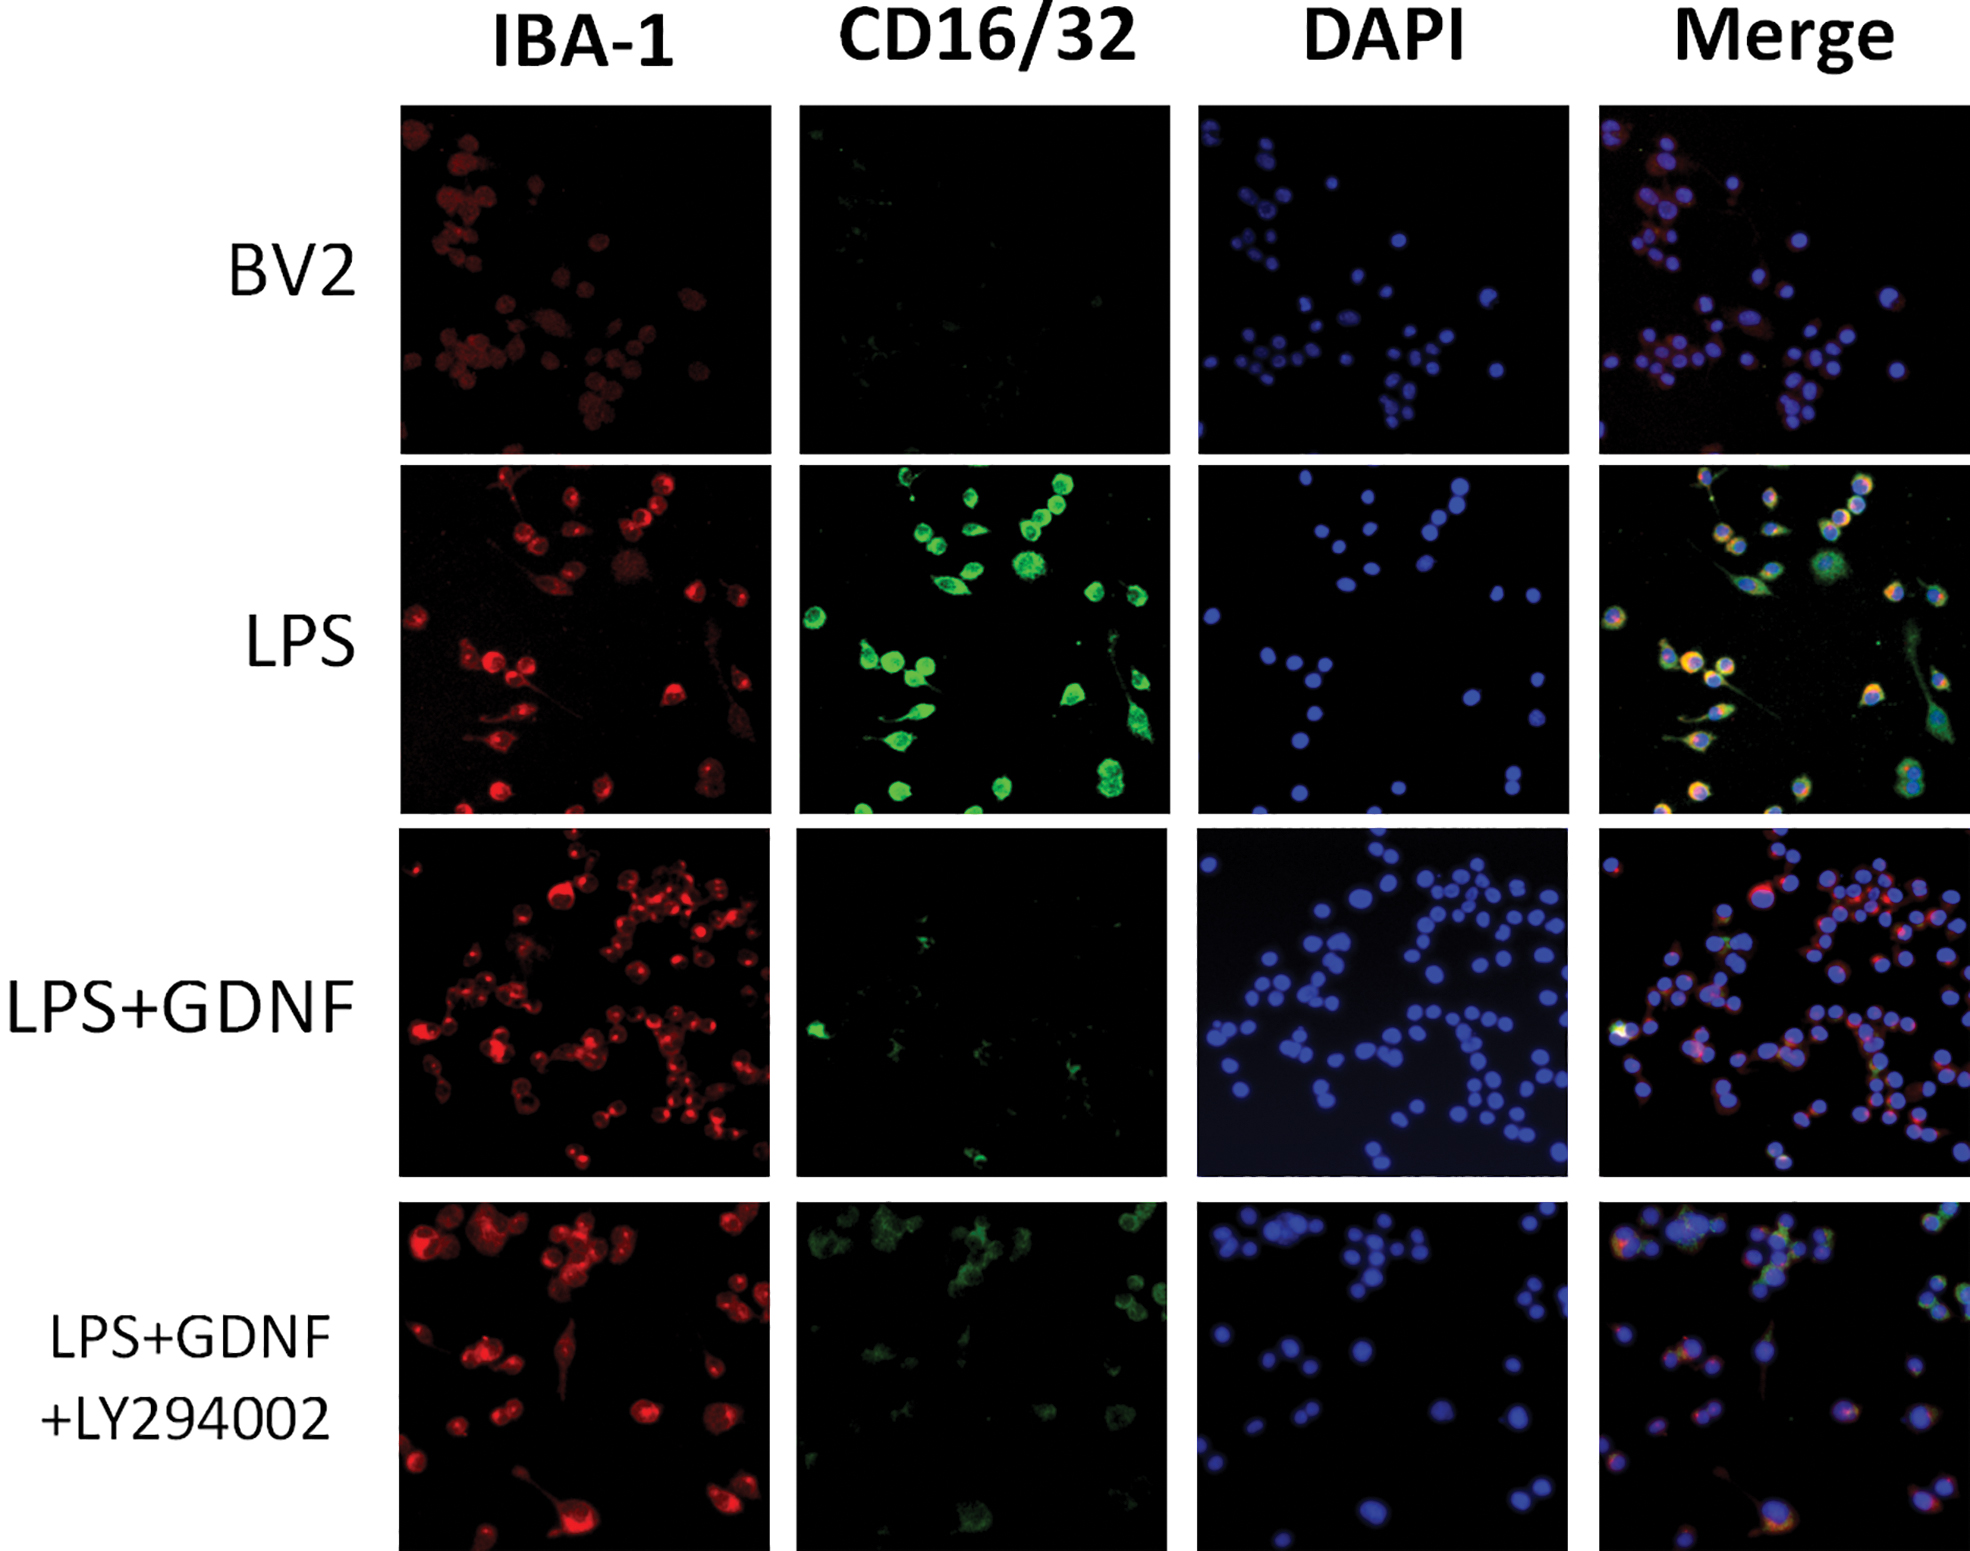
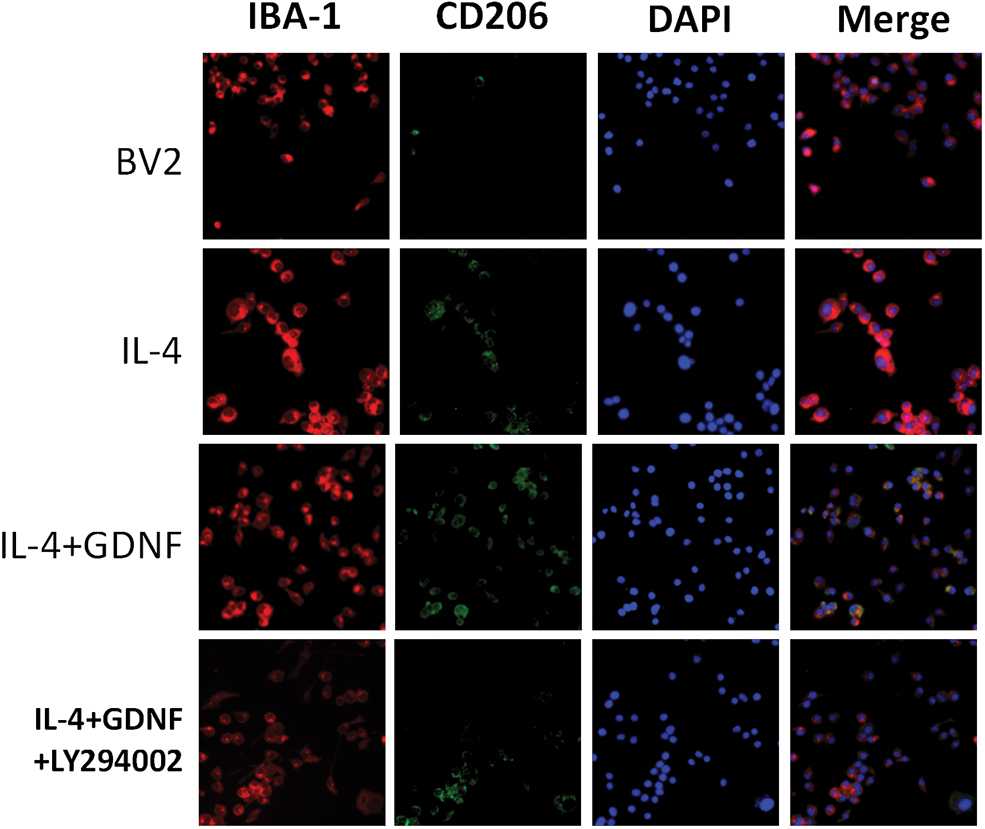
Double IF staining showed that the expression of CD16/32 and CD206 in the LPS/IL-4 group was significantly increased compared with that in the BV2 MG group. ADSCs or GDNF reduced LPS-induced CD16/32 expression levels and upregulated IL-4-induced CD206 expression levels. These effects were also partly abolished by GDNF silencing (Figs. 4 and 5). Thus, GDNF produced by ADSCs downregulates the expression of CD16/32 induced by LPS in BV2 MG and upregulates the expression of CD206 induced by IL-4. Flow cytometry, double IF staining, and qRT-PCR also indicated that the GDNF secreted by ADSCs inhibits expression of the M1-type biomarker CD86 or CD16/32 at the gene and protein levels, but upregulates the M2-type biomarker CD206.
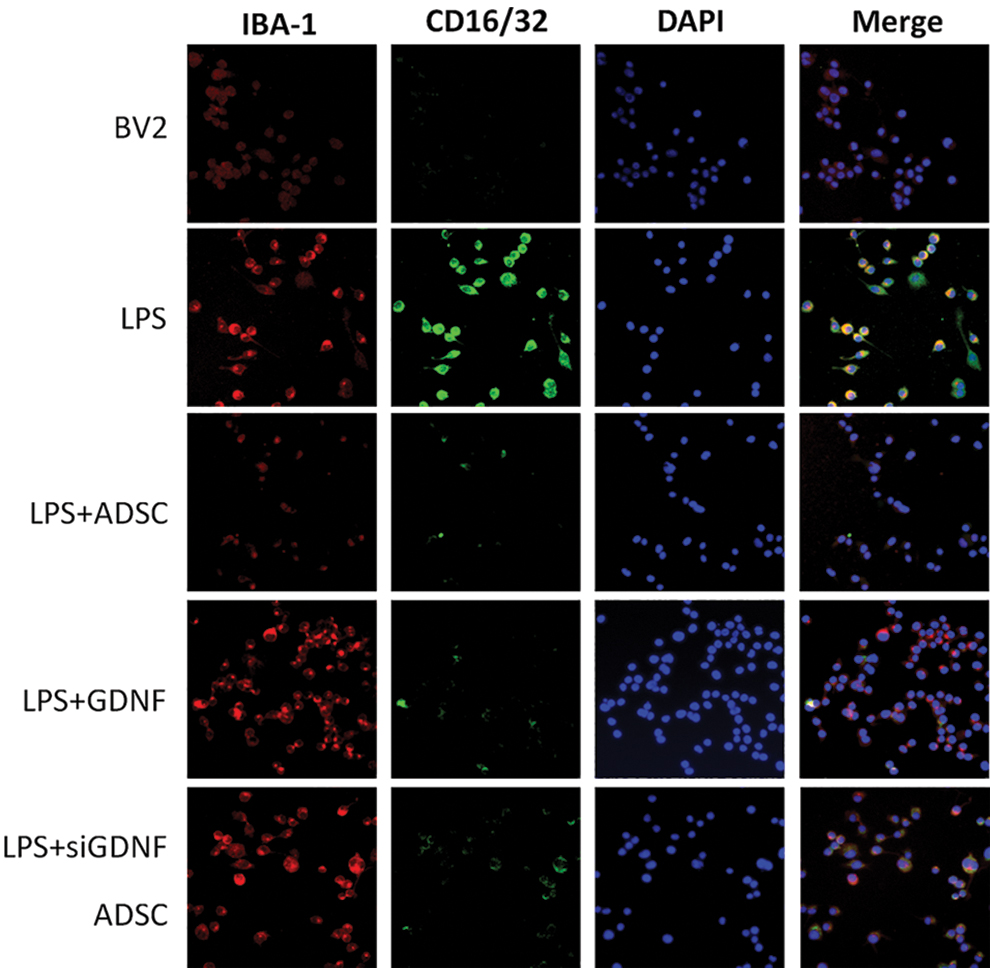
ADSCs affect LPS-induced BV2 MG morphological changes through GDNF. BV-2 MG were pretreated with ADSCs, GDNF, or GDNF-siRNA ADSCs for 24 h followed by LPS (100 ng/mL) administration for 24 h. The protein expression levels of iNOS were visualized by IF. Red fluorescence indicated IBA-1-positive cells, green fluorescence indicated iNOS-positive cells, while blue fluorescence indicated DAPI-labeled nuclei. IF, immunofluorescence; iNOS, induced nitric oxide synthase. Color images are available online.
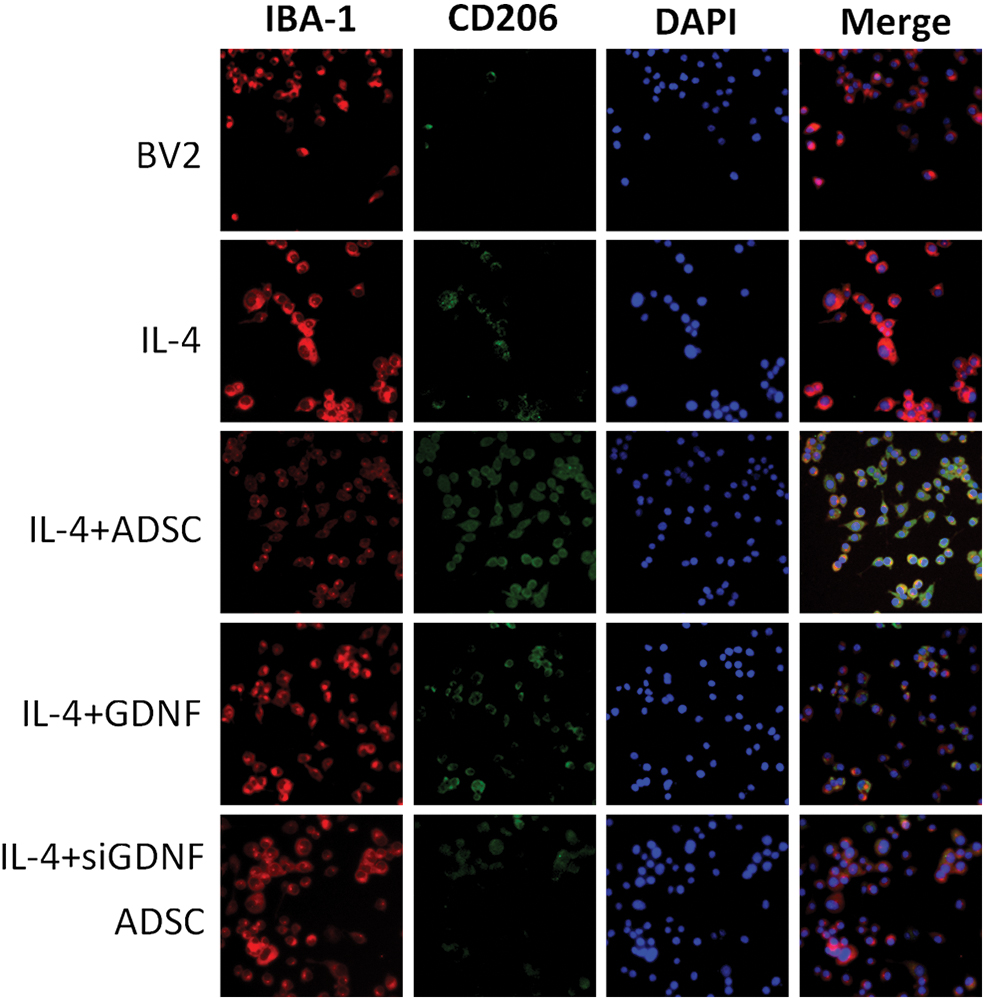
ADSCs affects IL-4-induced BV2 MG morphological changes through GDNF. BV-2 MG were pretreated with ADSCs, GDNF, or GDNF-siRNA ADSCs for 24 h followed by IL-4 (10 ng/mL) administration for 24 h. The protein expression levels of Arg-1 were visualized by IF. Red fluorescence indicated IBA-1-positive cells, green fluorescence indicated Arg-1-positive cells, while blue fluorescence indicated DAPI-labeled nuclei. Arg-1, arginase-1. Color images are available online.
GDNF produced by ADSCs regulates the PI3K/AKT signaling pathway
Preliminary observations of the effect of GDNF produced by ADSCs on expression of the PI3K/AKT signaling pathway
A previous study emphasized the involvement of the PI3K/AKT signaling pathways in modulating neuroinflammation. Thus, we detect the key components of this pathway by western blotting to examine the effect of GDNF on this pathway. We found that GDNF upregulated the expression of p-PI3K and p-AKT, which was partly inhibited by GDNF silencing (Fig. 6). In addition, the levels t-PI3K and t-AKT were barely changed, indicating that PI3K/AKT was activated by GDNF produced by ADSCs. Therefore, GDNF upregulated the activation of PI3K/AKT during microglial differentiation. However, after blocking GDNF expression, the regulatory effects of ADSCs on the PI3K signaling pathway were diminished, indicating that GDNF produced by ADSCs modulates the polarization of BV2 MG through the PI3K/AKT signaling pathway.
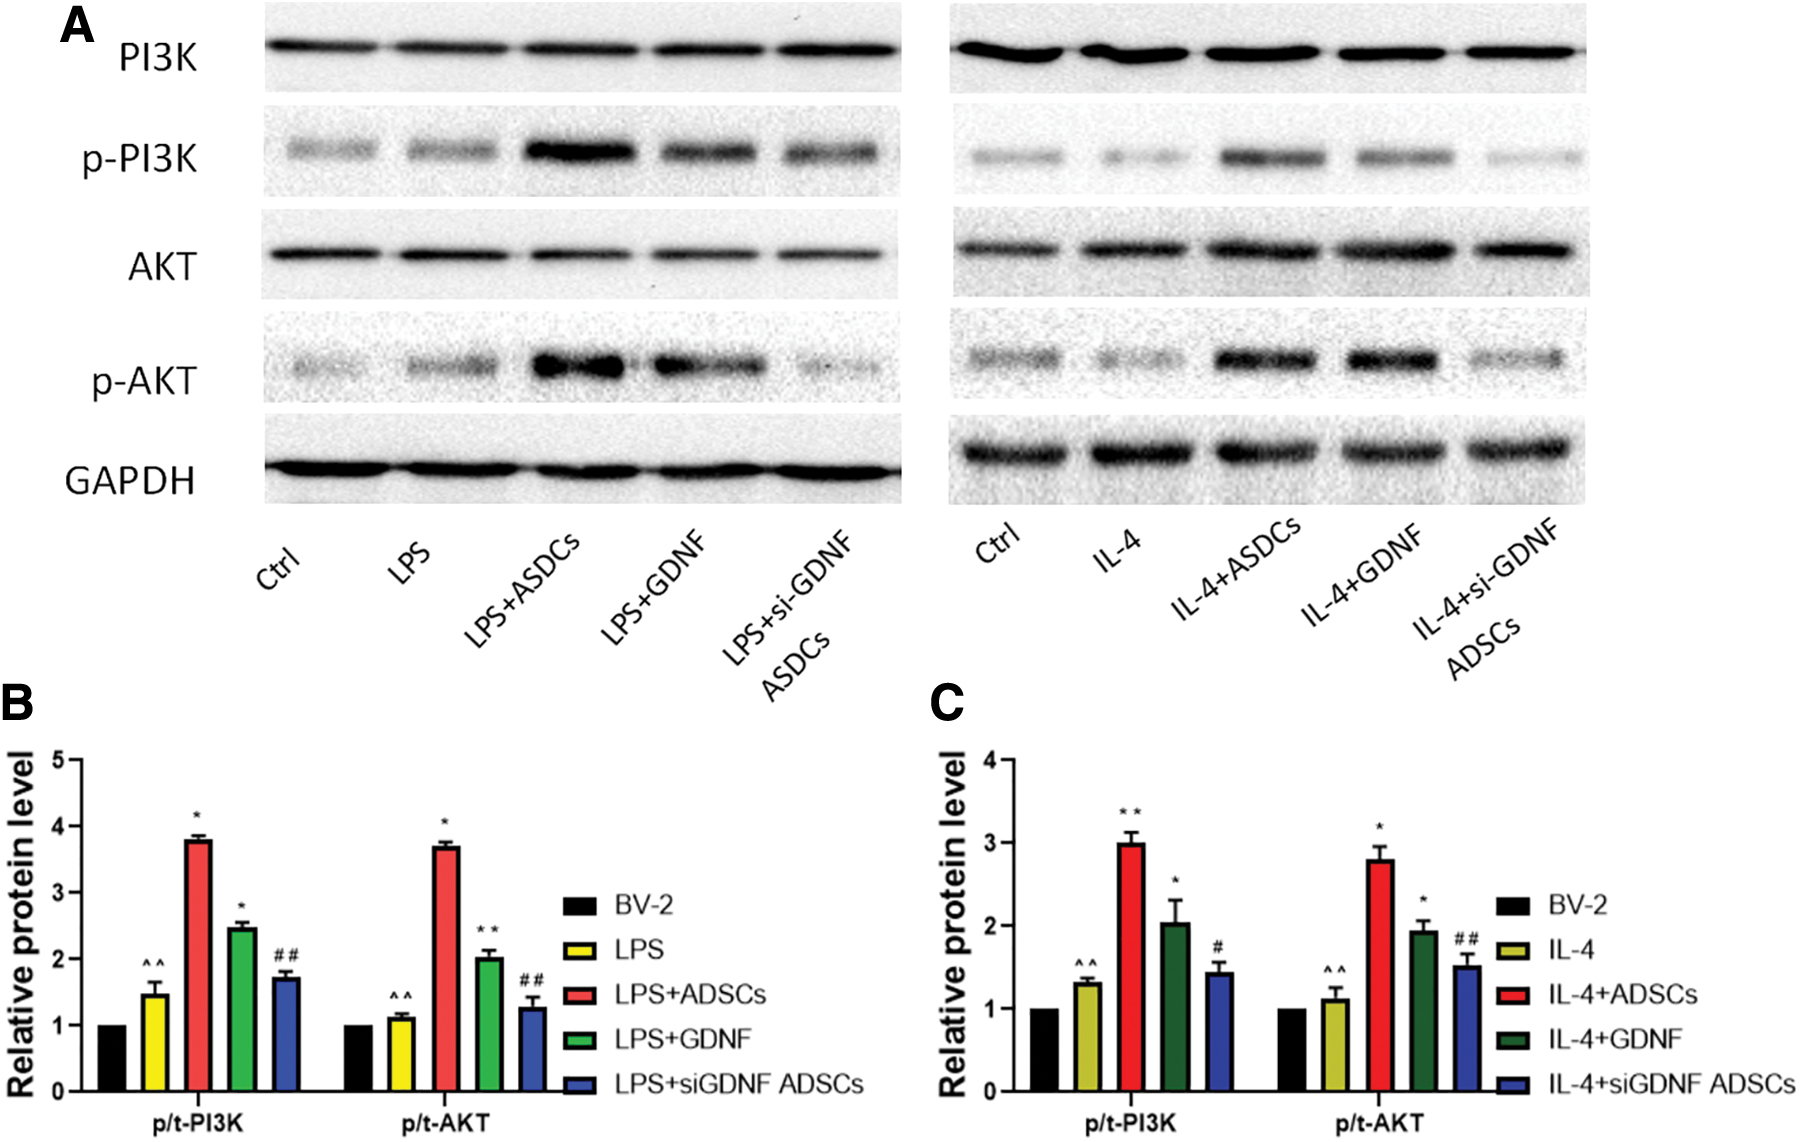
GDNF promoted the PI3K/AKT signaling pathway activation. BV-2 cells were treated with ADSCs, GDNF, or GDNF-siRNA ADSCs for 24 h before LPS (100 ng/mL)/IL-4 (10 ng/mL) treatment. Cultures were harvested to detect the protein expressions of PI3K, AKT, pPI3K, and pAKT by western blot assay (
Effect of GDNF on PI3K/AKT signaling and the release of IL-1β, TNF-α, IL-10, and TGF-β from BV2 MG
Next, we blocked the PI3K signaling pathway with LY294002. Each group was treated for 24 h, and ELISA and qRT-PCR were performed to measure the expression of inflammatory factors (IL-1β and TNF-α) and anti-inflammatory mediators (IL-10 and TGF-β). Compared with that in the BV2 MG group, the production of IL-1β and TNF-α in the LPS group and IL-10 and TGF-β in the IL-4 group was obviously increased; in contrast, compared with that in the LPS and IL-4 groups, the production of IL-1β and TNF-α in the GDNF group was obviously decreased (Fig. 7A, C), whereas the production of IL-10 and TGF-β was increased (Fig. 7B, D). These effects were abolished by the PI3K inhibitor LY294002. Thus, the inflammatory cytokines IL-1β and TNF-α were increased in the LY294002+GDNF+LPS group, whereas IL-10 and TGF-β were decreased, confirming that GDNF regulates the production of inflammatory and anti-inflammatory factors by modulating the polarization of BV2 MG through the PI3K signaling pathway.
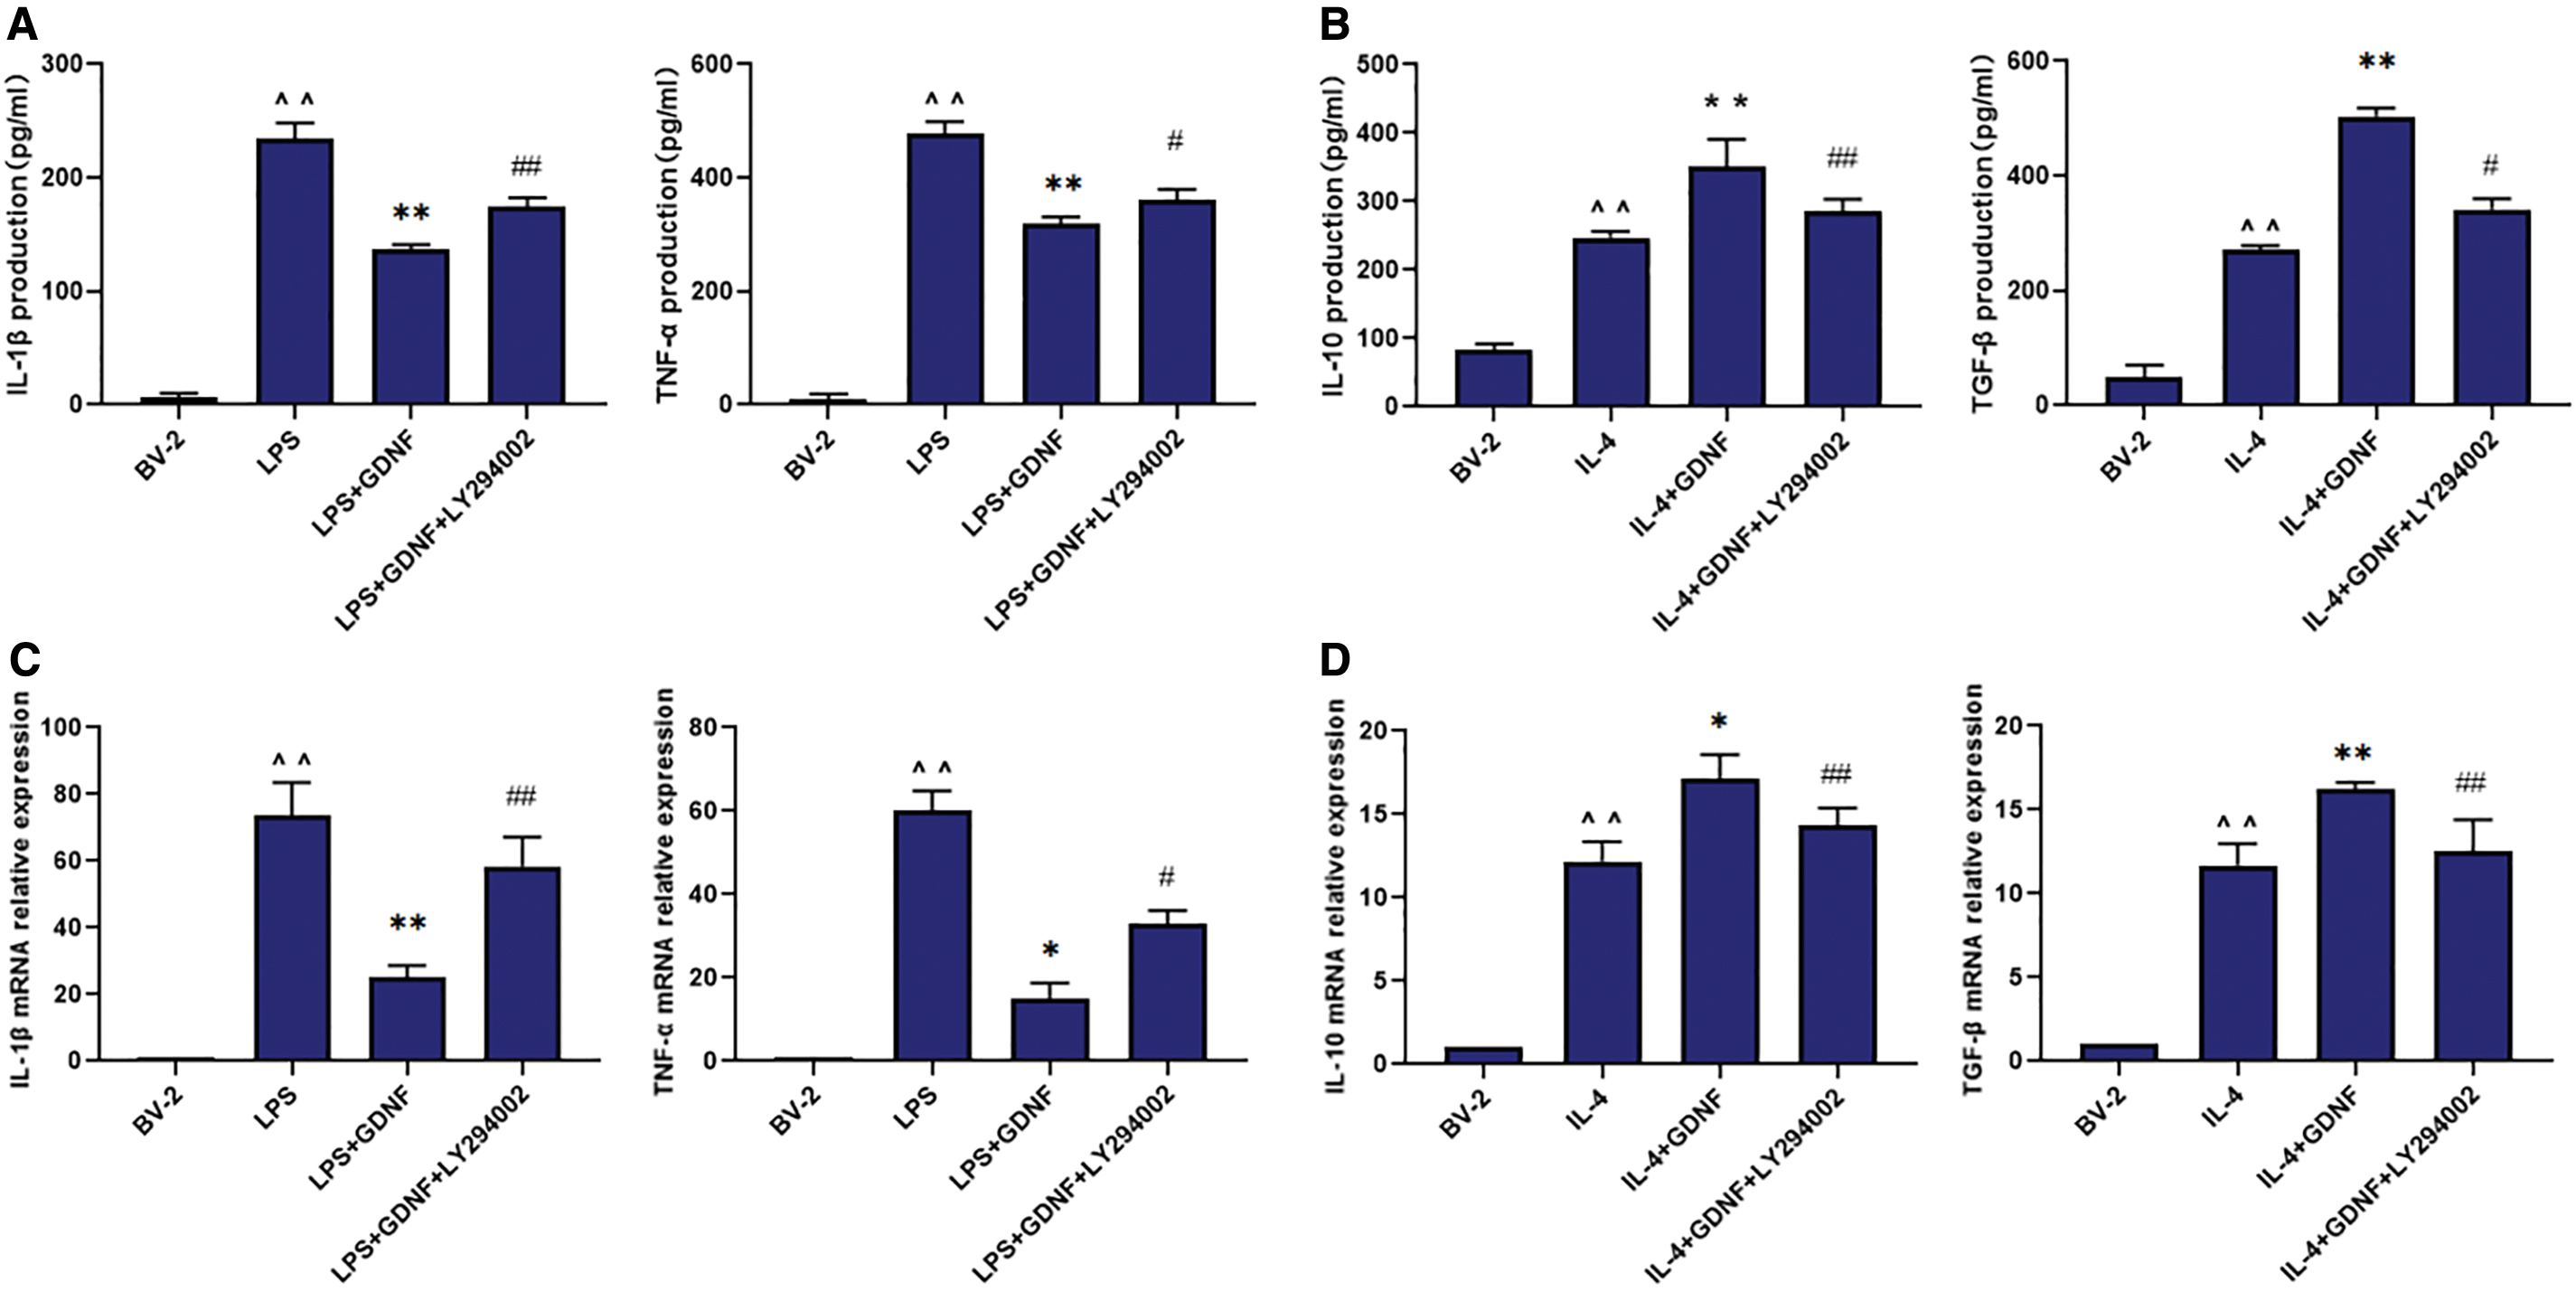
Effect of GDNF on PI3K/AKT signaling pathway and microglial release of IL-1β, TNF-α, IL-10, and TGF-β after LPS/IL-4 treatment. BV-2 cells were treated with GDNF or GDNF+LY294002 for 24 h followed by LPS (100 ng/mL)/IL-4 (10 ng/mL) administration for 24 h. The levels of IL-1β, TNF-α, IL-10, and TGF-β in supernatant were detected by ELISA
Effect of GDNF on PI3K/AKT signaling and BV2 MG morphological changes
Expression of the M1 microglial marker CD86 or CD16/32 and M2 marker CD206 was detected by flow cytometry, double IF staining, and qRT-PCR after the corresponding treatment for 24 h. The level and mean fluorescence intensity of CD86 or CD16/32 protein and CD206 protein were increased in the LPS/IL-4 group compared with that in the BV2 MG group. After treatment with GDNF, the level and mean fluorescence intensity of CD86 or CD16/32 protein decreased, whereas that of CD206 protein was increased. These actions of GDNF were abolished by the PI3K inhibitor LY294002. The expression of CD86 or CD16/32 protein in the LY294002+GDNF+LPS group was increased and that of CD206 was decreased (Figs. 8 –10), indicating that GDNF modulates the polarization of BV2 MG through the PI3K signaling pathway.
Effect of GDNF on PI3K/AKT signaling pathway and microglial differentiation. BV-2 cells were pretreated with GDNF or GDNF+LY294002 for 24 h followed by IL-4 (10 ng/mL) administration for 24 h. The protein expression levels of CD86 and CD206 were measured by flow cytometry
Effect of GDNF on PI3K/AKT signaling pathway and BV2 MG differentiation. BV2 MG were pretreated with GDNF or GDNF+LY294002 for 24 h followed by LPS (100 ng/mL) administration for 24 h. The protein expression levels of iNOS were visualized by IF. Red fluorescence indicated IBA-1-positive cells, green fluorescence indicated iNOS-positive cells, while blue fluorescence indicated DAPI-labeled nuclei. Color images are available online.
Effect of GDNF on PI3K/AKT signaling pathway and BV2 MG differentiation. BV2 MG were pretreated with GDNF or GDNF+LY294002 for 24 h followed by IL-4 (100 ng/mL) administration for 24 h. The protein expression levels of Arg-1 were visualized by IF. Red fluorescence indicated IBA-1-positive cells, green fluorescence indicated Arg-1-positive cells, while blue fluorescence indicated DAPI-labeled nuclei. Color images are available online.
Discussion
ADSCs, which have been sufficiently investigated both in biological experiments and clinical trials, have become a unique and prospective seed cell for cell transplantation therapies. Numerous studies have shown that ADSCs can be used to treat various neurological disorders such as cerebral stroke [19], Parkinson's disease [20], and neurologic tumors [21]. After transplantation, ADSCs migrate to the damaged site and differentiate into host cells or regulate the immune reaction. However, accumulating studies suggest that the functions of ADSCs are primarily related to secreted cytokines [15,16]. GDNF is a paracrine factor reported to have therapeutic functions in nerve regeneration [22,23]. In the present study, we confirmed that ADSCs modulate microglial polarization by producing GDNF, thus reducing the release of inflammatory factors while increasing the production of anti-inflammatory factors.
MG, as one type of brain-resident immune cells, play versatile roles under both inflammatory and physiological conditions. Under physiological conditions, they perform multiple functions in the healthy brain, such as forming neuronal circuits and regulating neuronal functions, as well as guiding learning-associated plasticity [24,25]. After pathogenic factor stimulation or homeostasis disruption in the CNS, MG are quickly activated, directly migrate to the damaged area, and then produce a series of inflammatory cytokines and cytotoxic factors [7]. In excess, these factors can destroy the blood–brain barrier, inhibit neurogenesis, and promote neuronal death [26,27], resulting in tissue damage and nerve cell death. All of these events cause secondary brain injury, which is closely related to the prognosis of neurological diseases [28,29]. Hence, reducing neuroinflammatory factors might have valuable therapeutic potential for neuroinflammation-related diseases. This study indicated that GDNF produced by ADSCs inhibits the MG activation-mediated release of inflammatory factors, which might be beneficial to prevent and inhibit neurological damage caused by inflammatory factors.
Furthermore, studies have shown that MG are plastic and can differentiate into two different phenotypes that perform diverse functions in response to exogenous stimulation. Similar to macrophages, MG can phenotypically polarize into the classical (proinflammatory; M1) and alternative (anti-inflammatory; M2) phenotypes [30,31]. It is well known that activated M1 MG release multiple inflammatory mediators such as TNF-α and IL-1β. The expression of these factors increases neurologic toxicity through different mechanisms such mitochondrial damage, peroxidation, differential regulation of different signaling pathways, and DNA damage, finally causing injury to CNS cells and tissues [32,33]. In contrast, the anti-inflammatory M2 phenotype can result in the production of cytokines, promote the migration of resting MG to the lesion area, clear pathogenic factors and cell debris, and confer neuroprotective effects by generating numerous protective and neurotrophic factors such as IL-10 and TGF-β, which are related to the inhibition of inflammation, homeostasis, and wound healing [11]. To date, microglial activation states must be appropriately balanced by suppressing the M1 phenotype and promoting the M2 phenotype to improve the prognosis of various inflammatory-related injuries. That is, simply suppressing neuroinflammation by inhibiting the M1 phenotype might not have primary benefits [34], and simultaneously promoting the M2 state while suppressing M1 activation is considered a more viable method to alleviate inflammation [35]. As GDNF, produced by ADSCs, alleviates neuroinflammatory injury, it is important to clarify the mechanism underlying the regulatory effects of GDNF on microglial differentiation. Previous studies have reported that LPS can stimulate stem cells to produce neurotrophic factors [36]. To avoid this effect, this study intentionally stimulated MG with IL-4, and then added ADSCs, GDNF, and siGDNF to ADSCs, which could better illustrate that ADSCs promote M2 differentiation through GDNF and better reflect the augmenting effect of GDNF on the M2 phenotype of MG instead of emphasizing its “shifting” role in MG differentiation. The present study demonstrated that GDNF significantly suppresses the microglial M1 state and promotes the microglial M2 phenotype, which might result in GDNF-mediated protective effects against inflammatory injury.
At the same time, we should also note that the simple M1/M2 dichotomy concept seems to be too simple, because MG in vivo are much more complicated than in the in vitro environment, and there might be more functional subtypes. Evidence confirms that there are other subgroups of M2, such as M2a, M2b, M2c, and Mox, each of which has its own physiological characteristics and different biological functions [37,38]. Moreover, the idea that M1-type cells will only aggravate damage without any positive effects seems less accurate. For example, M1 MG appear to aid in synaptic remodeling and might also facilitate the clearance of cellular debris early after acute brain injury. In addition, nerve repair proteins such as MMP-9 can also be released by M1 MG [39]. In contrast, the long-term existence of M2 MG might have adverse effects on immune defense disorders, which will have a negative impact on prognosis. Therefore, it is necessary to have the correct phenotype at the appropriate time to improve the natural repair process after CNS injury. Phenotypic transformation of MG and macrophages seems to be a promising means to promote regeneration of the CNS, but these methods are not sufficient for clinical use because of the polarization of MG/macrophages; moreover, regarding the further characterization of temporal and spatial changes, knowledge is still incomplete.
Further investigation of signaling pathways underlying GDNF-mediated microglial differentiation revealed the importance of the PI3K/AKT signaling pathway. This pathway, widely present in various cell types, was found to be not only involved in regulating cell growth, proliferation, and differentiation, but was also found to modulate macrophage/MG polarization. For example, the activation of PI3K/AKT was implicated in the modulation of MG/macrophage M1/M2 polarization to ameliorate ischemia–reperfusion-induced brain injury [40]. Moreover, PI3K/AKT plays a crucial role in attenuating white matter injury after subarachnoid hemorrhage in rats by modulating microglial polarization [41]. Thus, PI3K/AKT signaling contributes to neuroinflammation disease therapy. In addition, the common involvement of PI3K/AKT in regulating the M1/M2 subset polarization of MG/macrophages has also been studied in vascular dementia [42]. An analysis of the relationship between GDNF-mediated anti-inflammatory functions and PI3K/AKT activation showed that GDNF promotes the phosphorylation of PI3K and AKT in BV2 MG after LPS and IL-4 treatment. Next, we investigated whether GDNF-mediated microglial differentiation was related to PI3K/AKT activation using LY294002. Notably, this specific PI3K inhibitor partly abolished GDNF-mediated microglial polarization. The present study thus suggests that GDNF-mediated microglial differentiation is related to the activation of PI3K/AKT signaling.
In summary, this study demonstrated that ADSCs can produce GDNF in an inflammatory microenvironment. The administration of ADSCs or GDNF was found to modulate microglial polarization, inhibiting the M1 phenotype and promoting the M2 phenotype, by activating the PI3K/AKT signaling pathway. The present findings might support the potential therapeutic application of ADSCs and the pharmaceutical application of GDNF to neuroinflammation-associated neurological diseases.
Footnotes
Acknowledgments
We thank Dr. Xiaodan Jiang (Department of Neurosurgery Laboratory, Zhujiang Hospital, Southern Medical University) for advice and expert technical support. Sincere appreciation is also given to the teachers and our colleagues from Zhujiang Hospital of Southern Medical University, who participated in this study with great cooperation.
Author Disclosure Statement
No competing financial interests exist.
Funding Information
This work was supported by grants from the funds from the National Natural Science Foundation of China (81701200) to Dr. Run Zhang, and the National Natural Science Foundation of China (31300921) and Science and Technology Planning Project of Guangdong Province (S2013040016710) to Dr. Zhiqiang Fa.