
Abstract
Physiological osteochondral interface regeneration is a significant challenge. This study aims to investigate the effect of the coculture of chondrogenic rabbit bone marrow stromal cells (rBMSCs) with rabbit osteoblasts in a specially designed two-dimensional (2D)–three-dimensional (3D) co-interface culture to develop the intermediate osteochondral region in vitro. The 2D–3D coculture system was set up by first independently culturing chondrogenic rBMSCs on a scaffold and osteoblasts in cell culture plates, and subsequently placed in contact and cocultured. As control, samples not cocultured with osteoblasts were used. The regulatory effects exerted by osteoblasts on chondrogenic rBMSCs were quantified by real-time polymerase chain reaction. To study the effect of coculture on cells located in different parts of the scaffold, samples were separated into two parts and significantly different gene expression patterns were found between them. In comparison with the control group, a significant moderate downregulation of chondrogenic marker genes, such as Collagen II and Aggrecan was observed. However, the Sox-9 and Collagen I expression increased. More importantly, chondrogenic rBMSCs in the coculture system were shown to form the osteochondral interface layer by expressing calcified cartilage zone specific extracellular matrix marker Collagen X and the hypertrophic chondrocyte marker MMP-13, which were not observed in the control group. Specifically, only the chondrogenic rBMSC layer in contact with the osteoblasts expressed Collagen X and MMP-13, indicating the positive influence of the coculture upon interface formation. Biochemical analyses, histology results, and immunohistochemical staining further supported this observation. In conclusion, this study revealed that specific regulatory stimulations from osteoblasts in the 2D–3D interface coculture system could induce the formation of ostochondral interface for the purpose of osteochondral tissue engineering.
Introduction
The regeneration of an osteochondral plug with a biomimetic osteochondral interface has been a considerable challenge in clinical research. Tissue engineering approaches in this field have been focused on the development of isolated cartilage constructs without the mineralized layer and the regeneration of the interface was thought of as an implied by-product of noninterface engineered osteochondral plugs for a long time.6,7 The attention toward generating the interface before implantation has grown only recently. Though literature reports the use of various scaffolds, such as collagen microsphere-based- and chitosan-based scaffolds,8–11 different cells sources, stimulation factors and bioreactors,4,9,12–15 researchers still do not have an ideal method to regenerate the osteochondral interface.
Several strategies were utilized to provide a layered tissue engineering approach for osteochondral tissue generation, which include multilayered scaffold strategy, gradients of bioactive growth factor strategy, and coculture strategy.11,15,16 Currently, from among all the strategies in use, coculture is a likely effective method to solve this problem. Coculturing chondrocytes and osteoblasts has proven to have the potential to regulate the formation of hypertrophic chondrocytes and holds promise in osteochondral interface regeneration.4,16–18 However, harvesting chondrocytes causes secondary injury in patients. 14 In addition, the role of osteoblasts in the formation of the osteochondral interface is not adequately understood and characterized. Thus, it raises a need to set up a coculture strategy that involves a cell type that can be isolated without donor morbidity, and predictably differentiate into cells that can mimic the osteochondral interface. Allogeneic BMSC is one such cell source.14,19,20
In this study, a special two-dimensional (2D)–three-dimensional (3D) interface coculture model was designed. A silk fibroin sponge was used to provide the 3D culture environment for the rabbit bone marrow stromal cells (rBMSCs). Silk fibroin has been proven to be biocompatible for musculoskeletal applications by promoting cell attachment 21 and can provide an interconnected porous 3D structure and necessary mechanical support for osteochondral tissue regeneration.22–24 The 2D–3D interface coculture system that utilized rBMSCs from rabbit iliac crest and osteoblasts from tibia was set up. The regulatory effects of the osteoblasts on chondrogenic rBMSCs were evaluated by biochemical, structural, and histological tests. We have hypothesized that the regulation from interacting osteoblasts may induce chondrogenic rBMSCs to become hypertrophic chondrocytes and generate the osteochondral interface region.
Materials and Methods
All chemicals and assay kits were purchased from Sigma-Aldrich unless otherwise stated.
Scaffold preparation
Bombyx mori silk fibers were used in this study. Raw silk fibers were immersed in a degumming solution of 0.25% (w/v) Na2CO3 and 0.25% (w/v) sodium dodecyl sulfate between 98°C and 100°C. After 30 min, the solution was refreshed. This process was repeated until the sericin was removed. The degummed silk was rinsed with distilled water for 1 h to remove the residual degumming solution before leaving it to air dry. The degummed silk was then dissolved in a mixture of calcium chloride, ethanol, and water (CaCl2–CH3CH2OH–H2O; molar ratio=1:2:8) at 65°C with continuous stirring. The resulting silk solution was dialyzed against distilled water using a SnakeSkin Pleated Dialysis Tubing (PIERCE, MWCO 3500). The concentration (w/v) of the dialyzed solution was determined and adjusted to 3% w/v using distilled water. The silk solution was transferred into petri dishes and frozen at −20°C followed by freeze drying for 24 h. Freeze dried silk sponge scaffolds were fixed in 90% methanol for 10 min, and then rinsed with distilled water. The structure and porosity of the scaffolds were observed by scanning electron microscope (SEM) and μ-computed tomography (CT). All scaffolds were sterilized in 70% ethanol for 24 h, and then rinsed with sterile PBS thrice before use.
Cell culture and in vitro 2D–3D interface coculture model design
Rabbit bone marrow stromal cells (rBMSCs) and rabbit osteoblasts were obtained from New Zealand White Rabbits using a previously described protocol approved by the NUS Institutional Animal Care and Use Committee, National University of Singapore.25,26 Specifically, osteoblasts were extracted from tibia bone, which was aseptically harvested and washed thrice by sterile PBS with 50 μg/mL streptomycin and 100 U/mL penicillin. All adhering soft tissue was removed and the bone was cut into small pieces. Bone pieces were then soaked in 0.25% trypsin for 30 min in an incubator and then transferred into a new T-25 flask with high-glucose DMEM medium and 10% fetal bovine serum (FBS) for culture. The medium was changed twice a week. Bone pieces were removed after 1 week and cells that migrated from the bone pieces were continually cultured. Passage 3 rBMSCs and passage 4 osteoblasts were used in all tests in this study. 0.5 million rBMSCs were seeded with 50 μL 0.5% (w/v) RADA peptide (Sigma) solution on each silk scaffold, then cultured for a week in chondrogenic medium comprising high-glucose DMEM supplemented with 10−7M dexamethasone, 1% ITS+premix (BD), 50 mg/mL ascorbic acid, 1 mM sodium pyruvate, and 4 mM proline. Chondrogenic differentiation was induced in the presence of 10 ng/mL transforming growth factor β3 (TGF-β3; R&D Systems). At the same time, 10,000 osteoblasts were seeded on 24-well plates and cultured in high-glucose DMEM supplemented with 10% FBS. A group of osteoblast samples were prepared for soluble collagen assays. After 1 week of independent culture, the scaffolds with chondrogenic rBMSCs were transferred to the wells containing the osteoblasts and cocultured for 3 weeks in chondrogenic medium, with the culture medium being changed thrice a week. During this period, scaffolds with chondrogenic rBMSCs were kept in contact with the osteoblasts layers (Fig. 1). A group of scaffolds with chondrogenic rBMSCs separately cultured in chondrogenic medium without coculture with osteoblasts served as controls.
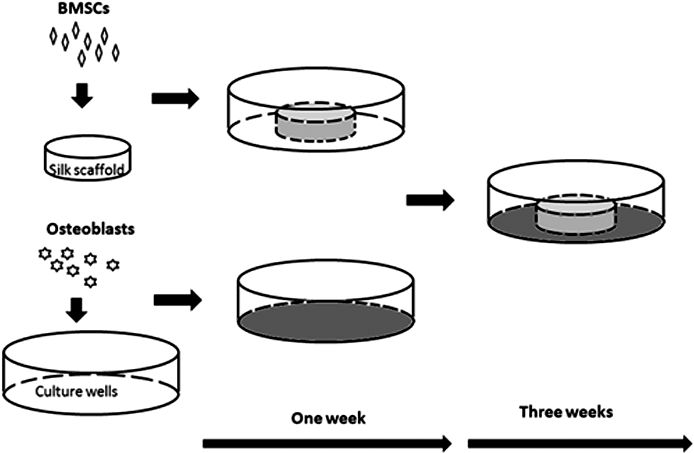
Osteochondral 2D–3D coculture system. 2D, two-dimensional; 3D, three-dimensional; BMSCs, bone marrow stromal cells.
Cell proliferation
The proliferation of rBMSCs was measured at the end of week 1, 2, 3, and 4 of culture using Alamar Blue dye reduction assay (Invitrogen). Briefly, rBMSC-seeded scaffolds (n=5) were incubated in DMEM medium supplemented with 5% FBS and 10% (v/v) Alamar Blue dye for 2 h. Absorbance values of 200 μL of the media were measured at 570 and 600 nm using a 96-well microplate reader (Sunrise remote; TECAN) and the percentage reduction in dye, which is proportional to the viability of cells in the sample, was estimated by following the vendor's protocol.
Cell proliferation was assessed by quantifying DNA content using PicoGreen assay (Quant-iT; Invitrogen) after 2 and 4 weeks of culture. Briefly, samples (n=3) were washed with PBS, freeze dried, treated with lysis buffer, and then homogenized. The supernatant obtained after centrifuging the homogenate was mixed with PicoGreen (Molecular Probes; Invitrogen) dye and fluorescence intensity was measured at 520 nm using a fluorescence microplate reader after excitation at 485 nm.
Total RNA extraction, cDNA synthesis, and real-time polymerase chain reaction analysis
Gene expression was measured for two study groups. In the first gene expression test, the effect of coculture was investigated. At the end of week 2 and week 4 of culture, cell-seeded scaffolds (n=3 for each group) were harvested for this test. In the second gene expression test, the location of osteochondral interface formation was identified and analyzed using only cocultured samples. Samples from the end of week 1 and week 4 were harvested and divided into two halves, the top half (TH) and the bottom half (BH), the BH being the part in contact with the osteoblast layer (Fig. 1). All samples for the gene expression study were rinsed in PBS. Total RNA was extracted using the RNeasy Mini Kit (Qiagen) following the supplier's protocol. The final eluted RNA was stored at −20°C and reverse transcribed to cDNA using iScript cDNA synthesis Kit (BioRad). Real-time reverse transcription–polymerase chain reaction (RT-PCR) was performed in a real-time RT-PCR machine (iQ5 Multicolor Real-time PCR Detection System) using the iQ Green RT-PCR Kit (Qiagen). Assays were run in triplicates for each sample. The primer sequences of selected genes for real-time PCR are summarized in Table 1.27–30 GAPDH was used as the housekeeping gene and relative expression levels for each gene of interest were determined. For the two layered test, the results of TH were further normalized by results of BH.
Biochemical test
Total soluble collagen assays
Collagen fibril deposition in the matrix is preceded by soluble collagen secretion from the cells. This is measured by the collagen assay used in this part of the study. The total soluble collagen synthesized and secreted into the culture medium was determined by Picrosirius Red-based colorimetric assay (SirCol® Assay; Biocolor Ltd.), following the vendor's protocol. After 2, 3, and 4 weeks of culture, the collagen concentration in the culture media were determined by measuring the absorbance at 540 nm and comparing with a standard curve (n=5). To calculate the collagen produced by the chondrogenic BMSCs in the coculture group, culture medium from samples that only had osteoblasts was used as reagent blank to calculate the collagen produced from osteoblasts.
Total soluble Glycosaminoglycans assays
The total soluble sulfated Glycosaminoglycans (GAG) synthesized and secreted into the culture medium was determined by Blyscan Assay for soluble sulfated GAG (Biocolor). The assay manufacturer's protocol was followed. The culture medium was harvested at the end of week 2, 3, and 4. The absorbance was measured at 656 nm, with 550 nm as the reference wavelength. The GAG content in the media was obtained by comparing with the standard calibration curve provided in the assay kit (n=5). To calculate the GAG produced by the chondrogenic BMSCs in the coculture group, culture medium from samples that only had osteoblasts was used as reagent blank to calculate the GAG produced from osteoblasts.
Calcium content analysis
To investigate the calcium content in the ECM, cocultured samples were cut into TH and BH to analyze calcium content. The test was conducted by using Sigma Calcium Kit solution (Sigma) following the supplier's protocol. Briefly, samples were harvested at the end of week 4 and washed in PBS twice. The samples were then soaked in 500 μL of 5% trichloroacetic acid at room temperature (RT) for 30 min and then centrifuged at 12,000 rpm for 5 min at RT. The supernatant was collected. 10 μL of the sample and standards were taken in 96-well plates and 100 μL of Sigma Calcium Kit solution was added; before proceeding to record spectrophotometric readings at 575 nm.
Morphological characterization
To visualize and observe the distribution of living cells, cell-seeded scaffolds at the end of week 4 were stained with fluorescein diacetate (FDA, Molecular Probes; Invitrogen Corporation). The scaffolds were incubated in 6 μg/mL FDA/PBS solution at room temperature for 3 min, rinsed with fresh PBS twice, and soaked in PBS, and the green-stained live cells were immediately visualized using an inverted fluorescence microscope (IX71 Inverted Research Microscope; Olympus).
Cellular morphology in the cell-seeded silk scaffolds was also characterized using SEM. Samples were harvested after 4 weeks of culture, formaldehyde fixed, freeze dried for 24 h, sputter coated with gold, and observed by SEM (Joel TSM-5000).
Histology and immunohistochemistry
Histological examination of cell seeded scaffolds after 4 weeks of culture was performed. Scaffolds were harvested and fixed with 3.7% formaldehyde, dehydrated, embedded in paraffin with 10 μm sections cut from each sample's bottom surface, and stained with hematoxylin and eosin (H&E) for histological observation. To investigate the mineralization of ECM, Alizarin Red staining and Von Kossa staining were used in this test. To investigate the GAG in ECM, Alcian blue staining was used.
To investigate ECM proteins-Collagen II and Collagen X produced by rBMSCs, immunohistology staining was used on cryomicrotome (LIECA CM3050S) with a labeled streptavidin-biotin immunoenzymatic antigen detection system (UltraVision Detection System Anti-Mouse, HRP/DAB; LabVision). Briefly, the sections were enzymatically digested with pepsin (1 mg/mL) for 30 min at RT, and then incubated with a mouse anti-pig monoclonal antibody (Sigma). After that the horseradish peroxidase (HRP) labeled secondary antibody was used. Finally, all sections were counterstained by hematoxylin and covered by coverslips using permanent mounting medium.
Statistical analysis
All data were expressed as mean±standard deviation. Single factor analysis of variance was used to compare the study groups using SPSS 13.0 software. p<0.05 was accepted as statistically significant.
Result
Scaffold characterization
The scaffold used in this study was of a disc form with 5 mm diameter and 3 mm thickness. Scaffolds were found to have interconnected sponge structures with uniform pores of 150±20 μm diameter (from analysis of SEM, Fig. 2 B, C). By using μ-CT observation, it was found that the whole scaffold structure was interconnected (Fig. 2E).
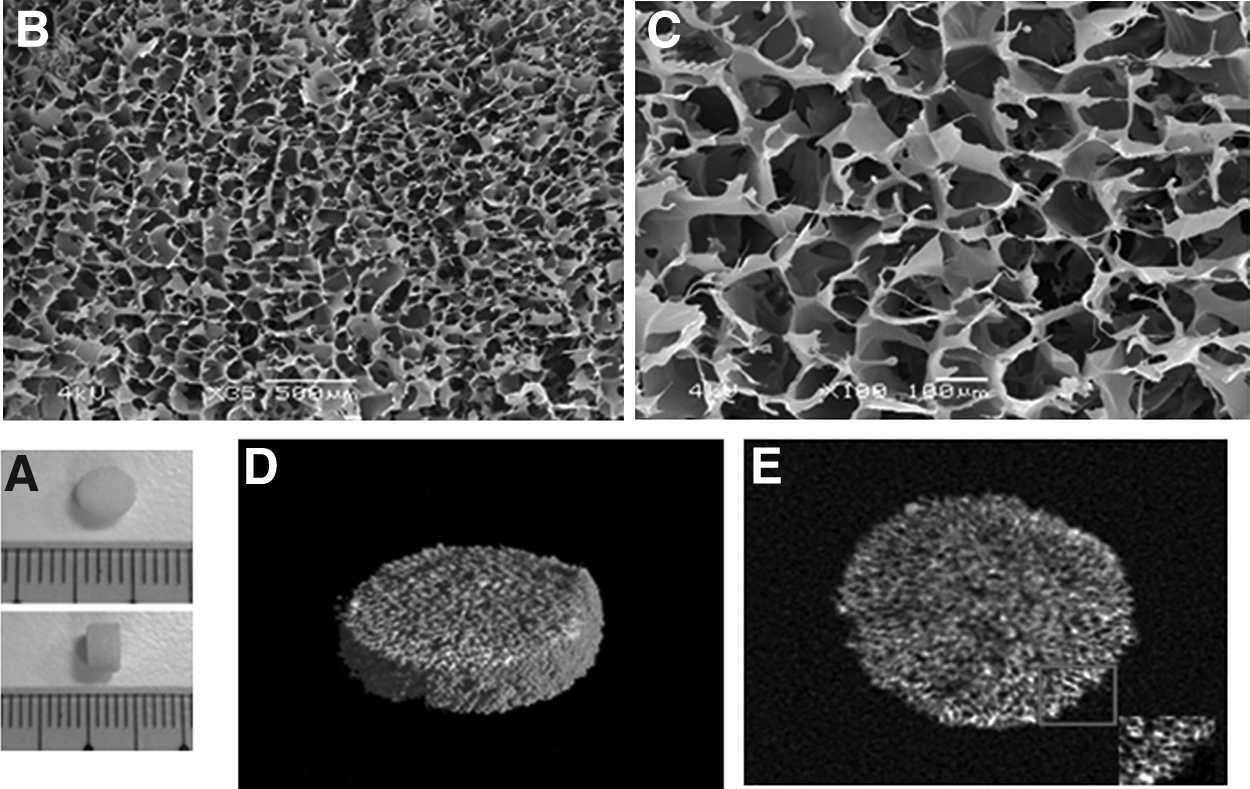
Scaffold morphology
BMSC proliferation on scaffolds and cell morphology
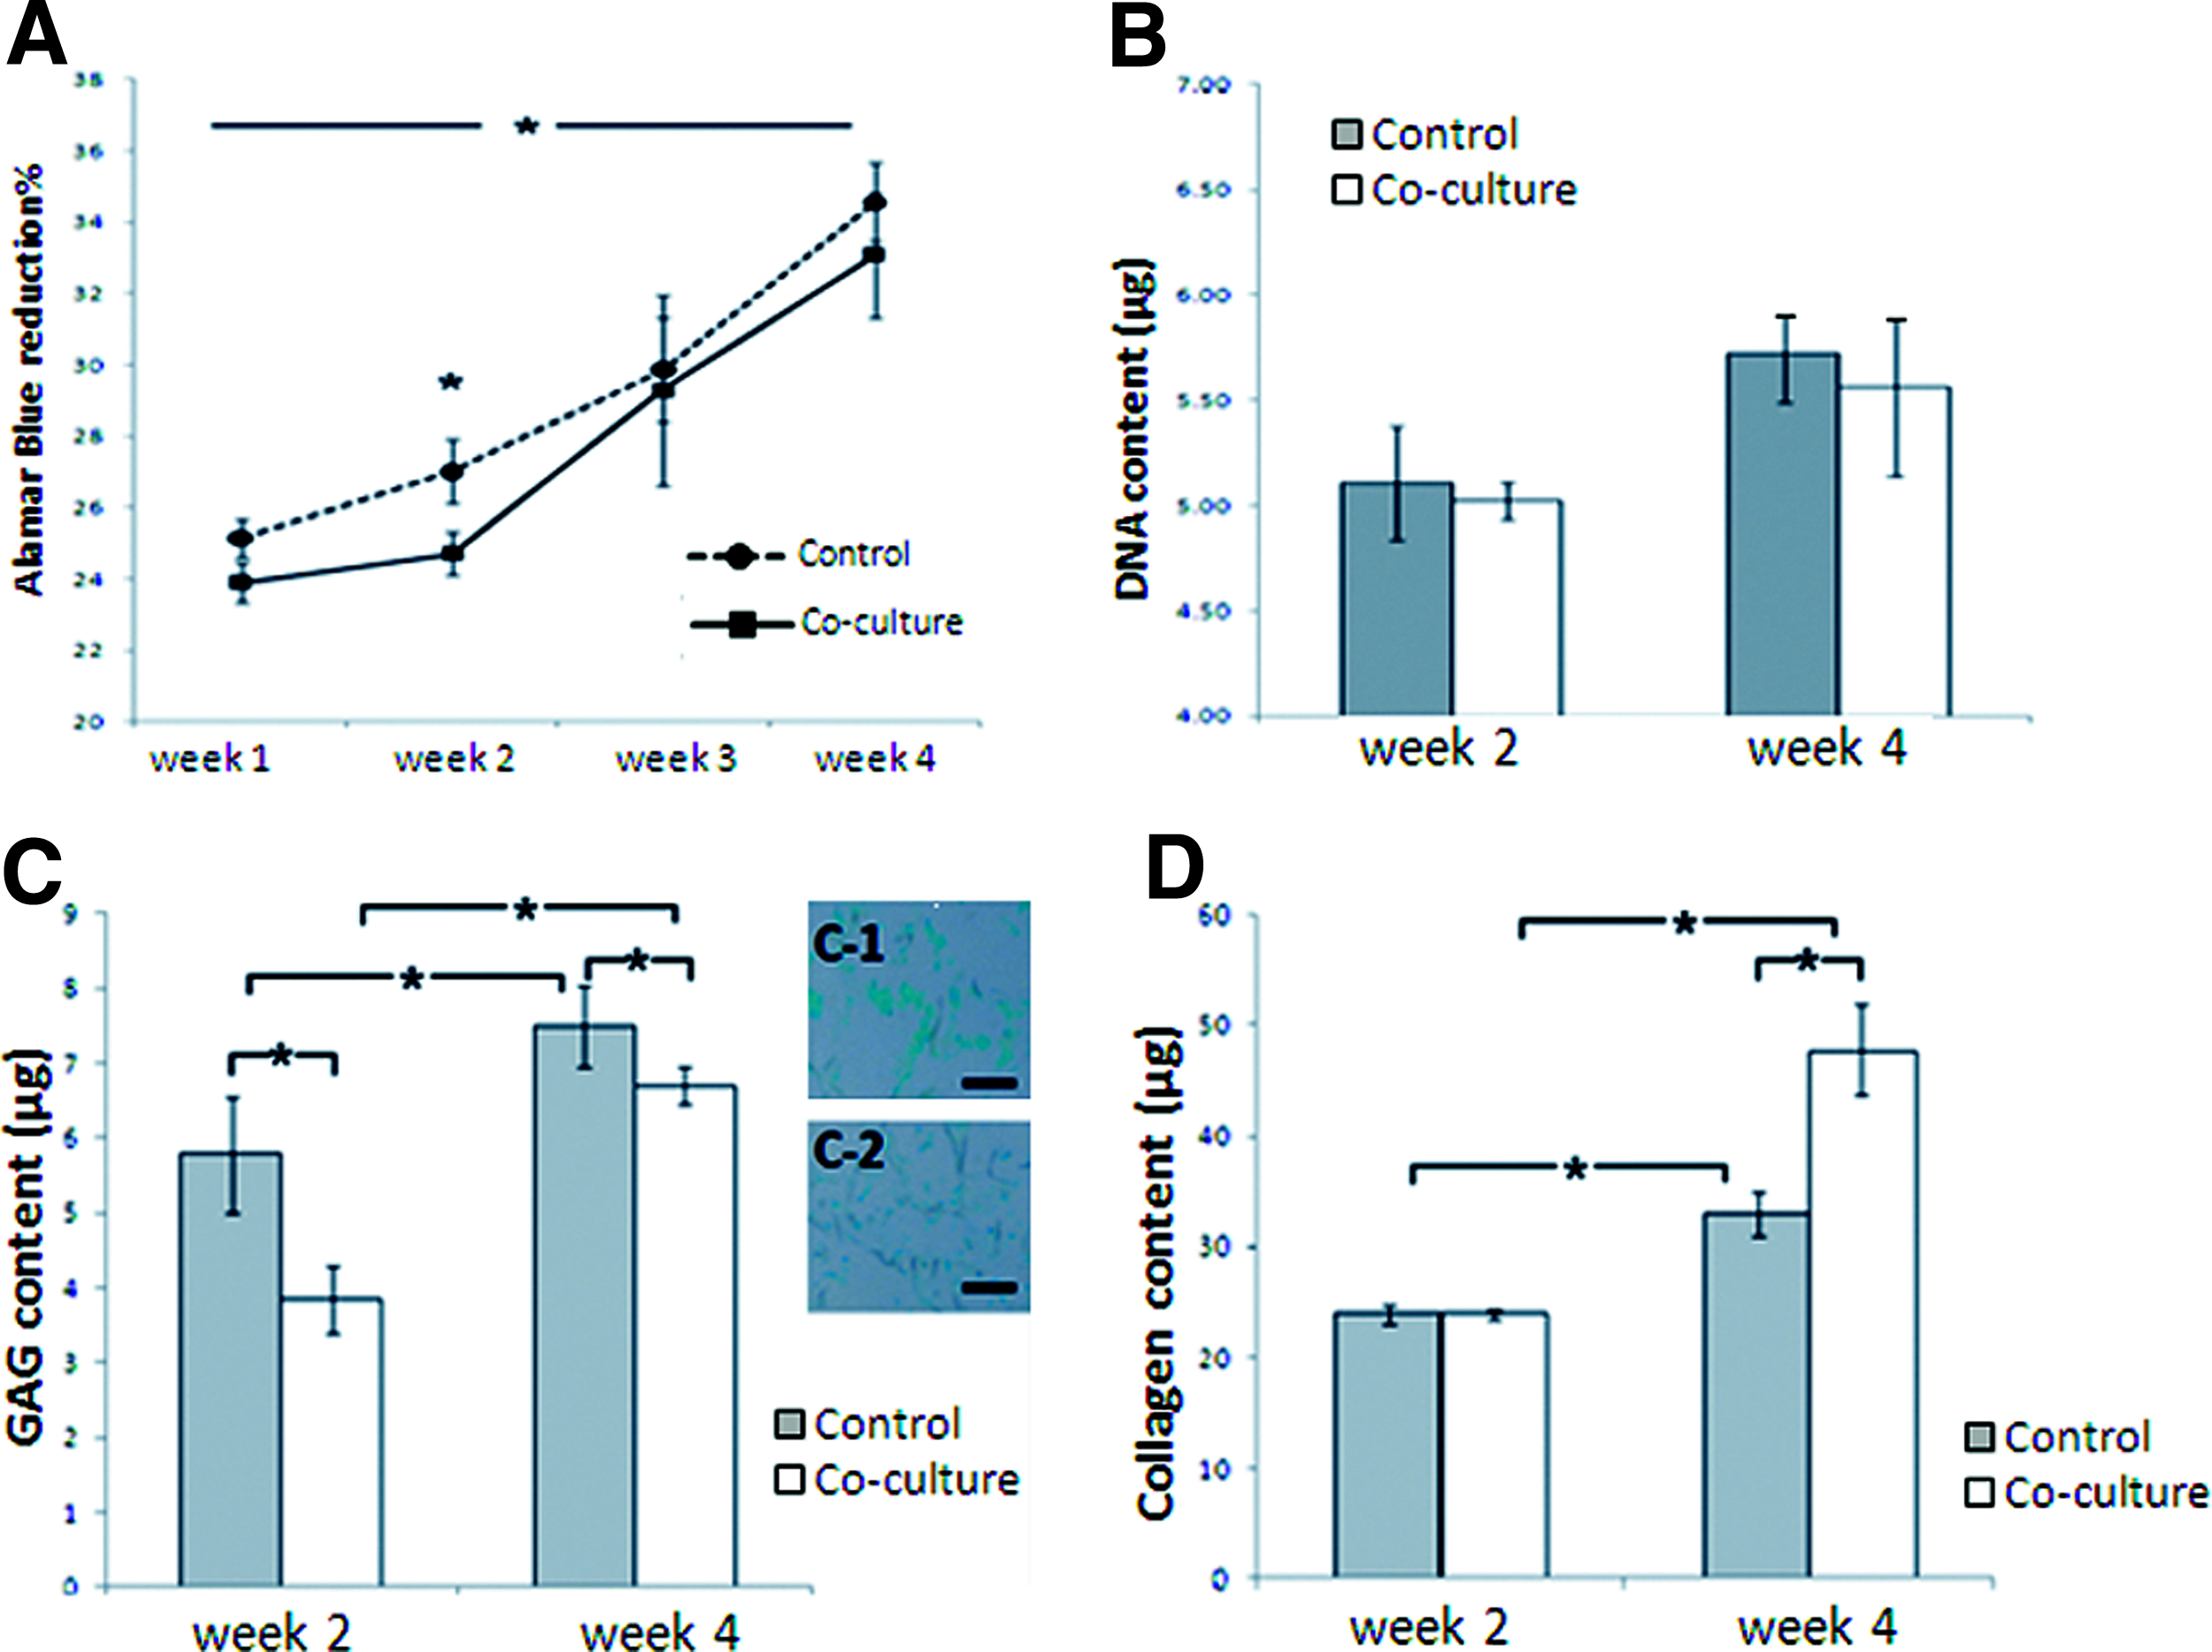
Both coculture group and control groups showed similar cell adhesion. SEM, H&E staining, and FDA staining showed that the rBMSCs distributed well throughout the scaffolds (Fig. 3). Cells displayed a spherical chondrocytes-like morphology (Fig. 3 A, E, F). Alamar Blue reduction results showed that during the 4 weeks of culture, both control and coculture groups proliferated significantly. There was no significant difference in cell proliferation between groups except at week 2. PicoGreen assay showed that by coculture, the cell DNA content increased over the culture period, but there were no significant differences between the two groups as measured on week 2 and week 4 (Fig. 4B).
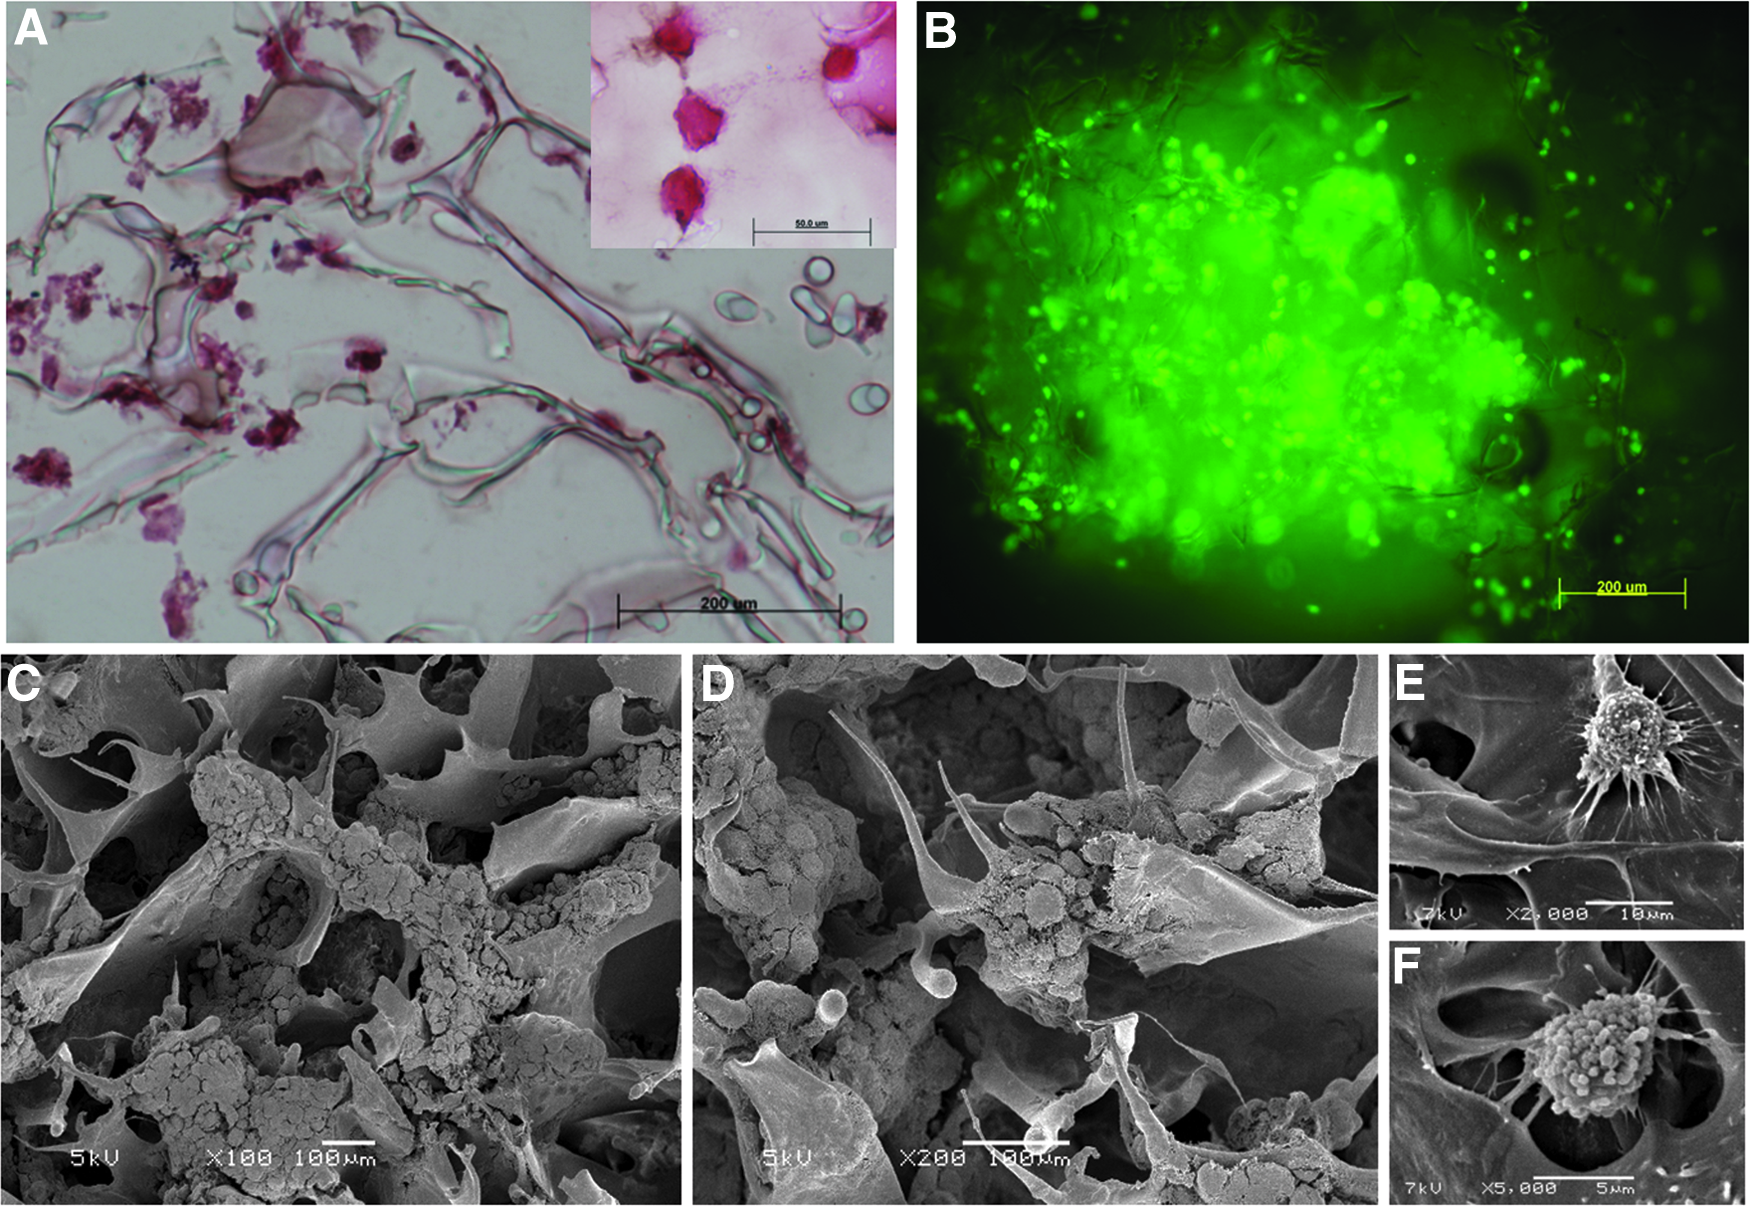
Cell morphology on scaffold
Effects of coculture on collagen and GAG production
The results of collagen and GAG produced by chondrogenic rBMSCs from coculture samples were calculated by subtracting the values of collagen and GAG from simple 2D osteoblasts culture. According to the results of the assays, an increase in production of collagen and GAG between week 2 and week 4 was observed for both coculture and control groups. However, for the cocultured samples, the collagen secretion significantly increased, and the GAG production was lower as compared with the control sample at the week 4 time point. Sircol assays showed that both the control group and the coculture group produced significantly more collagen from week 2 to week 4 (Fig. 4D). The results also showed that, though both groups produced similar amounts of soluble collagen after 1 week of coculture (week 2), significant increase in collagen secretion can be found at week 4 by coculture with osteoblasts for 3 weeks. Similarly, GAG production in both groups significantly increased with time, but was lowered by co-culturing with osteoblasts.
q-PCR analysis for gene expression
The effect of coculture on transcription of both chondrogenic and hypertrophic chondrogenic markers was examined in this study. In the first gene test, when the chondrogenic rBMSCs on the scaffold were cocultured with the osteoblast layer on the culture well, the expression of Aggrecan and Type II Collagen was significantly decreased by week 4 compared with control (p<0.05, Fig. 5). In contrast, Type I Collagen gene expression was significantly upregulated by coculture. Sox-9 expression was slightly upregulated by coculture; however, the difference was not significant. In this study, MMP-13 expression was found only in the coculture group. Similarly, Type X Collagen was found only at week 4 in the coculture group alone.
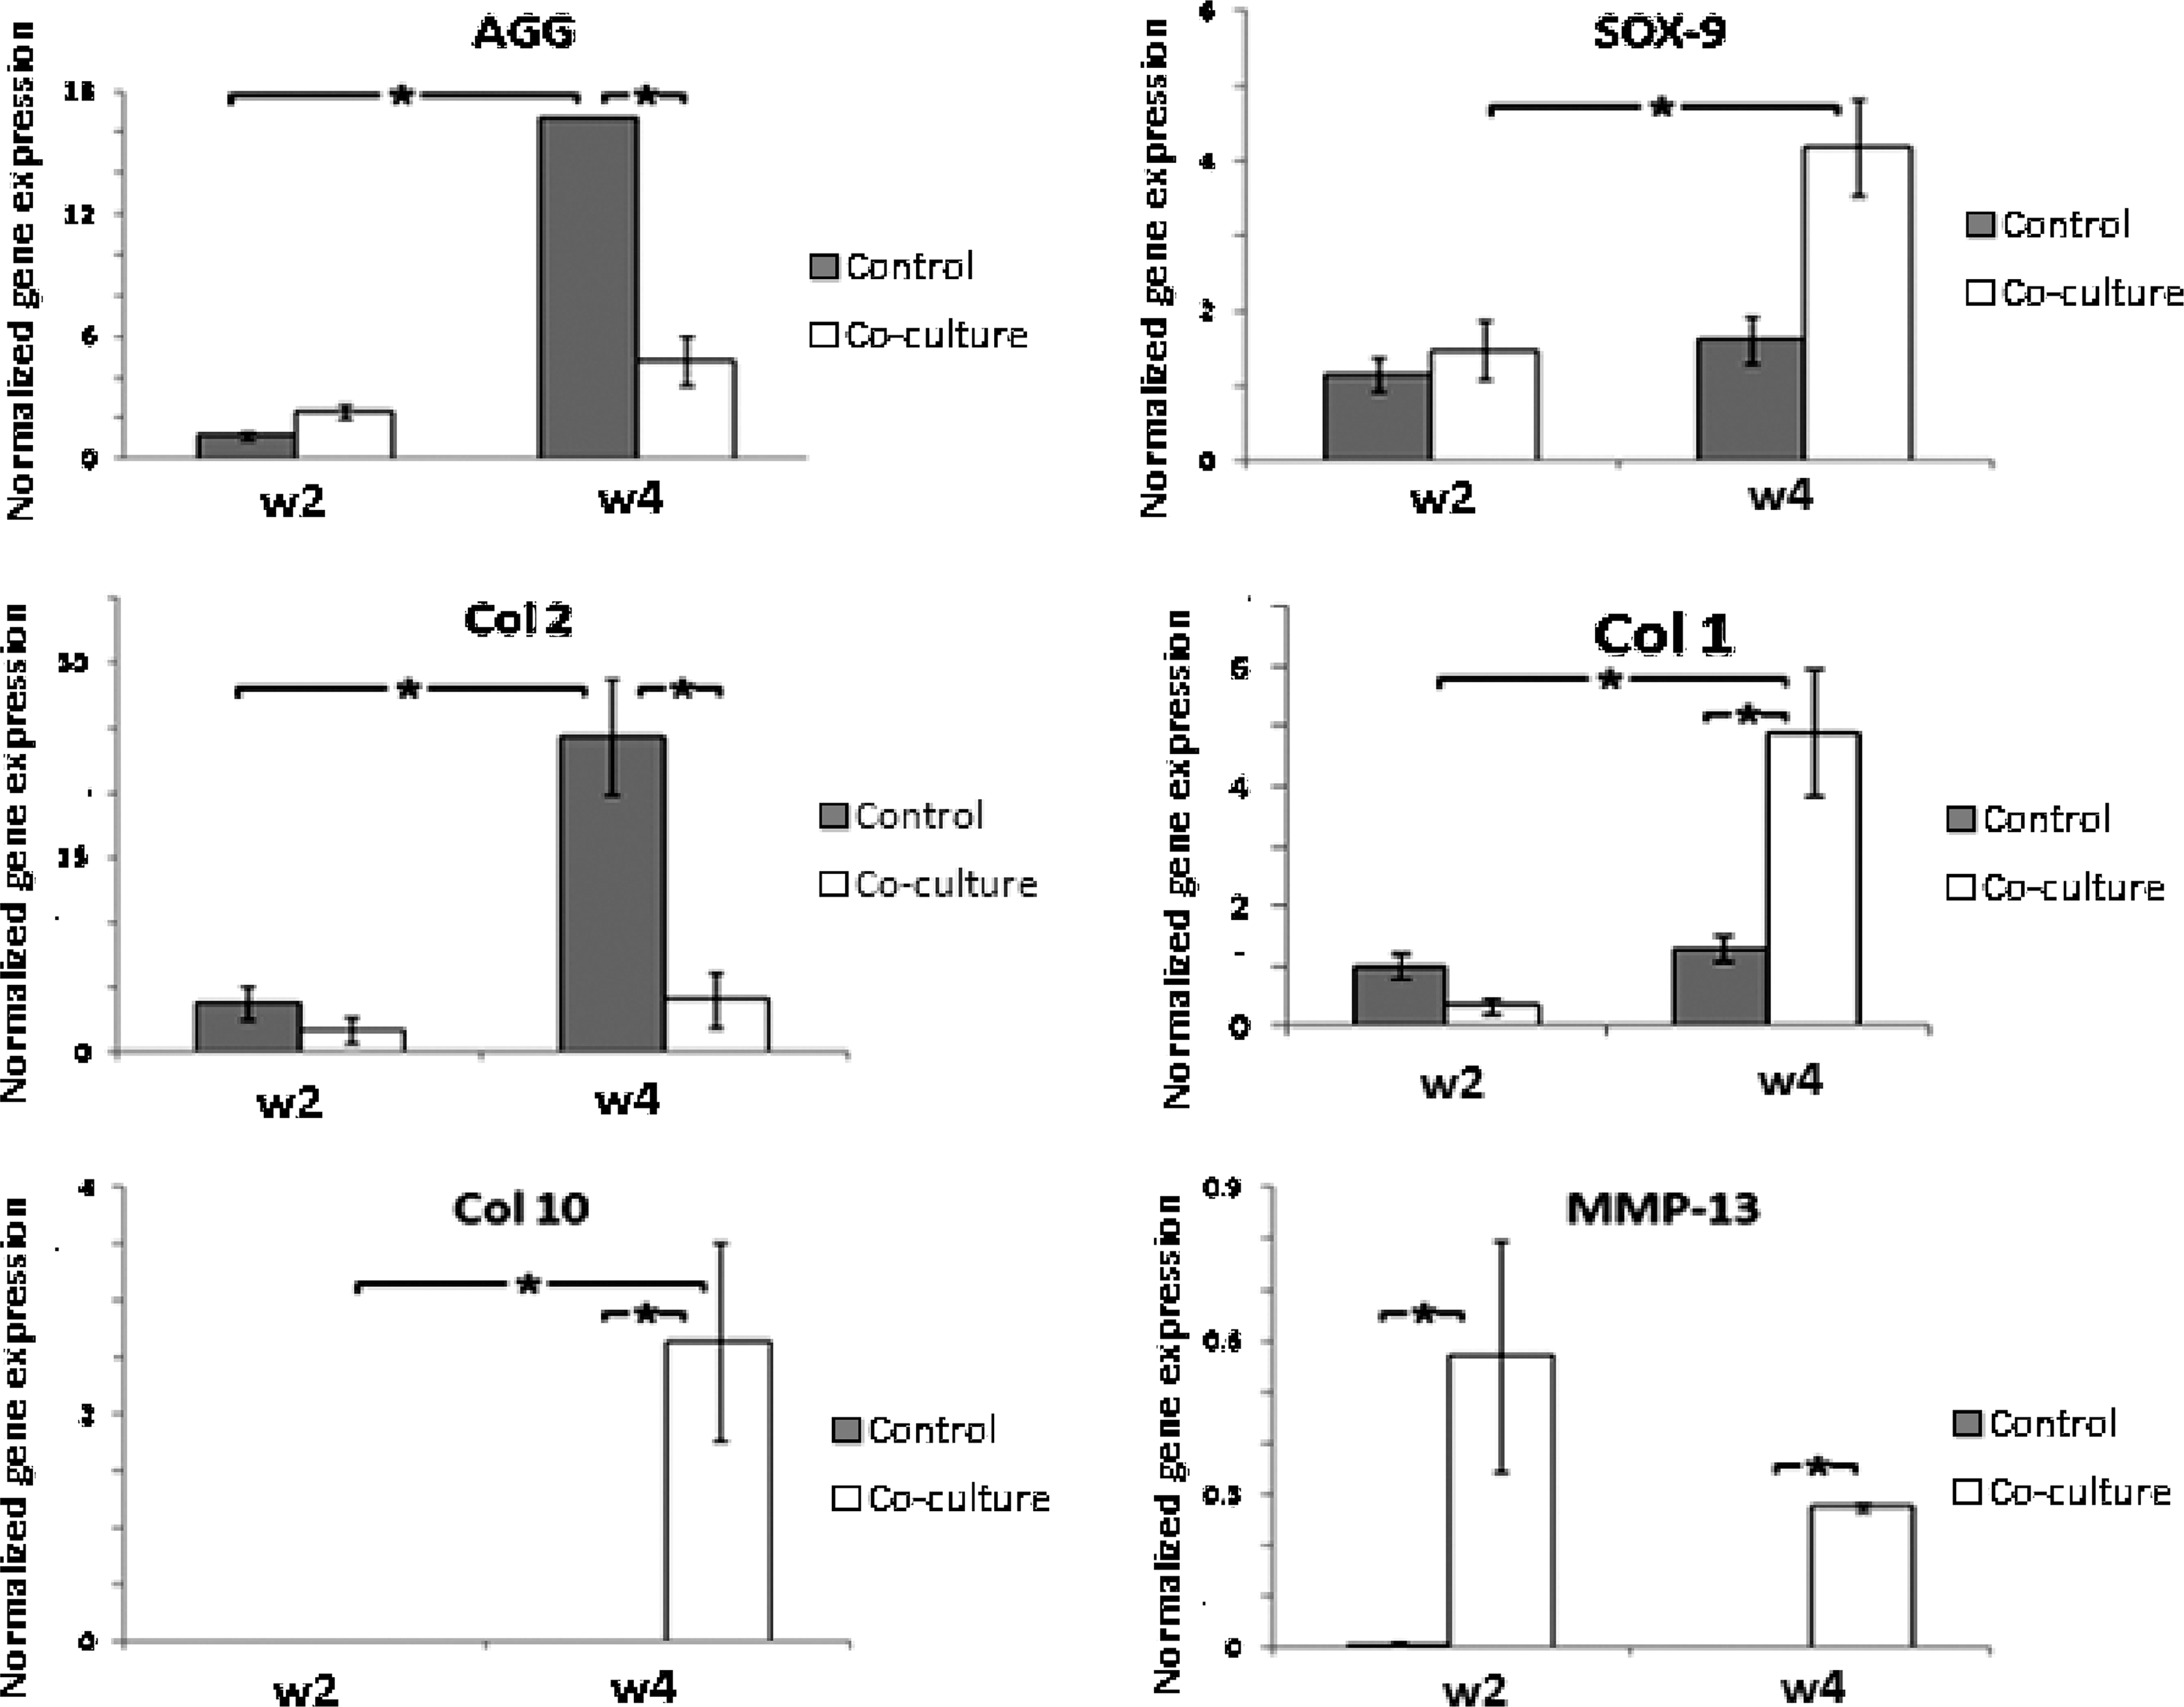
Gene expression Study One: coculture group compared with control group in week 2 and week 4. All gene expression was normalized by comparison with housekeeping gene GAPDH. (*p<0.05)
To investigate the extent of the effect of osteoblasts on chondrogenic rBMSCs, the cocultured samples were separated into two halves: TH, in contact with chondrogenic medium and BH, proximal to the osteoblasts layer via direct contact. The same gene markers as the first test were used in this test. During the first week of chondrogenic stimulation, chondrogenic gene markers: Aggrecan, Type II Collagen, and Sox-9 were all expressed and there were no obvious differences between TH and BH (Fig. 6). Similarly, Type I Collagen expression was similar between these two parts at the end of week 1. Moreover, no Type X Collagen or MMP-13 was expressed after 1 week of chondrogenic culture without coculture. However, after longer period of osteoblast coculture, the gene expression of the two halves became different. The expression of Aggrecan and Type II Collagen on BH was significantly lower than TH and the expression of Type I Collagen and MMP-13 in the BH was higher than the TH. Further, Type X Collagen was expressed only in BH.
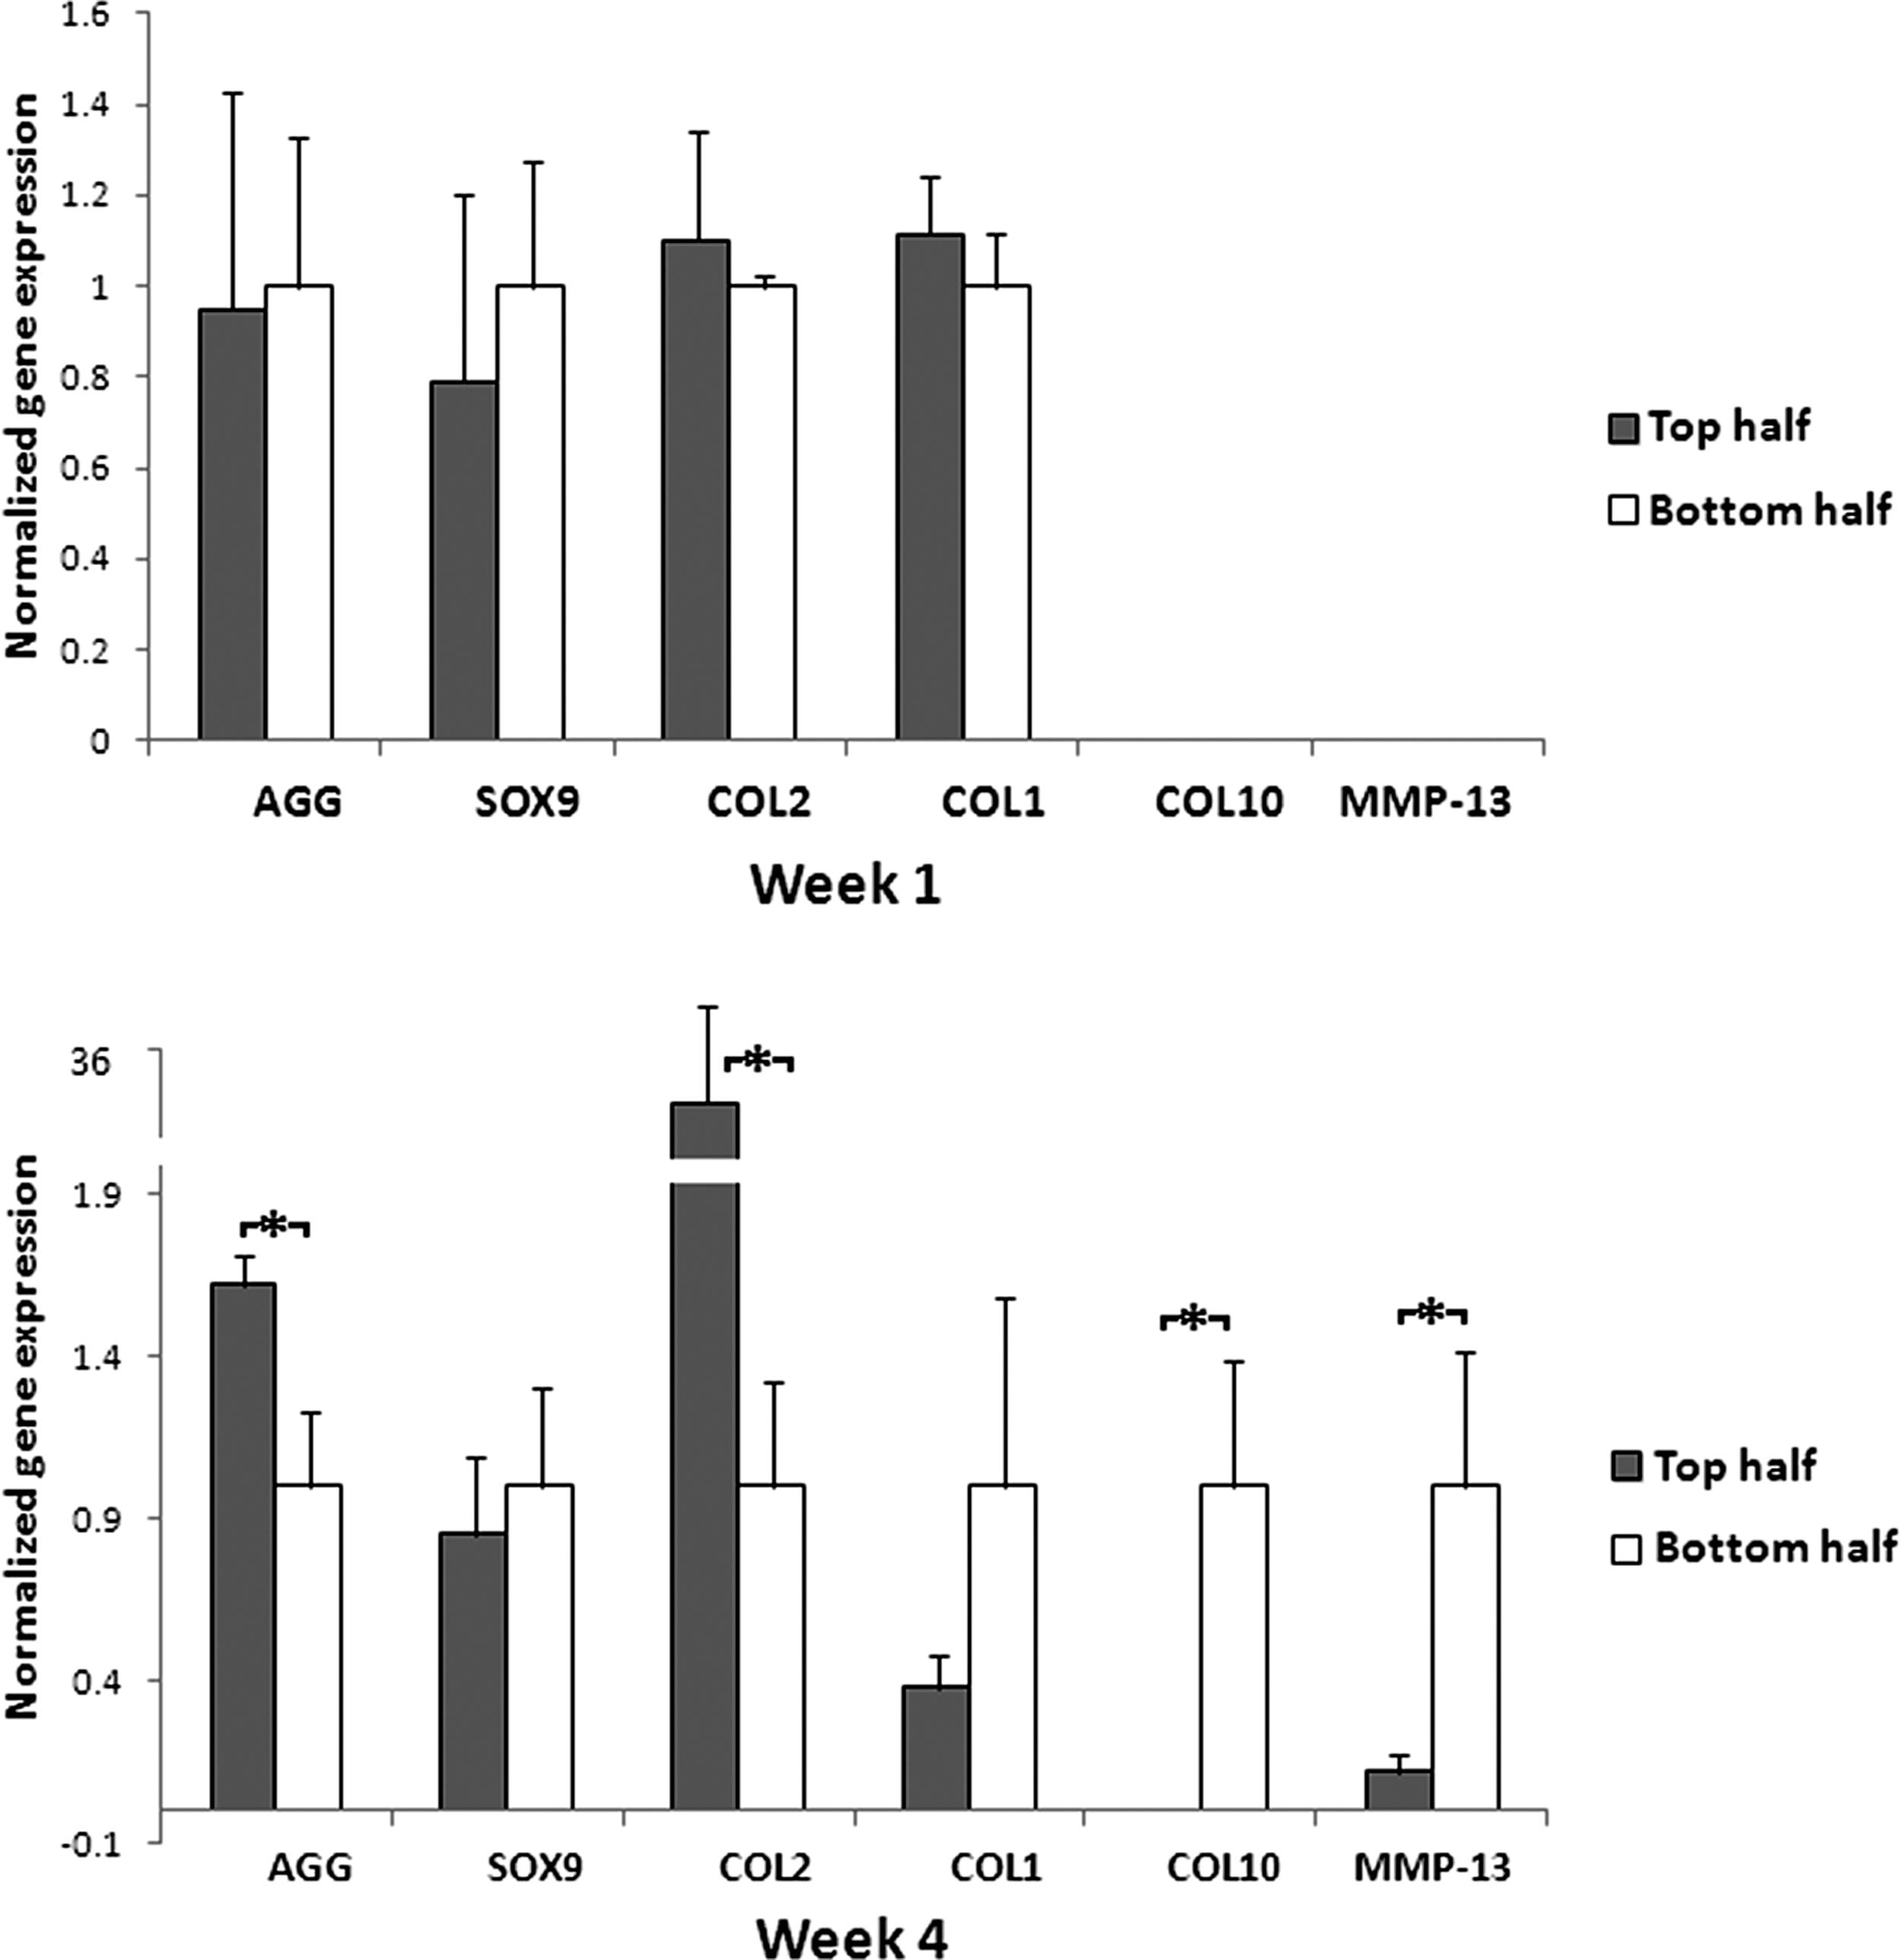
Gene expression Study Two: Comparisons of gene expression between BH and TH at week 2 and 4. All gene expressions normalized by comparison with housekeeping gene GAPDH. (*p<0.05). BH, bottom half; TH, top half.
2D–3D interface coculture effect on GAG, mineralization, and collagen deposition in ECM
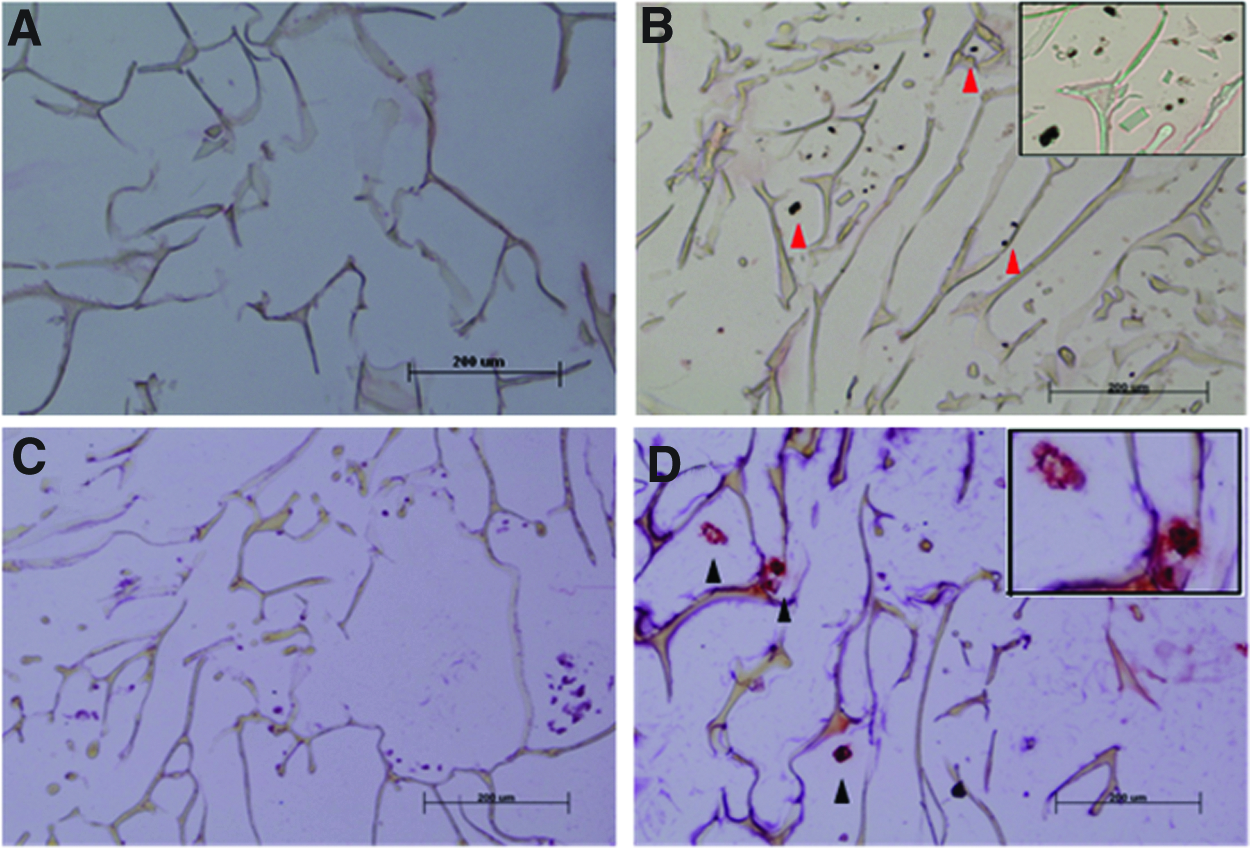
As shown in Figure 4C1–2, deposition of the matrix was visualized by Alcian blue staining. Horizontal cross-sections of control group and coculture group were examined. The results showed that GAG staining was visibly downregulated in the coculture group compared with the control. These results were consistent with the quantitative GAG results (Fig. 4C). For mineralization deposition tests, Alizarin Red and Von Kossa staining were used. As seen in Figure 7, minimal calcium deposits could be stained on the bottom region that was directly in contact with the osteoblast layer from the coculture group (Fig. 7B, D). There were no mineralized deposits in the control after 4 weeks.
To evaluate the specific chondrogenic or hypertrophic chondrogenic ECM protein zones within the scaffold, immunohistochemistry techniques were used to analyze Type II Collagen and Type X Collagen. In comparison with the control group, the coculture group samples contained lower concentrations of Type II Collagen. However, Type X Collagen could only have been positively stained in the coculture group (Fig. 8). Specially, Type X Collagen distribution was restricted in the bottom surface of cocultured samples (Fig. 8G). This result was consistent with the gene expression study.
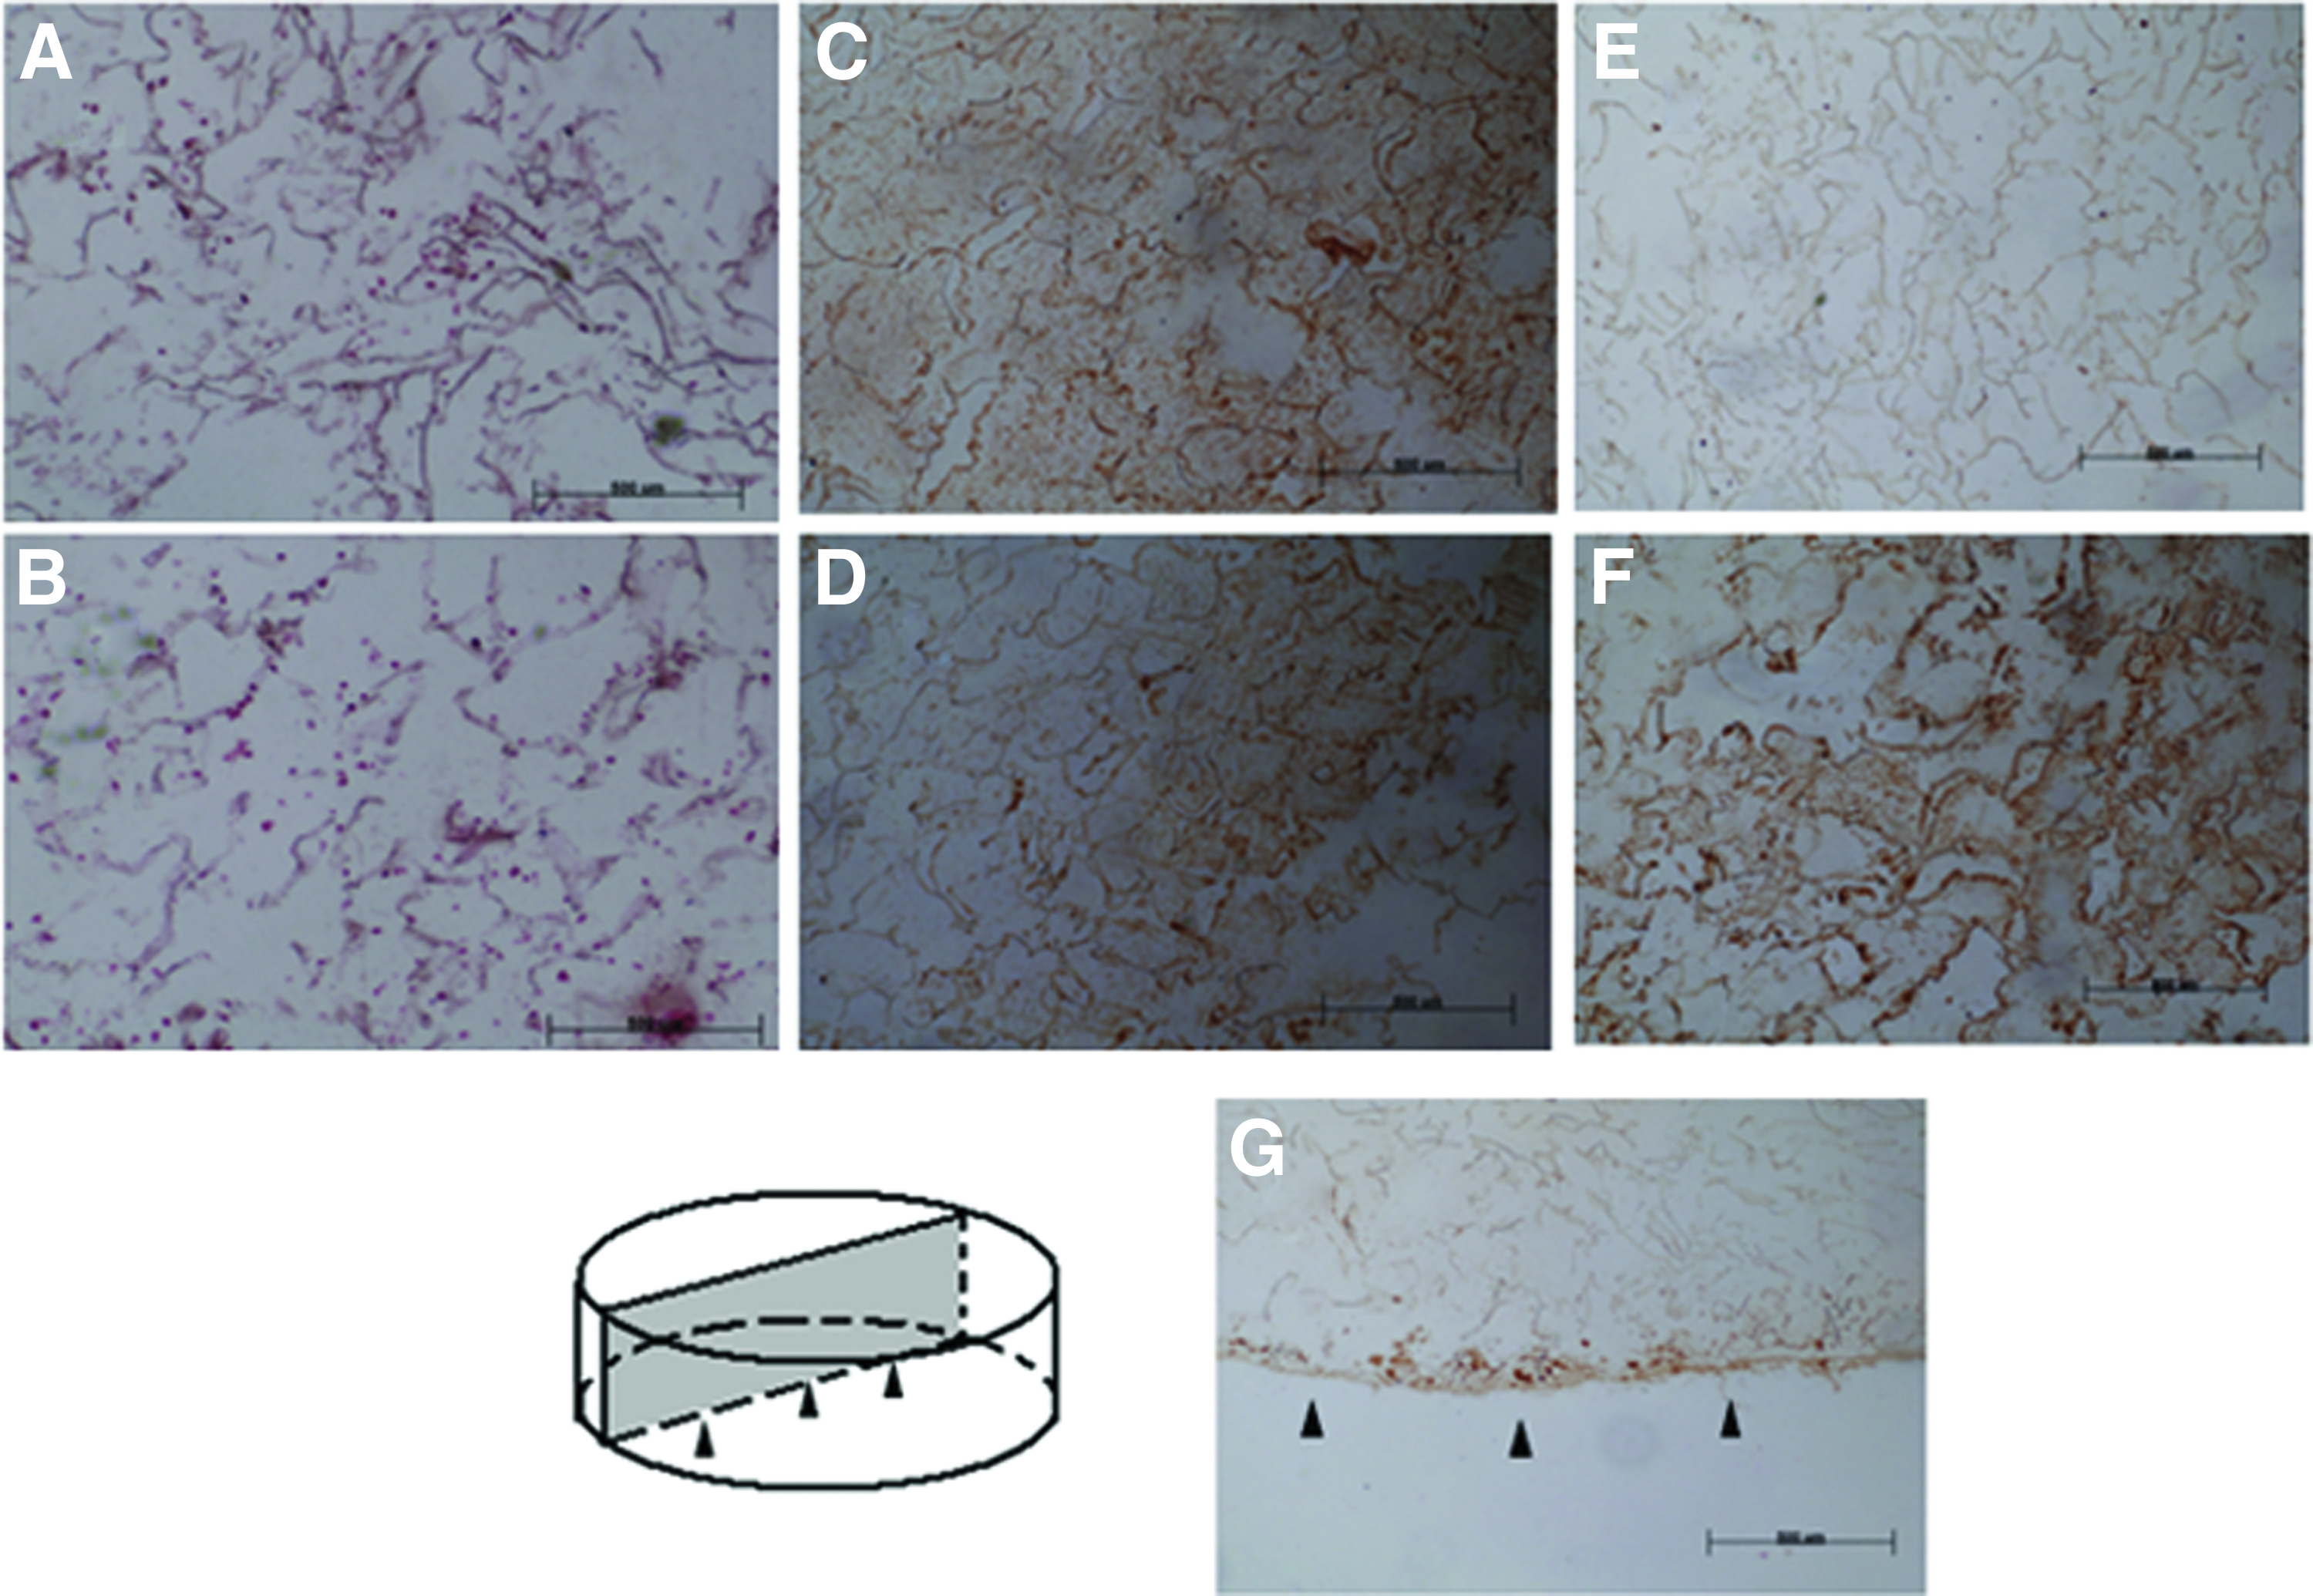
Immunostaining for Type II Collagen and Type X Collagen
Calcium content
To quantitatively analyze the effect of coculture on calcium deposition, BH and TH parts of the cocultured samples were analyzed, with results shown in Figure 9; BH part had significantly higher calcium content (p<0.05), which was consistent with the Alizarin Red and Von Kossa staining results. For control group, no calcium was found.
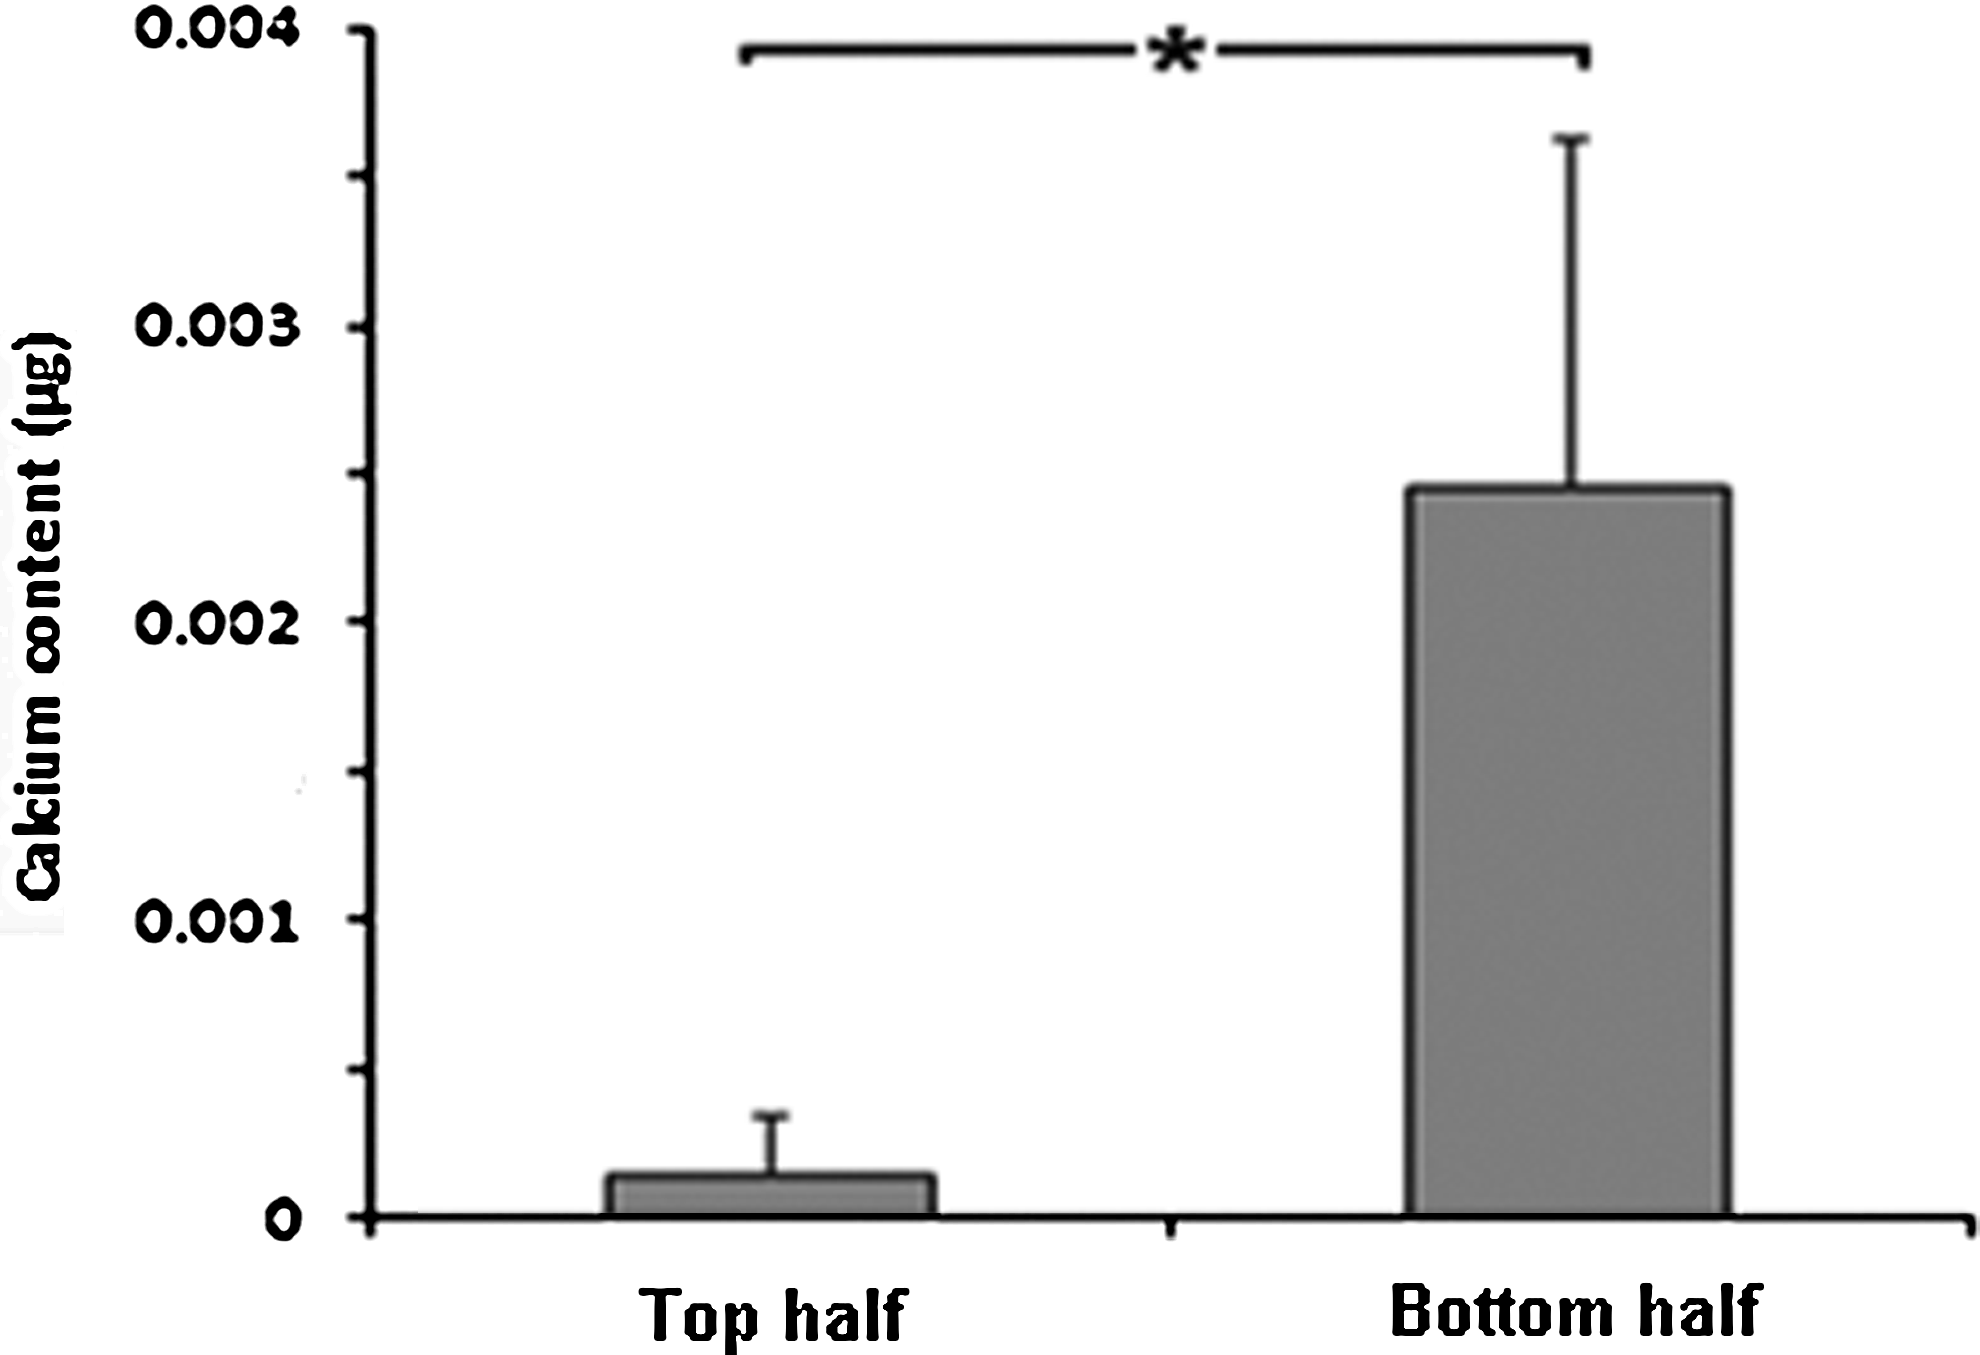
Calcium content analysis for TH and BH for coculture group. (*p<0.05).
Discussion
The objective of this study was to develop a physiological 2D–3D interface coculture system for osteochondral interface regeneration by using rabbit chondrogenic rBMSCs and osteoblasts. The 2D–3D interface model described here allows the interaction between a zone of chondrogenic rBMSCs on a scaffold to be in direct contact with an osteoblast layer for cell to cell interaction. The matrix production and the expression of specific markers showed that the chondrogenic rBMSCs in the 3D scaffold that were in the proximity of the osteoblasts showed a tendency to form the osteochondral interface. During the coculture period, only one surface of the 3D scaffold and a fraction of the chondrogenic rBMSCs are in contact with the osteoblast layer. To find out whether the osteoblasts migrated to scaffolds, scaffolds without rBMSCs were cultured with osteoblasts for the same time period. The scaffolds were harvested and stained by FDA. The results (results not shown here) showed that there were no cells on scaffolds, which elaborate that osteoblasts did not physically infiltrate the scaffold region, but provided biochemical signaling effects to the chondrogenic rBMSCs in proximity. Moreover, this model also provided a possibility to investigate the difference between contact dependent and contact independent effects of interaction between chondrogenic rBMSCs and osteoblasts.
In comparison with human BMSCs, rabbit BMSCs have been shown to have faster decreasing chondrogenic differentiation potential with culture. Thus, in our study, early passage (P3) rBMSCs were used in the entire study. 31 From the results, it was found that the cell proliferation was maintained throughout the whole culture period, both in control group and coculture group. GAG has been reported as one of the most important matrix components of cartilage. 32 In this study, we found that even though lower GAG was produced by osteoblast coculture, via both quantitative and qualitative means, the difference of GAG production between groups became smaller with time. On the other hand, the collagen production increased through coculture by week 4. This might be because the beneficial effects of stimulation factors from the osteoblasts improved collagen synthesis. In this 2D–3D interface coculture model, chondrogenic rBMSCs cocultured with osteoblasts resulted in downregulation of the chondrogenic markers and the appearance of the hypertrophic chondrogenic markers. Comparing the control and coculture groups, cartilage related Type II Collagen and Aggrecan genes were downregulated significantly. In contrast, the expression of Type I Collagen increased via coculture. The osteochondral interface has collagen-rich ECM, which mainly includes Type I, II, and X Collagens.7,33 Thus beside Collagen II, the production of Collagen I contributed to regenerate the complicated osteochondral interface ECM. Several growth factors such as insulin-like growth factor 1, TGFβ3 and bone morphogenetic protein-2 can improve the expression of Sox-9. 34 In our study, the moderate upregulation of Sox-9 might be caused by the stimulation factors produced by osteoblasts. From Dasuki's report, the continued expression of Sox9 is necessary for chondrocyte hypertrophy in the early stage of differentiation. 35 Type X Collagen and MMP-13 are well-known molecular markers for chondrocyte hypertrophy.36,37 By coculture, Type X Collagen was expressed at week 4 and MMP-2 was expressed earlier on as well. This showed that this coculture model truly has the potential to induce hypertrophic chondrogenic rBMSCs differentiation.
On the basis of the second set of gene expression studies conducted, we tried to determine the spatial effect of osteoblasts on the chondrogenic rBMSCs. From the gene expression results for the top and bottom halves of the cocultured scaffold, only the lower half showed Collagen X and MMP-13 expression, coupled with increased Collagen I expression. The downregulation of chondrogenic markers Aggrecan and Collagen II was also more prominent in the BH; thus, we can state that osteoblasts tend to affect chondrogenic rBMSCs that are in direct contact or in close proximity to them. Finally, results from the matrix protein staining, mineralization staining, and calcium quantities results all confirmed the findings of the gene expression study. After coculturing with osteoblasts, the Type II Collagen in matrix significantly decreased as compared with the control group. On the other hand, Type X Collagen could only be stained in cocultured samples. To investigate the distribution of Collagen X in ECM, cocultured samples were vertically cross cut and it was found that Collagen X was located in the very bottommost layer of the scaffold. Mineralization was thought to be a marker for the formation of the osteochondral interface.2,5,38 In our study, some calcium depositions were indicated in the bottom part of the cocultured samples. It seemed that in the bottom surface of these cocultured samples, there was a thin layer of mineralized ECM formed.
The above results show that our 2D–3D interface cocultures system might have the ability to induce the chondrogenic rBMSCs to become hypertrophic chondrocytes, and that this kind of effect was not uniform throughout all the cells in the scaffold. Only the bottom surface that was in direct contact with the osteoblasts had the tendency to form the osteochondral interface. In this study, the whole culture period was 4 weeks. Though this may be the case, this study showed that the differentiation of chondrogenic hypertrophy had been initiated and the formation of osteochondral interface might be more obvious with longer periods of coculture. In this study, chondrogenic rBMSCs have been shown to have the potential to generate the osteochondral interface via the direct contact model. However, the underlying mechanism remained unclear. The key factors of stimulation should be further investigated in future studies. To better understand the mechanism, different coculture models, such as direct-contacted model or the indirect model that only allows medium to be exchanged between different types of cells 39 might be considered. Moreover, only the effects of osteoblasts on chondrogenic rBMSCs have been investigated in this study. However, the effects of chondrogenic rBMSCs on osteoblasts are also interesting and should be investigated in the future.
Conclusion
This study demonstrated a 2D–3D interface coculture system for osteochondral interface generation. Results revealed that specific spatially controlled regulation from osteoblasts in the 2D–3D coculture system could help to introduce hypertrophic differentiation of chondrogenic rBMSCs on the scaffold and improve the calcified cartilage-like ECM formation in the scaffold. We have thus shown that this coculture method has the potential to induce the formation of the osteochondral interface in vitro.
Footnotes
Disclosure Statement
No competing financial interests exist.