
Abstract
In this study, human mesenchymal stem cells (hMSCs) were cultured on the hydroxyapatite (HA) and mineralized collagen (MC), and their proliferation, adhesion, and differentiation, especially the molecular mechanisms on gene level, were investigated. Proliferation and morphological responses of hMSCs and their osteogenic differentiation were detected by quantitative detection of alkaline phosphatase. Gene expression profilings were examined by microarrays, and the gene expression data were studied through gene ontology terms and pathway analyses. The results showed that MC promoted cell proliferation and osteogenic differentiation of hMSCs. Microarray analysis showed that MC was conducive to express osteogenesis-related genes, such as BMP-2, COL1A1, and CTSK, and stimulate osteogenic differentiation, such as osteoblast differentiation pathway and skeletal system development pathway.
Introduction
R
In the field of bone defect repair, calcium phosphate (CaP) biomaterials have been widely used as bone void filler. 11 Moreover, hydroxyapatite (HA) has been demonstrated to have osteoinductivity.12,13 However, CaP biomaterials only mimic the inorganic component of the bone tissue, without any organic components and specific microstructures of the bone. Biomimetic mineralized collagen (MC) is a composite material possessing the same chemical compositions and microstructures to the natural bone tissue. In the preparation of the MC, the in vitro biomimetic mineralization process mimics the natural bone formation and was used to prepare biomimetic MC.14,15 As the organic component of the MC, type-I collagen fibrils are orderly arranged, provide sites for the nucleation, and modulate the growth of the HA crystals. 16 Therefore, the MC is more closed to the natural bone tissue than inorganic CaP biomaterials in terms of both composition and microstructure. The effects of the MC on repairing bone defects and promoting new bone regeneration have been demonstrated by many laboratory studies and clinical practices, such as treatment of intervertebral fusion and bone nonunion.17–20 Furthermore, MC was demonstrated to have better effect on promoting osteogenic differentiation of stem cells in comparison with the CaP biomaterials, according to cell and molecular biology investigations.21,22 However, the comparative studies between MC and CaP on their osteogenesis effects on human stem cells have not been reported, and related molecular mechanism on gene level is poorly understood.
Human mesenchymal stem cells (hMSCs) with a great potential ability of multidirectional differentiation can differentiate into bone, cartilage, muscle, fat, nerves, and so on. In addition to their differentiation, hMSCs also have other special biological characteristics, including easy isolation and in vitro amplification, immunomodulatory effects, hematopoietic support, and production of various bioactive substances.23,24 These attributes make them ideal candidates as seed cells for tissue engineering, particularly promising in clinical studies of bone tissue reconstruction research.
Our previous studies have shown that the same stem cells on different materials had different behaviors and fates.10,25,26 In this study, we investigated the behaviors of hMSCs on MC and HA and gene expression profiling difference of osteogenic differentiation in hMSCs. At first, MC and HA samples were prepared. Then, hMSCs were seeded on both samples. Proliferation, differentiation, and adhesion of hMSCs were then examined to characterize the effects of materials on the cells. We found that different groups have different impact on hMSCs, and especially MC can promote the differentiation of hMSCs into osteoblast. This study is of great significance and would lay the foundation for clinical applications of the MC-based medical devices. The results would be helpful to understand the regulation effects of the MC on osteogenic differentiation of hMSCs and provide novel ideas for the design of bone graft substitutes.
Experimental
Preparation and characterization of MC and HA
MC was provided by Beijing Allgens Medical Science and Technology Co., Ltd., and was prepared as previously reported. 27 First, type-I collagen solution with the concentration of 0.67 g/L was prepared and then added with solutions of CaCl2 and H3PO4 (Ca/P = 1.67) dropwise, respectively. Sodium hydroxide solution was used to adjust the pH of the reaction system to 7.4, and MC deposition gradually formed. After the reaction for 48 h, the MC deposition was collected and purified by centrifugation for several times. After freeze-drying and milling, MC powder was compressed into compact form for mechanical tests and cell culturing.
HA ceramic samples were prepared from HA powder (Institute of Nuclear and New Energy Technology, Tsinghua University, China) with particle size around 100 nm by a three-step sintering process, as described previously. 28 HA powder was compressed into compact discs before sintering in the preparation of HA ceramic samples to eliminate difference in topography between the HA ceramic and compact MC discs.
The elastic modulus was tested with a universal material testing machine (Zwick/Roell Z010) with a 10-kN load cell. The cross-head speed was set at 0.5 mm/min, and the load was applied until the samples were compressed to approximately 30% of its original length.
The phase composition of the samples was identified by X-ray diffraction (XRD) (D/MAX-2500X; Rigaku) using monochrome CuKα radiation (λ = 1.5405 Å, 120 mA, 40 kV) in a continuous scan mode with a scanning speed of 8°/min, and the 2θ range was from 10° to 60° was used to determine the phase composition.
The molecular structure of the samples were characterized by Fourier transform infrared spectroscopy (FTIR, Nicolet Magna IR 560) at a resolution of 0.35 cm−1 and 32 scans with a wave number from 250 to 2500 cm−1.
Cell culture on MC and HA
The hMSCs were provided by the Peking Union Medical College Hospital.
29
Cells were cultured in the proliferation medium (Cyagen Biosciences, Inc.) consisting of DMEM, 10% fetal bovine serum, 2 mM
As the surface treatment of the materials, MC and HA discs were incubated in phosphate-buffered saline (PBS) and the culture medium 4 h before cell seeding. The discs were placed at the edge of each well of the plates, and cell suspension was pipetted on top of each disc. To avoid waste of the cells, the plates were tilted to keep the cell suspension within each disc. The culture medium was refreshed every 2 days.
Morphology observation of hMSCs
The morphology of hMSCs was observed by scanning electron microscopy (SEM, FEI Quanta 200) and confocal microscopy (LSM 710; Zeiss).
After 24 h of incubation as described previously, cells were washed by PBS and fixed by 4% paraformaldehyde at room temperature for 20 min. For the samples for SEM observation, they were dehydrated through gradient of alcohol. After sputter-coated with gold, the samples were observed by SEM. For the samples for confocal microscopy, cells were treated by Triton X-100 (Sigma-Aldrich Co. LLC.) for 5 min and then stained by Rhodamine (Sigma-Aldrich Co. LLC.) for cytoskeleton and DAPI (Sigma-Aldrich Co. LLC.) for nucleus.
Quantitative detection of hMSCs proliferation
The cell proliferation was tested by cell counting kit-8 (CCK-8, Dojindo, Japan) assay (n = 3). The cells were cultured on MC and HA in 24-well plates. Likewise, the blank plate group was taken as the control group with cells cultured in the proliferation medium, as described previously. At the indicated times (4 h, 2 days, 4 days, 6 days), 50 mL of CCK-8 solution was added into the samples and incubated at 37°C for 4 h, and the ratio of cell survival was quantified on an ELISA plate reader at 490 nm.
Osteogenic differentiation detection of hMSCs
Alkaline phosphatase (ALP) is a key enzyme in osteogenic differentiation process, and its activity increases with the enhancement of cell osteogenic differentiation. Therefore, the ALP activity is an important indicator to determine the osteogenic differentiation of the cells. 30 To declare the difference of hMSCs osteogenic differentiation in response to MC and HA, ALP activities of the cells on the samples were quantified by an ALP Assay Kit (Beyotime Institute of Biotechnology) following the instructions at the indicated times (5, 10, and 15 days). The blank plate group was also taken as the control group with cells cultured in the proliferation medium.
RNA isolation and microarray hybridization
Total RNA was extracted from hMSCs on MC and HA using the TRIzol reagent (Thermo Fisher Scientific, Inc.) according to the protocol. The RNA quality was detected by the Agilent 2100 bioanalyzer and RNA LabChip kits (Agilent Technologies). The sample pools of three independent biological replicates were mixed for gene expression analysis. Next, 100 ng of total RNA was used for transcriptional profiling with Affymetrix 3′IVT microarray analysis (Affymetrix, Inc.) using the Affymetrix 3′IVT Express Kit to generate biotin-labeled antisense cRNA. The labeled cRNA was used for hybridization. After an automated process of washing and staining by the AGCC software (Affymetrix, Inc.), absolute values of expression were calculated from the scanned array using the Affymetrix Command Console software.
The microarray analysis
To identify differentially expressed genes, pairwise comparison analysis was performed with the analysis system using functions in R package, R software, and NCBI Entrez gene database. The gene expressions of hMSCs on experimental MC and HA groups were compared with those on the control group. The gene expression differences were stringent screened. Only those genes with expression level upregulated exceeding threefold or down-egulated below one-third were selected for further analysis. Only well-characterized genes in DAVID (Kyoto Encyclopedia of Genes and Genomes, KEGG), genomic coordinates, RefSeq accession, GenBank accession, Entrez Gene, and TIGRID database were included.31,32 Gene ontology (GO) terms and KEGG pathways were identified according to those genes selected by microarray screening. 4
Statistical analysis
All data are expressed as mean ± standard deviation. Single-factor analysis of variance technique was used to assess the statistical significance of the results between the groups. The statistical assessment was performed by the SPSS 13.0 software at 95% confidence level.
Results and Discussion
Characterization of MC and HA
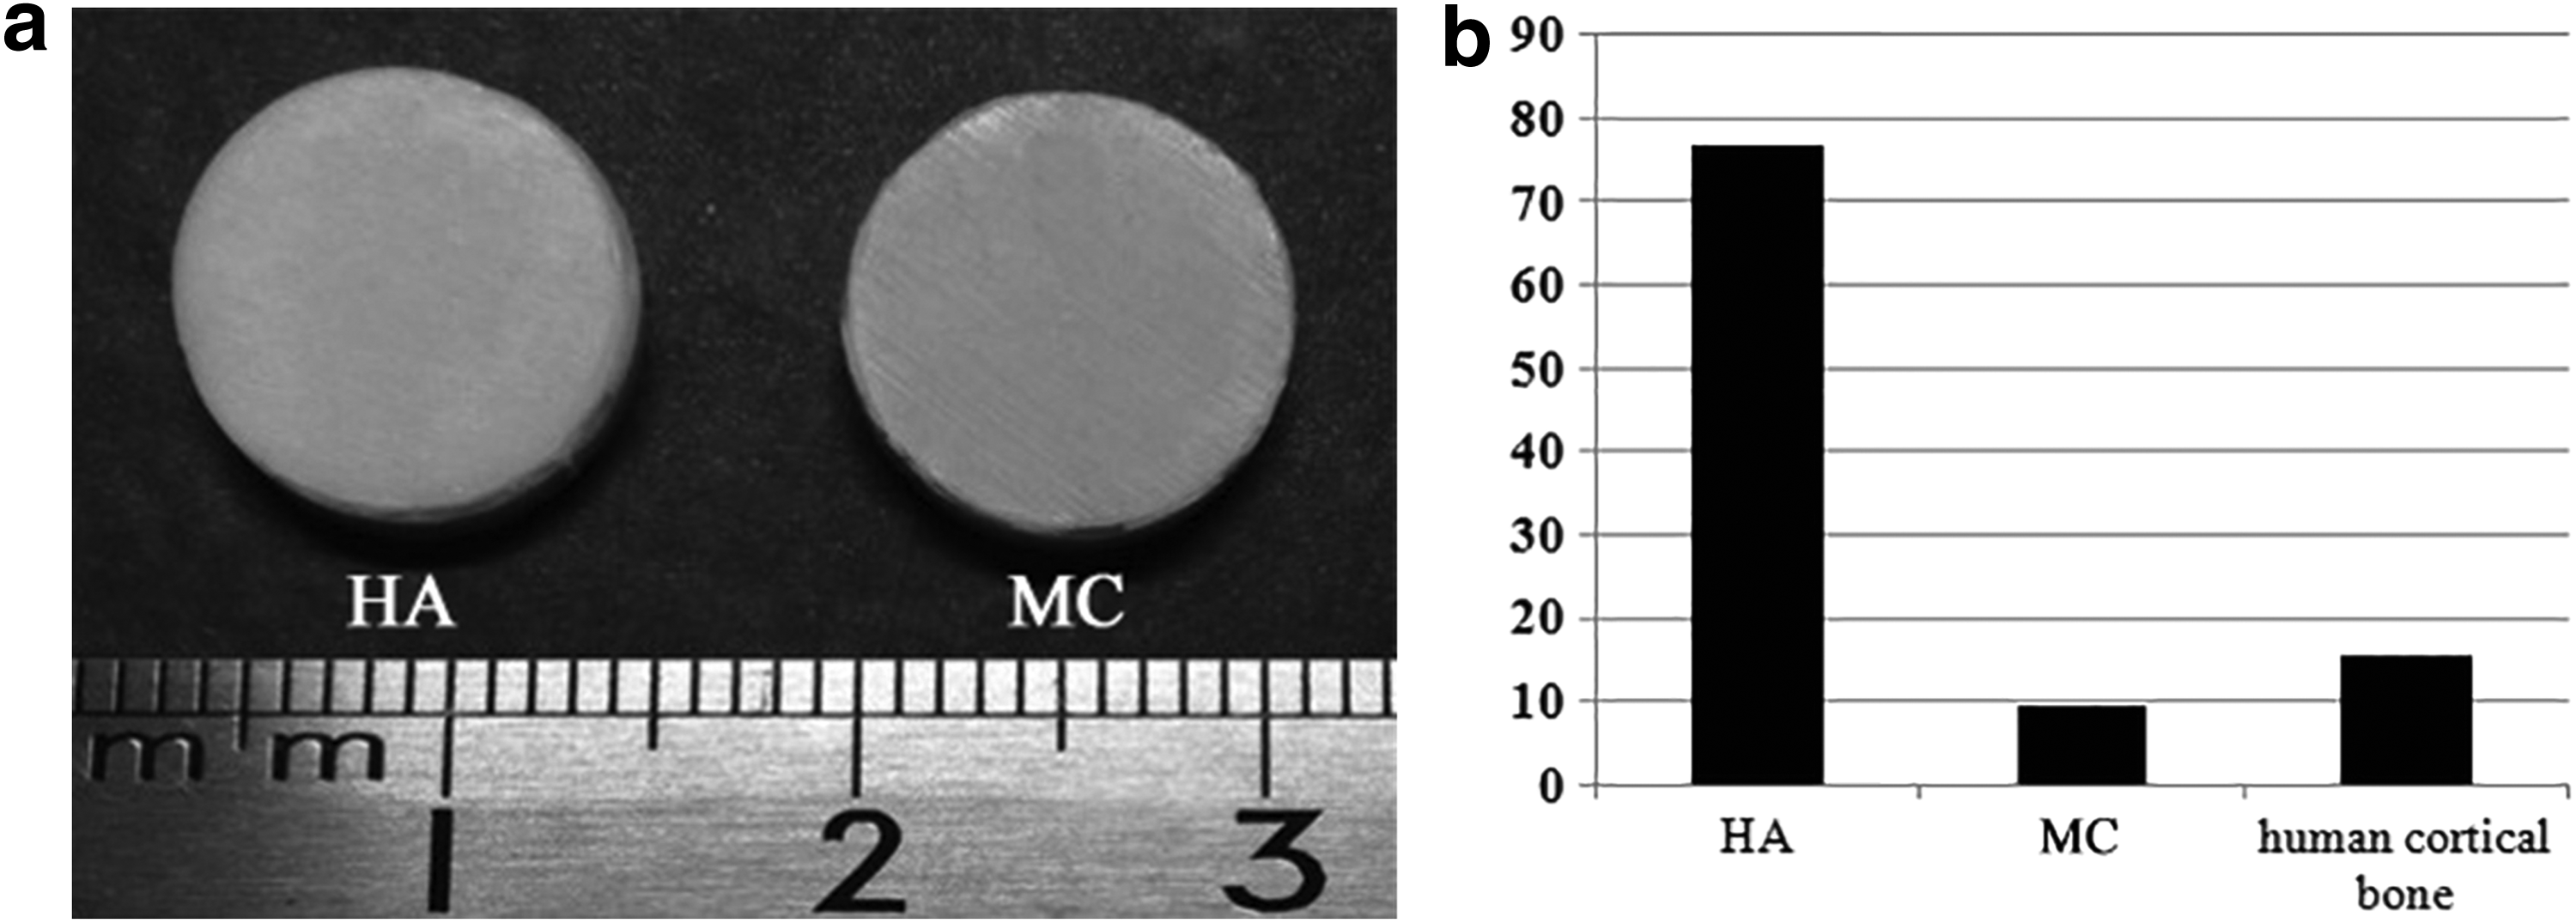
The finished samples of MC and HA are shown in Figure 1a. Experimental samples are discs with 1 cm in diameter and 2 mm in thickness. The elastic modulus of MC and HA are shown in Figure 1b. The compressive elastic modulus of MC was close to human cortical bone, while that of HA is much higher than human cortical bone. According to Wolff's law, stress is a key factor to the growth of bone tissue. However, an implant with excessively higher modulus would lead to stress shielding that is unfavorable to bone regeneration. Therefore, stress shielding is inevitable by using a block of HA ceramic with such high modulus, while the biomimetic MC with similar compressive modulus to human cortical bone could avoid disadvantageous stress shielding in biomedical applications.
The phase composition of MC and HA was identified by XRD. Figure 2 shows that the HA group had the typical XRD pattern of standard HA, and all the diffraction peaks could be assigned to the standard card of HA (ICDD PDF card #9–432). Otherwise, in the MC group, according to the above standard card of HA, all the reflections can be readily indexed to HA conforming to a space group, whose crystallinity was inferior to that of samples HA. The XRD patterns demonstrated that the mineral composition formed during the biomimetic mineralization was poor crystalline HA within nanoscale size, which is in conformity with our previous studies on MC. 14
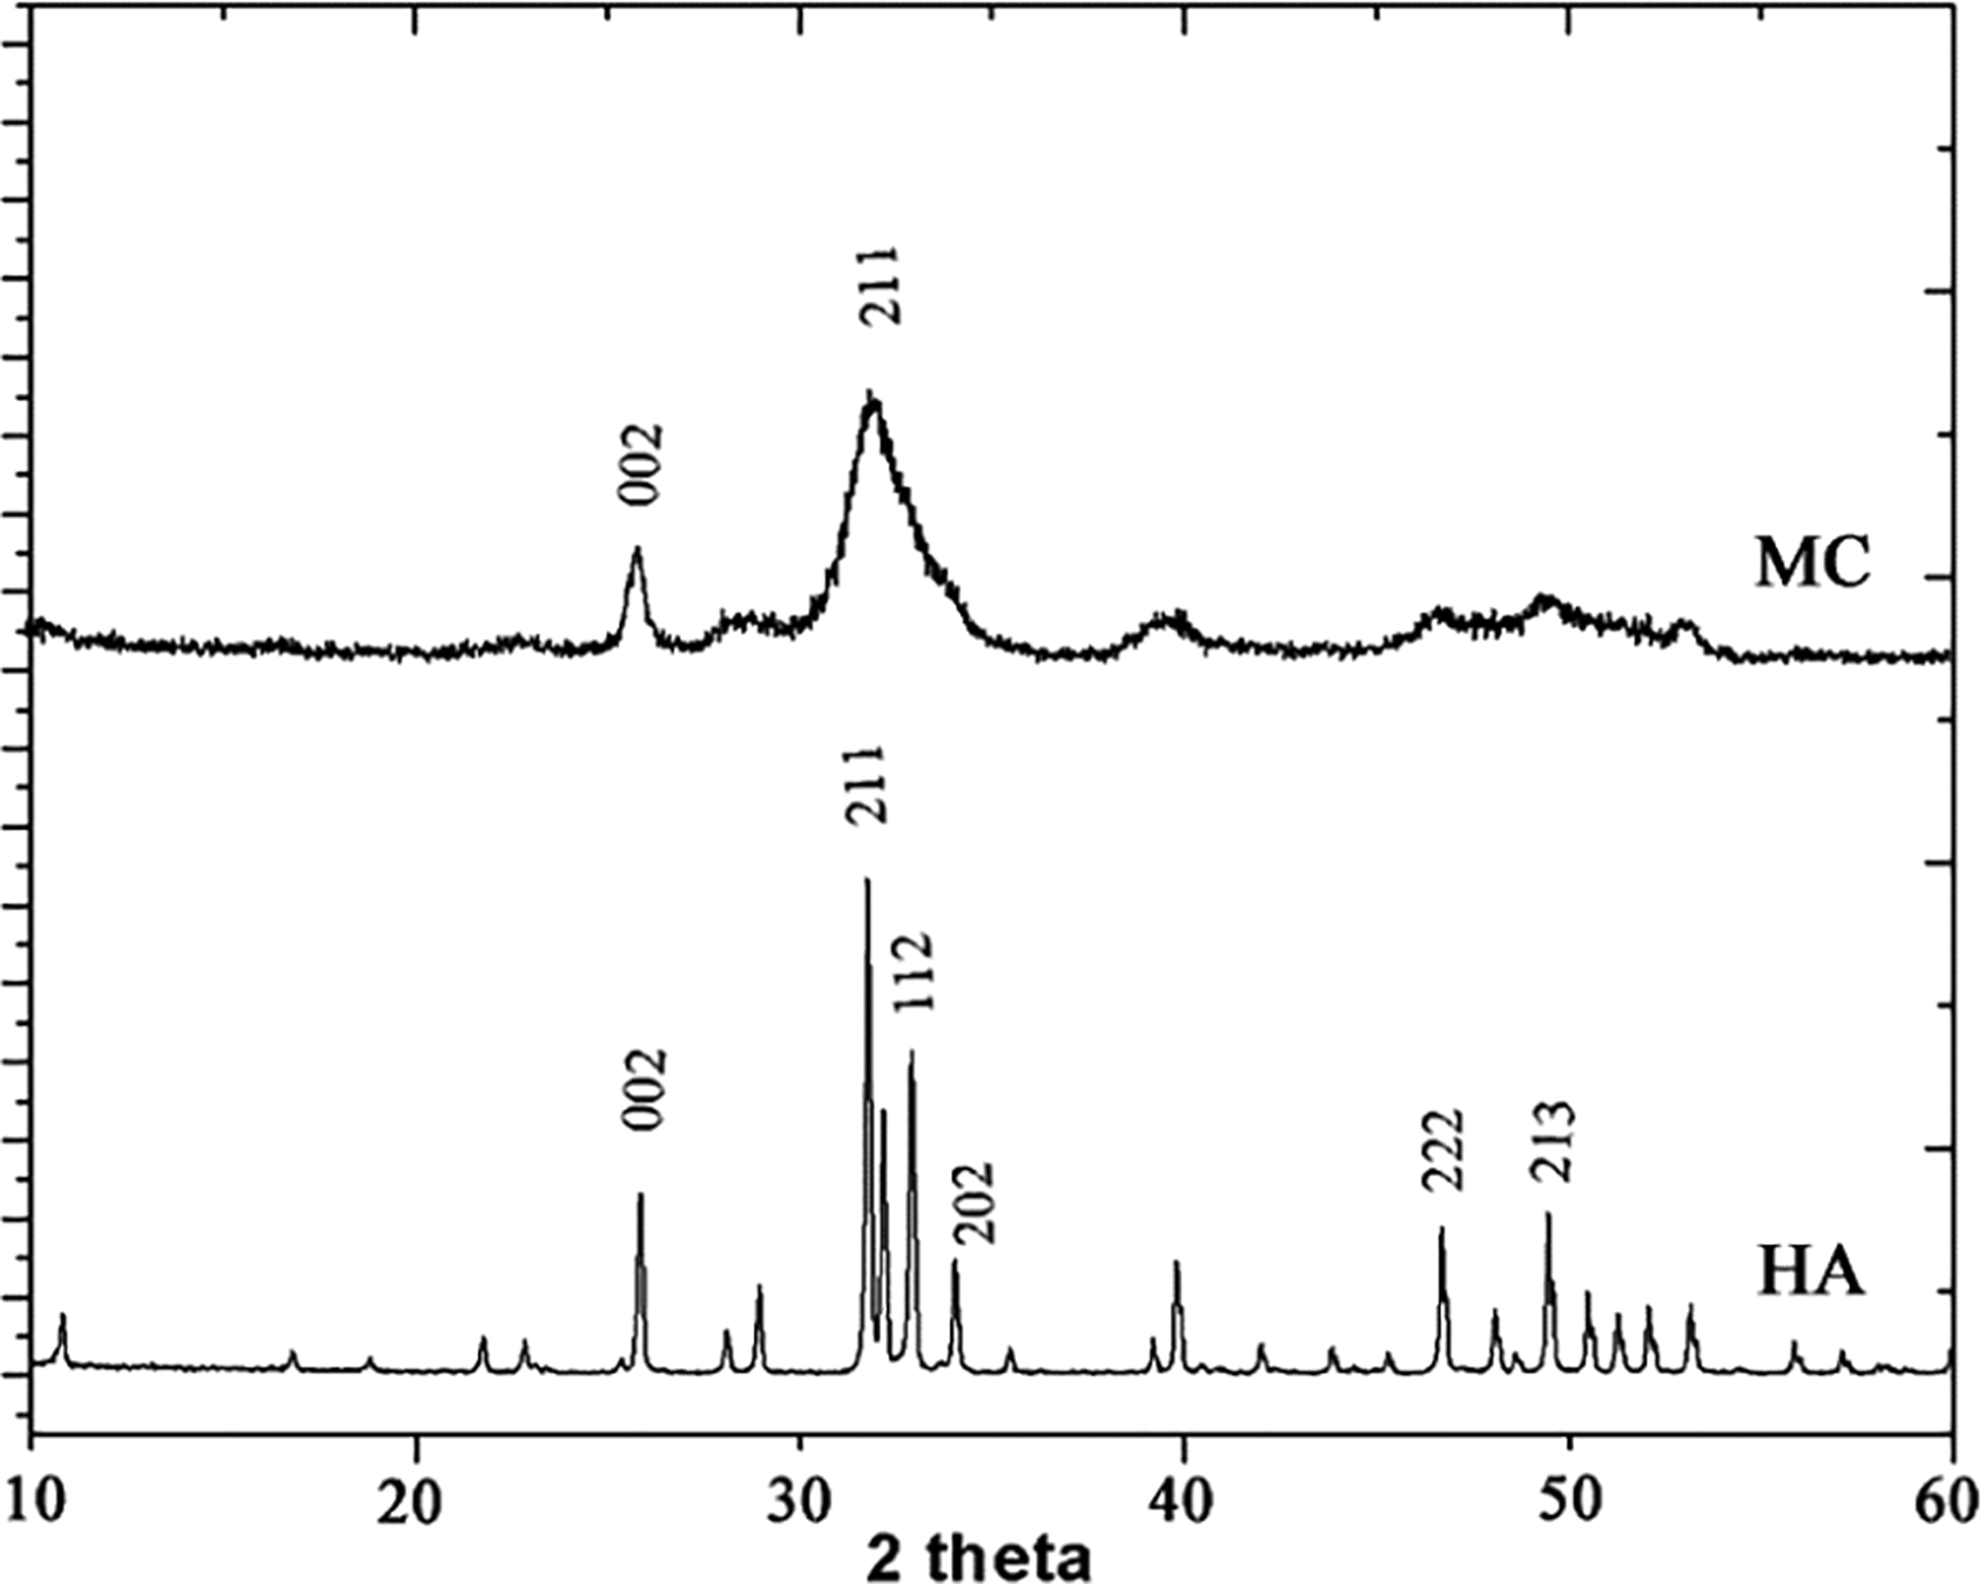
X-ray diffraction patterns of materials.
The FTIR spectra of MC and HA are shown in Figure 3, and they accord with our previous studies.20,27,33,34 HA showed PO43− stretching band at 1045, 960, 602 and 571 cm−1. The absorption band located at 631 cm−1 was the characteristic peak of O-H. MC showed characteristic peaks of type-I collagen and are probed at 1653 (amide I), 1550 (amide II), and 1032 cm−1 (C-OH). Another two bands at 1471 and 1417 cm−1 were assignable to the -CH3 and = CH2 bending vibrations.
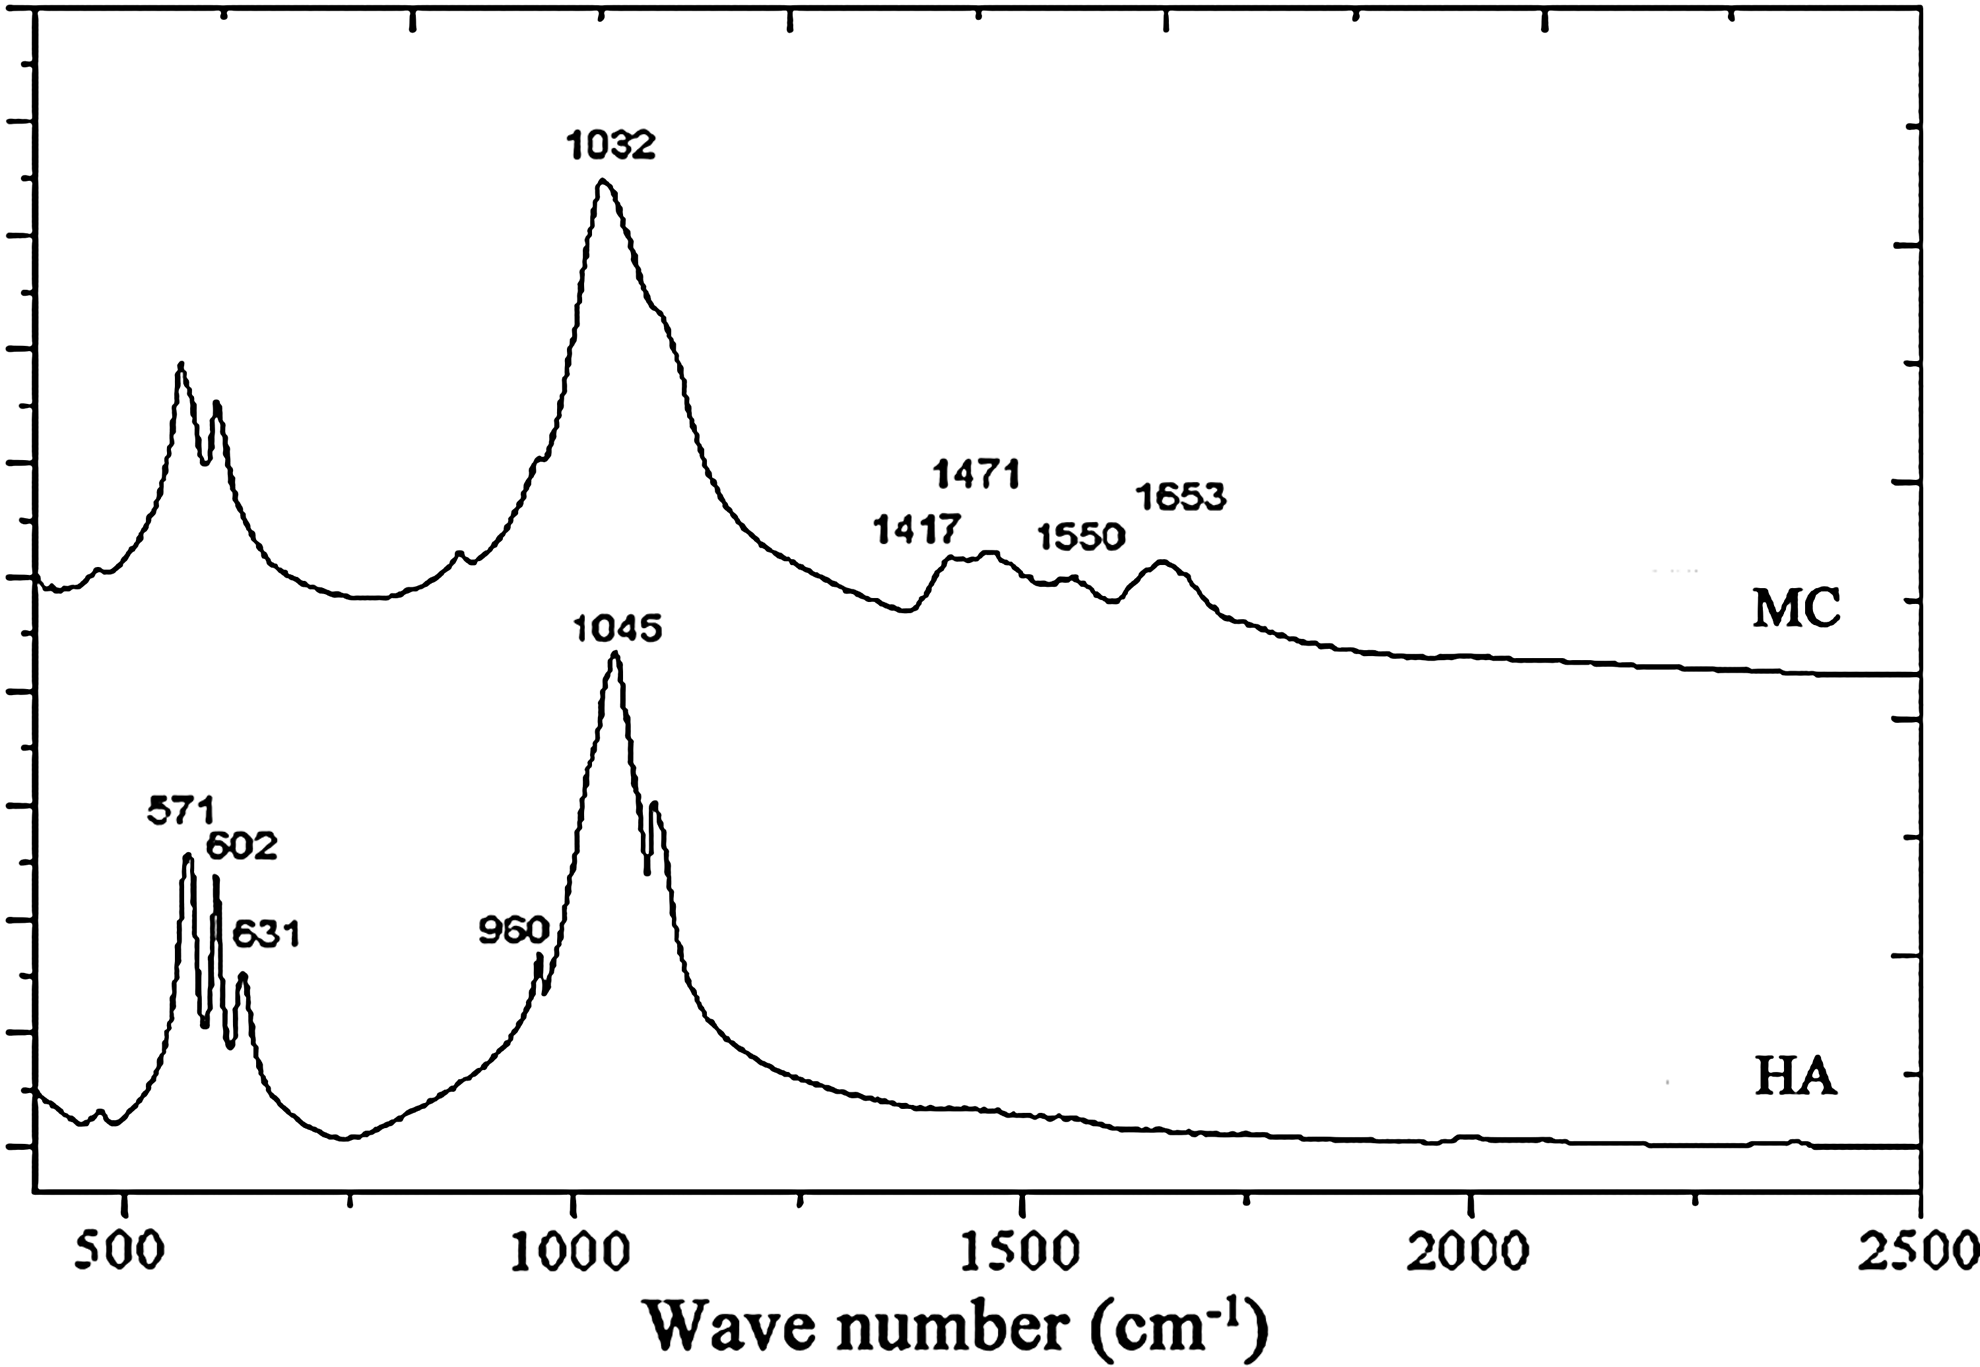
Fourier transform infrared spectroscopy of the MC and HA samples.
Morphology of hMSCs
As SEM micrographs shown in Figure 4, adhesion and growth of hMSCs onto the test materials exhibited changed cell morphology and viability. After 48 h of culture, the adhesion and morphology of cell analysis further confirmed the differences of cells cultured on different groups. In the MC group, cells grew normally and regularly in parallel. On the edge of cell contact area, some tiny fibrils were observed. On the HA surface, cells had a larger spreading areas and spread flattened, and there were hardly any membranous “pseudopods” from cell body. As shown by confocal images in Figure 5, the number of bMSCs on the MC was also greater than that on the HA substrate. Such phenomenon indicated that hMSCs adhered and grew better on the MC than on the HA substrate.
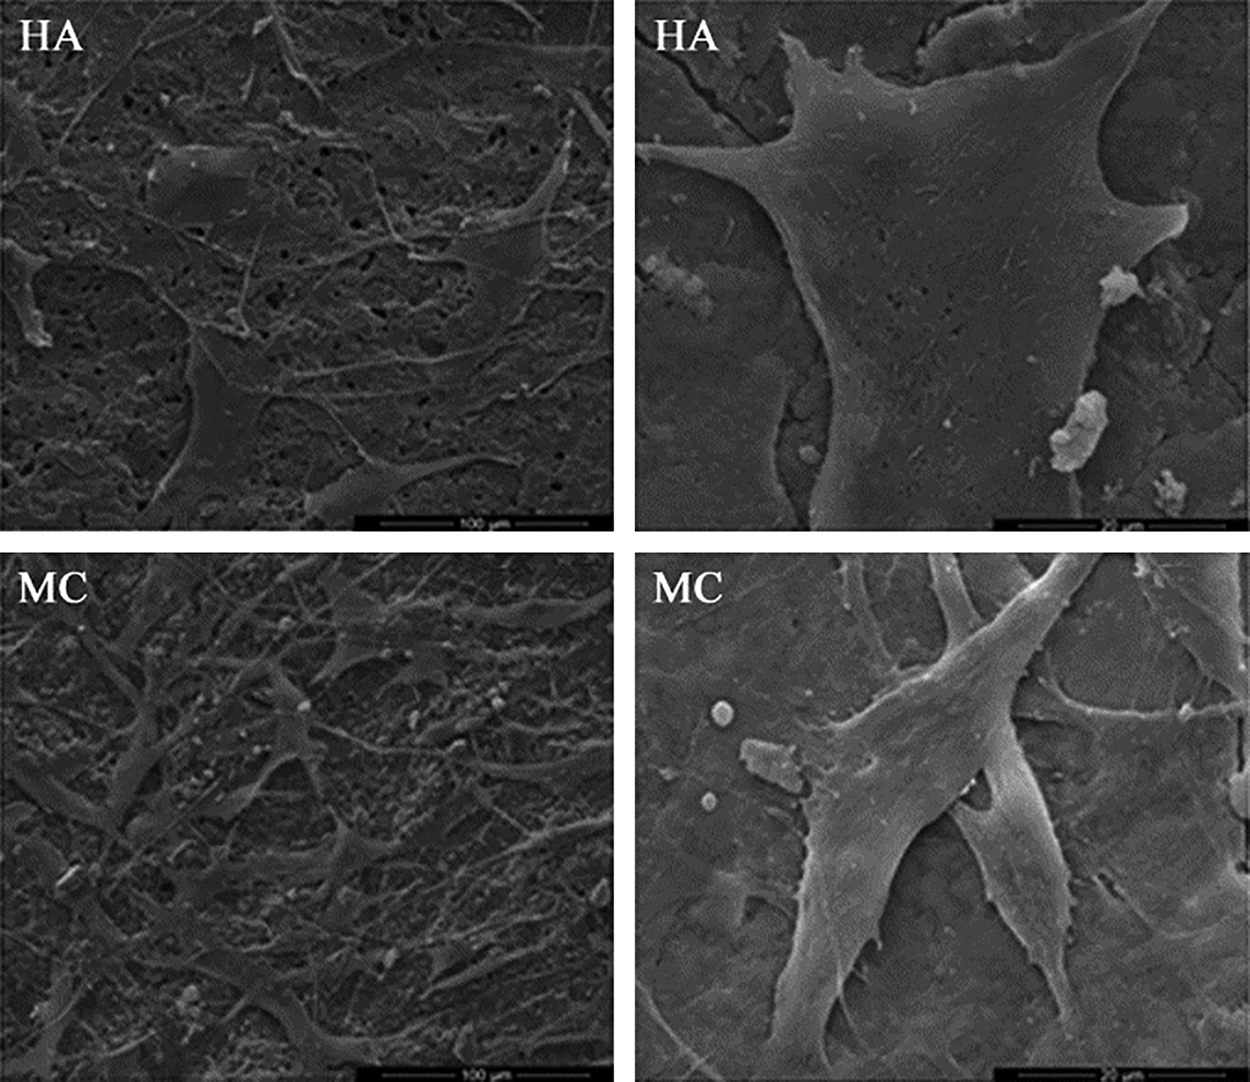
The SEM micrographs of cells cultured on HA and MC surfaces with serum-free conditions after 24 h.
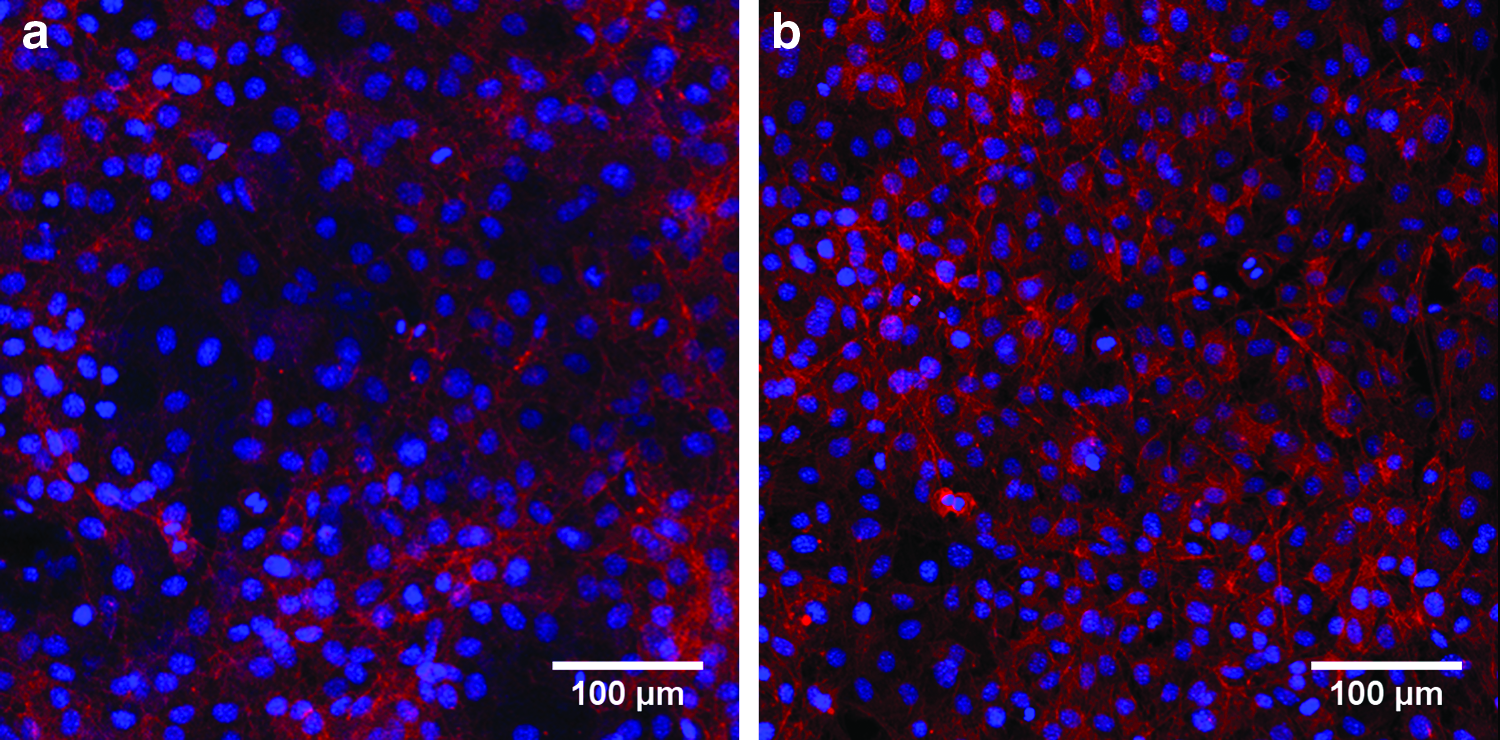
The confocal images of bMSCs on
Proliferation of hMSCs
From the results of SEM, we found that different materials had impact on hMSCs. Further quantitative detection was carried by cell proliferation assay in Figure 6. At 4 h, there was a small but not significant difference among different groups. Two days later, the cells on the control group and the MC group increased remarkably. Being different from the case of the first day, the quantity of hMSCs in the HA group was fewer than the control group apparently. From day 4 and 6, the growth of cells in the control group and the MC group was similar. While the HA group had an inhibitory effect on cell proliferation, the cells remained at a very low level. Hence, MC has better biocompatibility than HA and can keep the cell proliferation in a longer culture period.
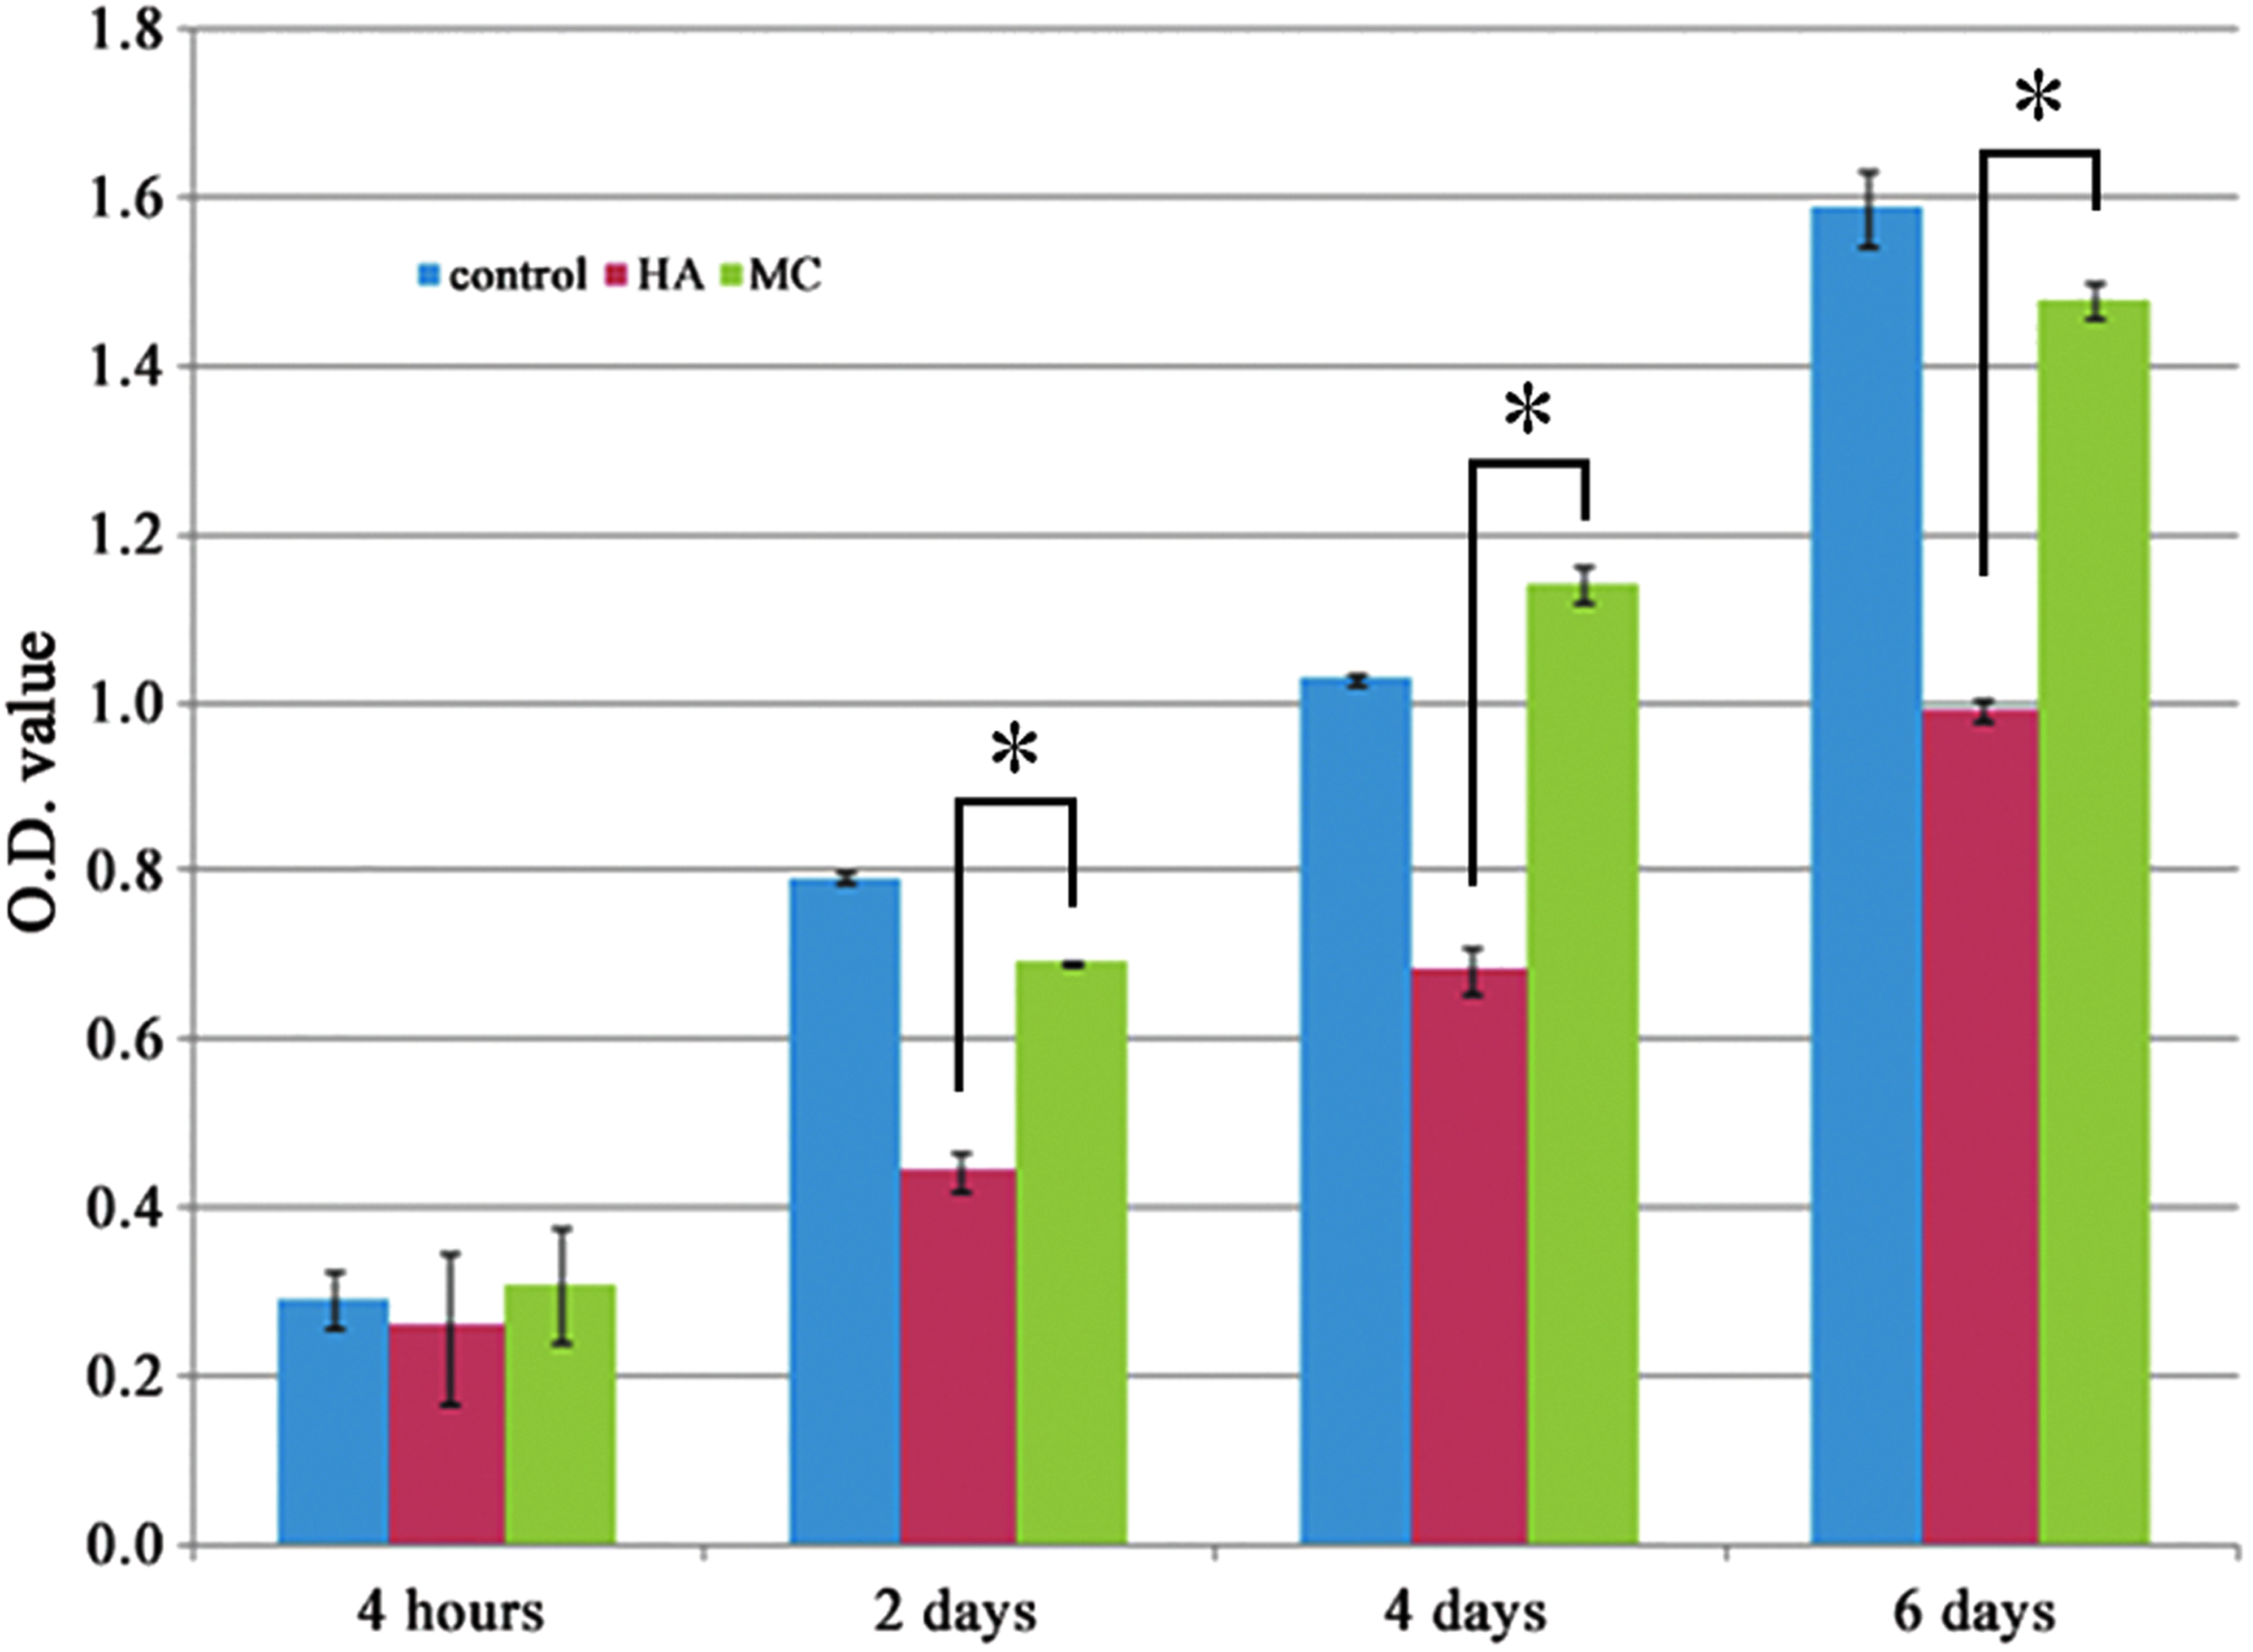
The proliferation of cells cultured on different substrates for 4 h and 2, 4, and 6 days by the MTT assay (n = 6). * indicates significant difference (p < 0.05). Color images available online at www.liebertpub.com/tea
Differentiation of hMSCs
High ALP levels can occur if active bone formation occurs; therefore, ALP is an important marker for assaying early osteogenesis effect of a biomaterial. ALP detection results showed that hMSCs tended to differentiate into osteoblast on MC substrates. After 15 days, the ALP activity of the cells on MC surface was significantly greater than that on HA (Fig. 7). This result is in conformity with those previously published by our group. 22 Such previous study indicated that not only the ALP but also the expressions of many other osteogenic markers (osteocalcin, Col1a1, cbfa1, etc.) were upregulated by the biomimetic MC. 22
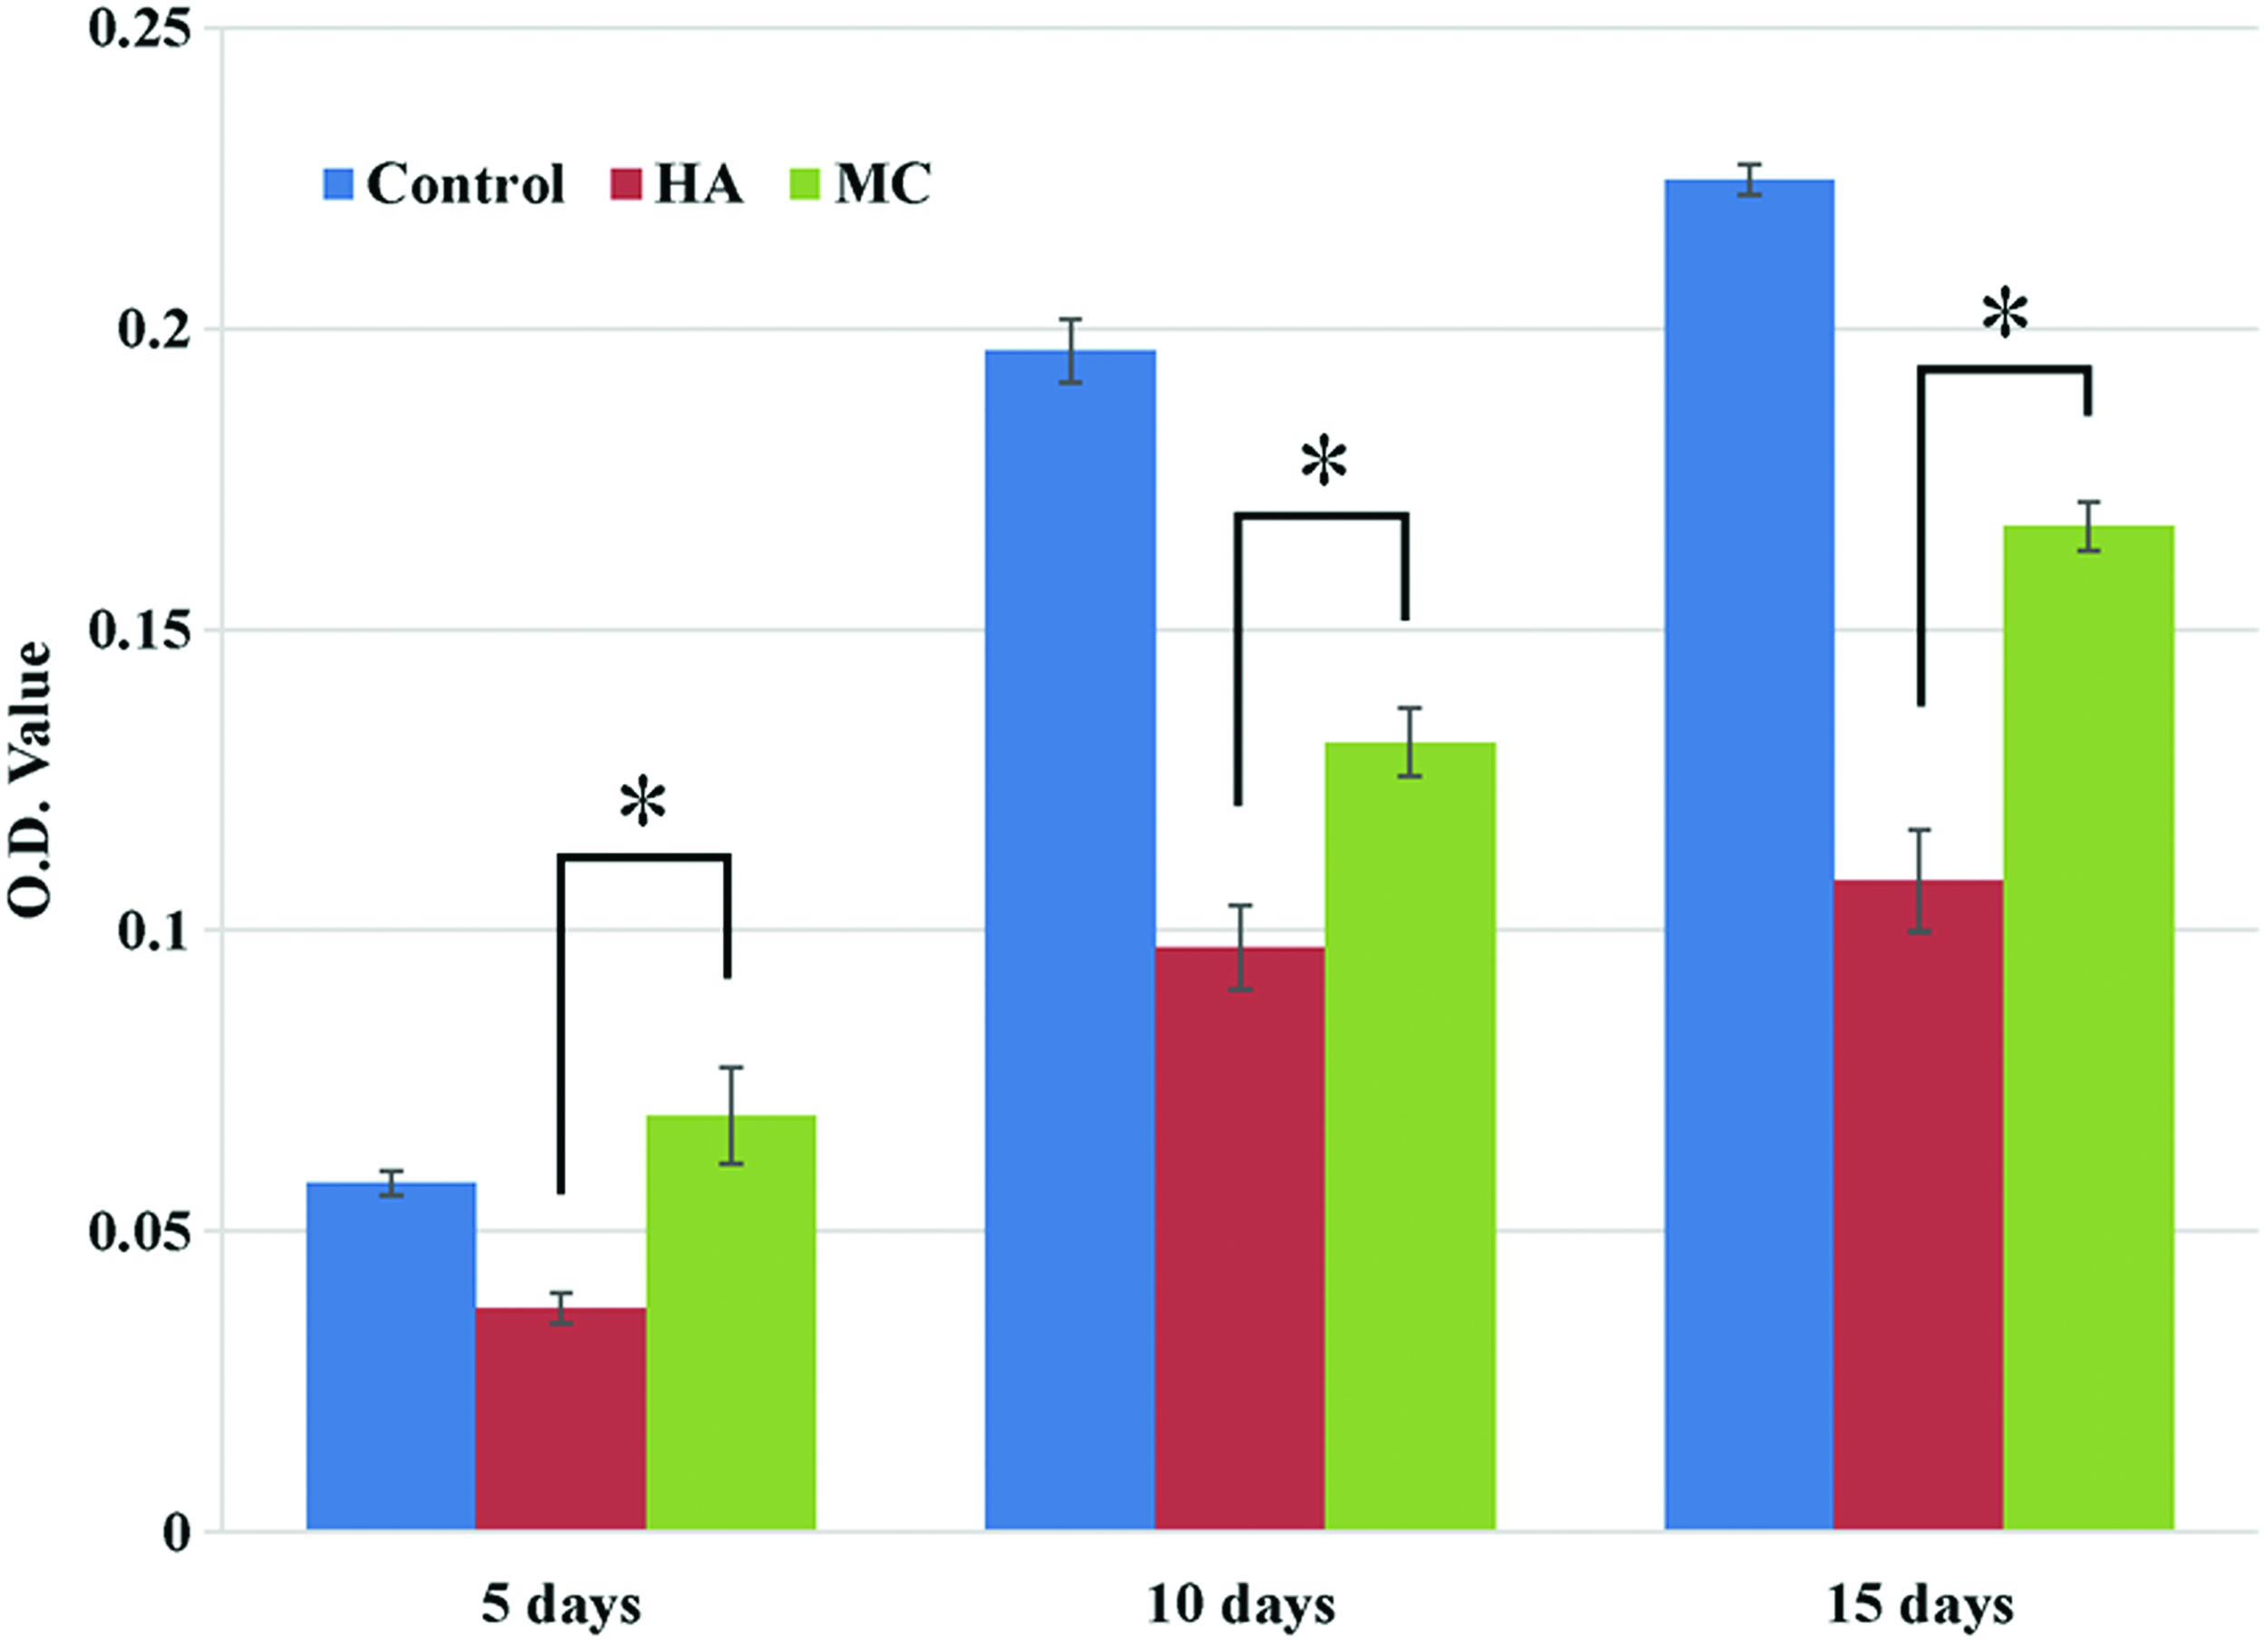
Alkaline phosphatase detection results showed that MC had the ability to induce human mesenchymal stem cells differentiate into osteoblast. * indicates significant difference (p < 0.05). Color images available online at www.liebertpub.com/tea
The gene expression differences analysis
The hMSCs of MC, HA, and control groups showed different gene expression profiles by DNA microarray analysis. To investigate mechanisms, differentially expressed genes met the selection criteria, as described previously, and were selected for further analyses. There were totally 922 upregulated and 1417 downregulated genes for hMSCs in the HA group compared to the control group, whereas there were 289 and 2166 genes for hMSCs in the MC group compared to the control group. By comparing with the cells on the MC, there were 1504 upregulated and 139 downregulated genes of hMSCs on the HA.
GO term analysis
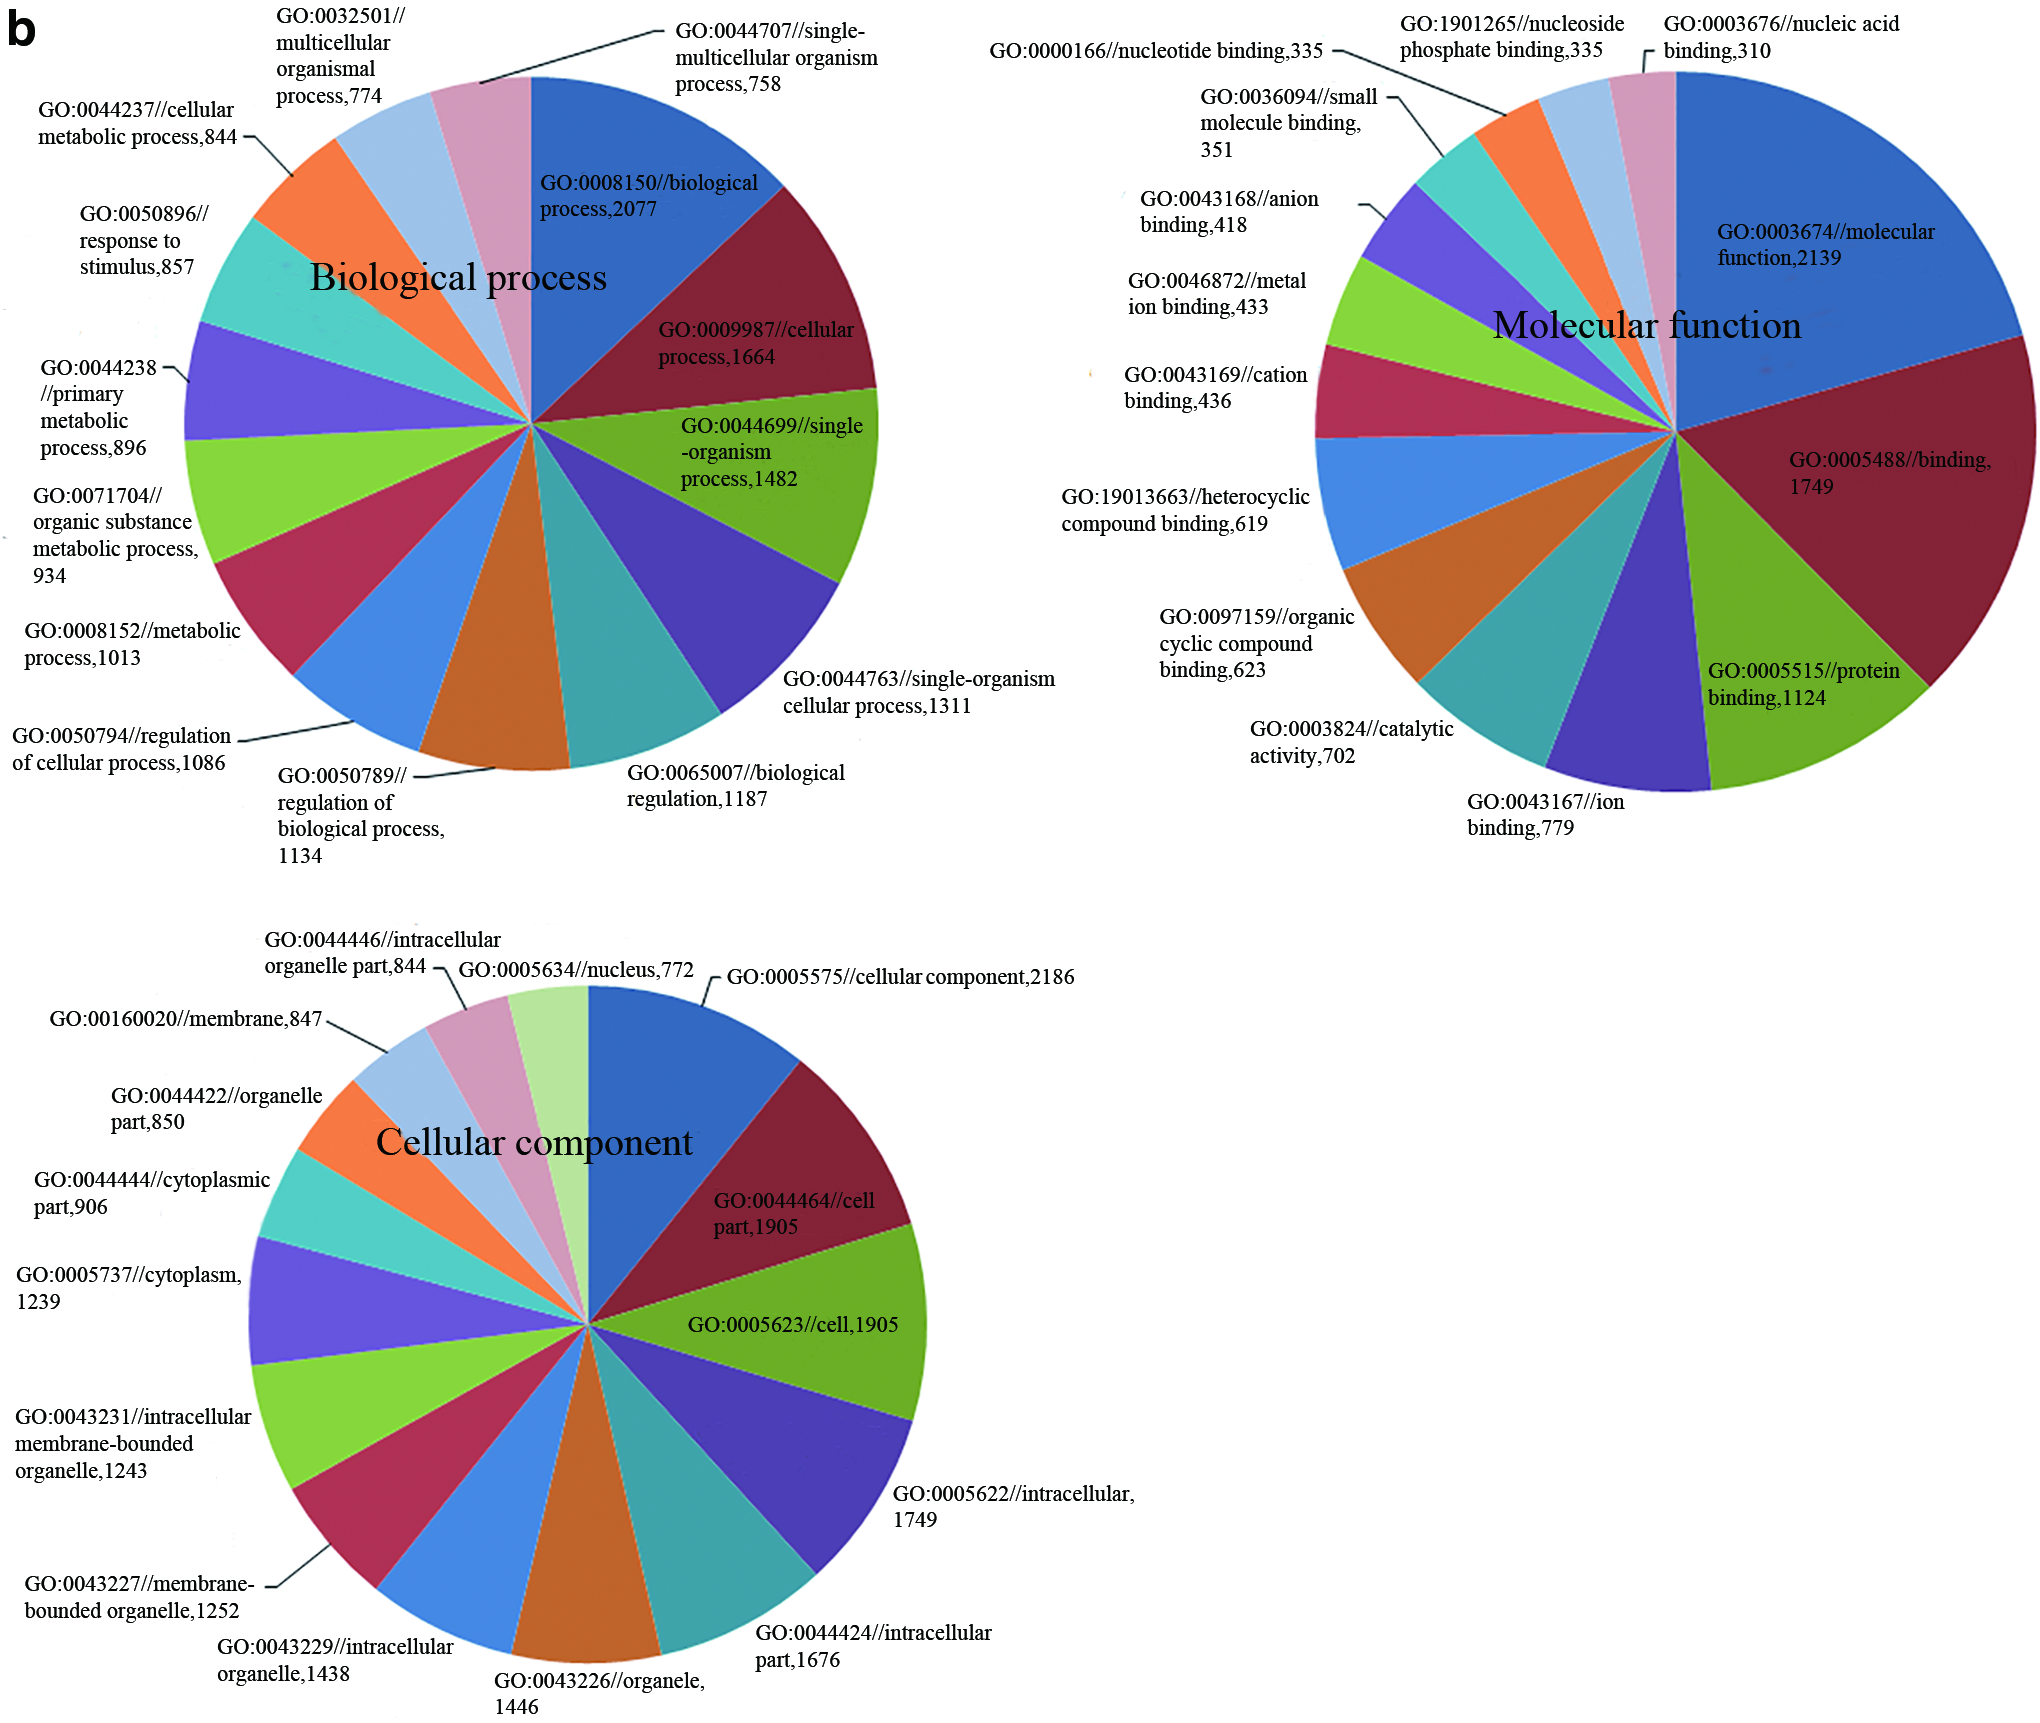
In this study, GO classification scheme was used to categorize transcripts by putative function. 35 As shown in Figure 8a–c, biological processes, cellular components, and molecular functions across genomes are uniformly described by GO tools. The up- and downregulated genes between different experimental groups were analyzed, and p < 0.05 was considered significant. If there were more than 10 genes enriched in a GO term, only the top 10 genes were listed in the relevant table.

Percentage representation of gene ontology (GO) mappings for differential gene clusters
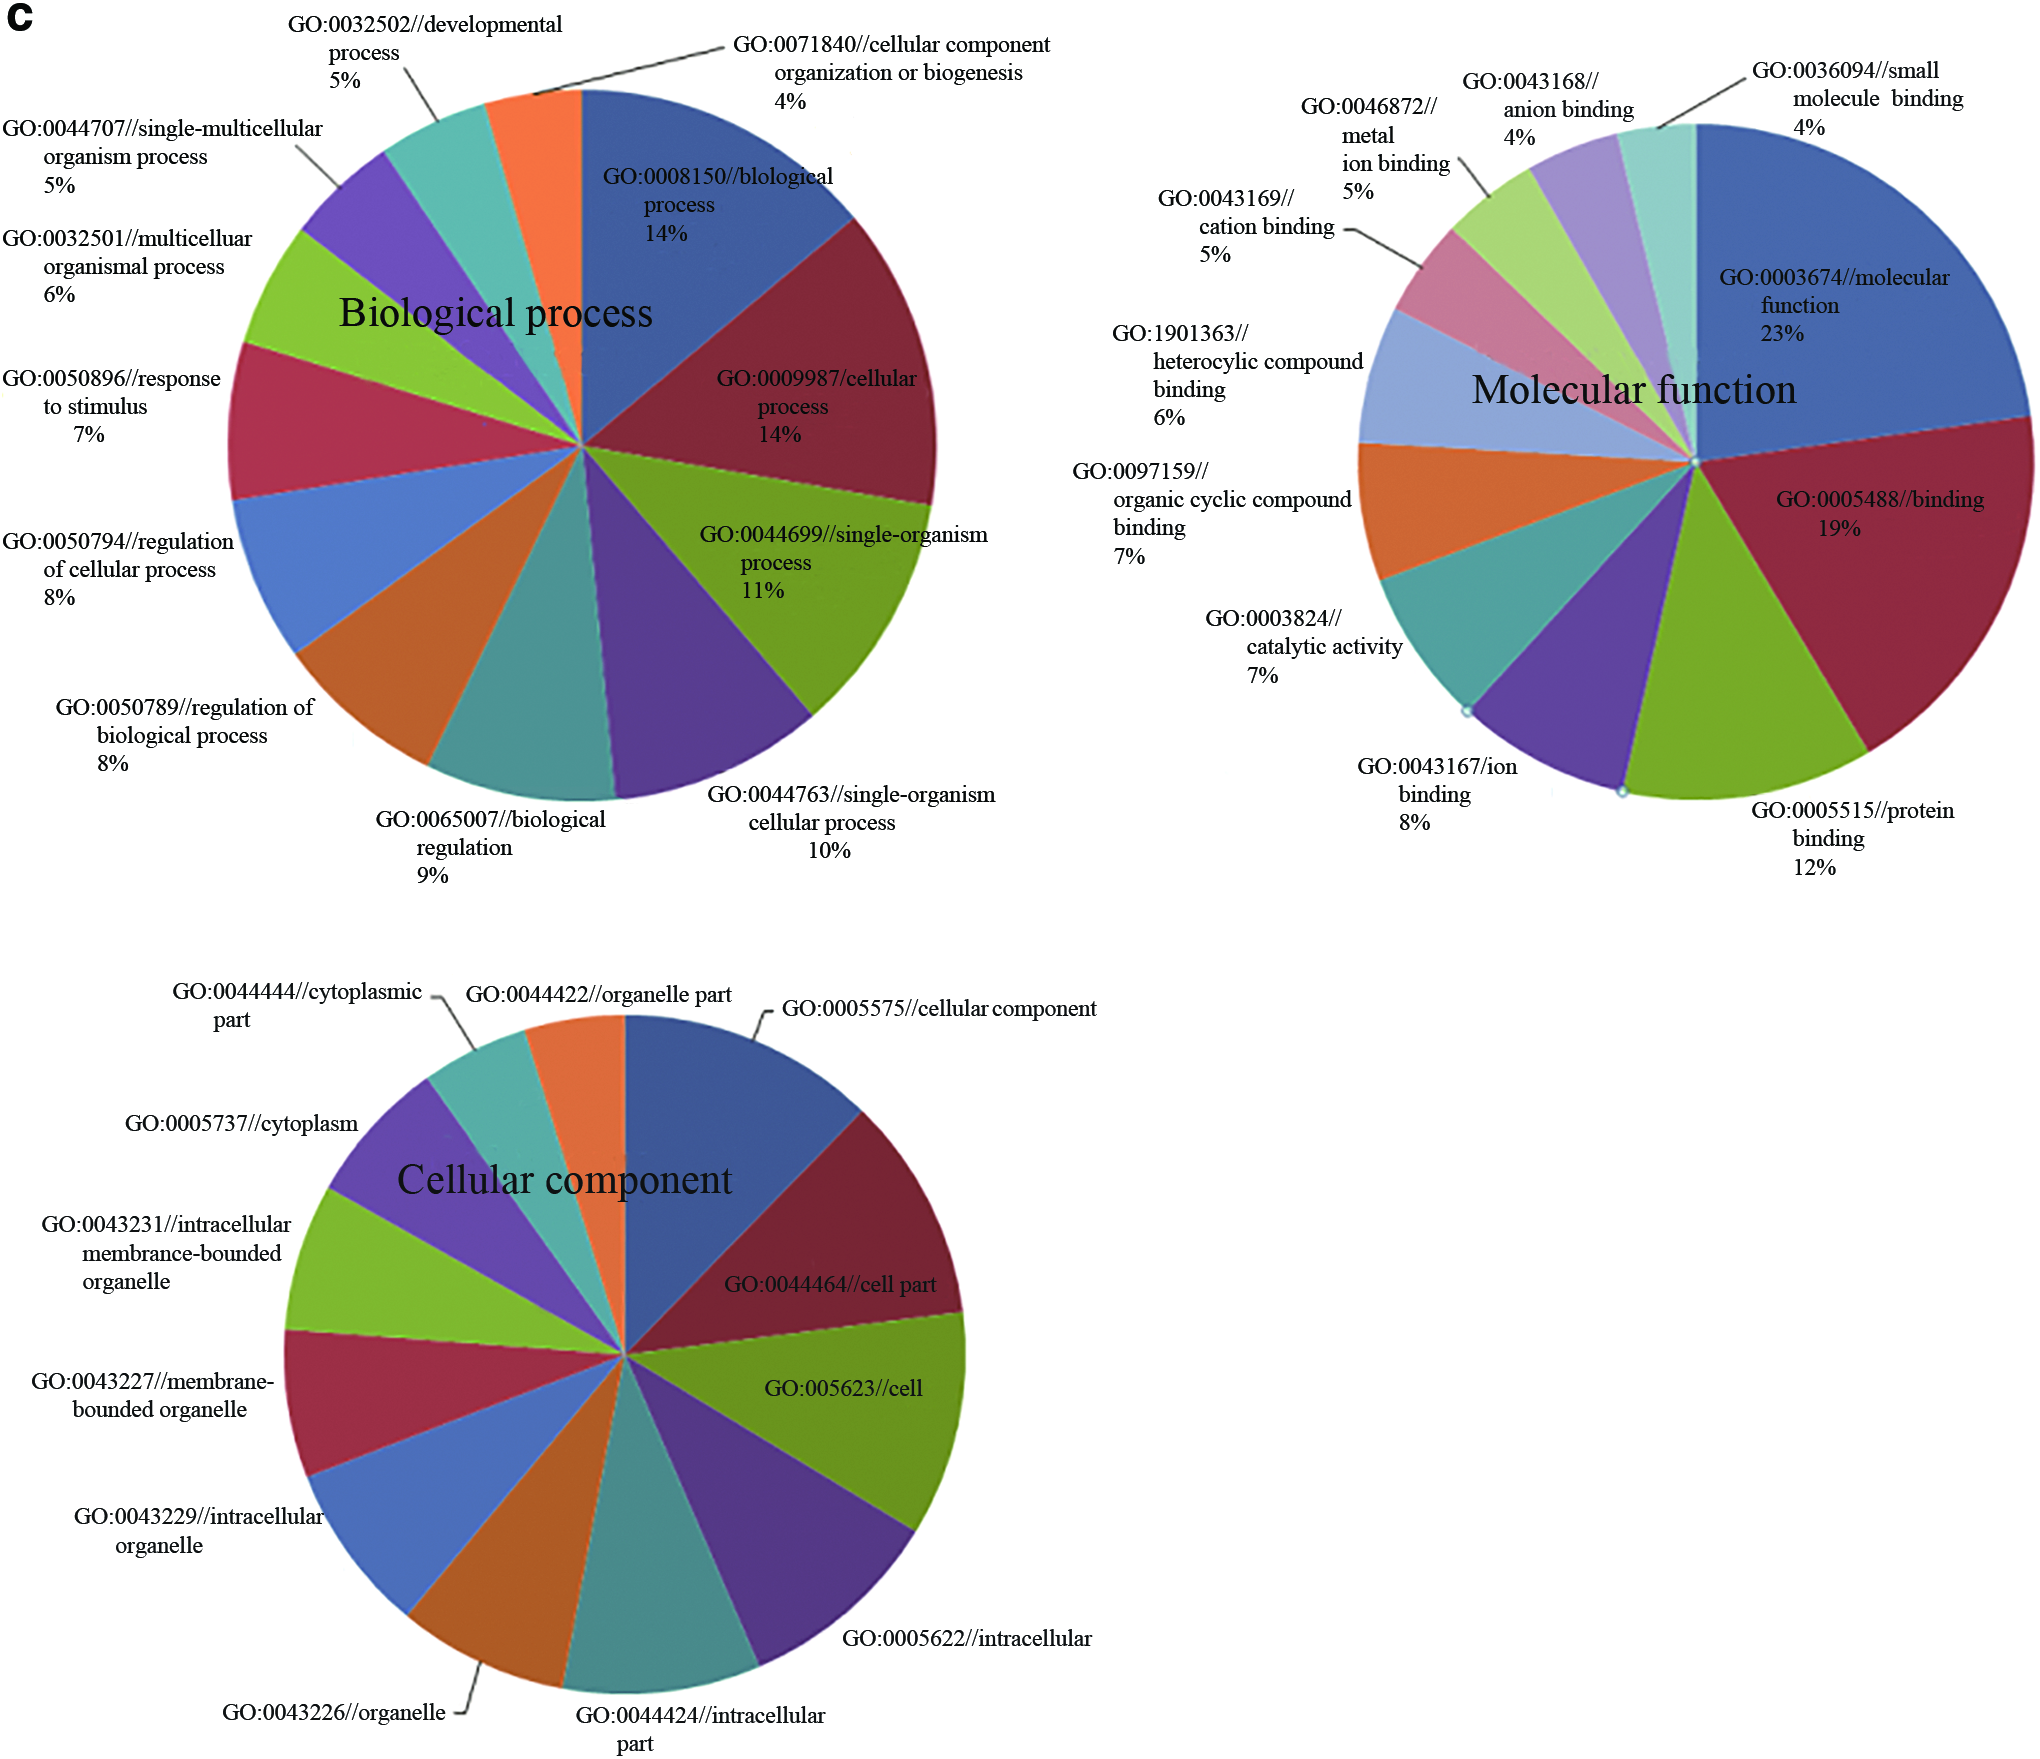
For cells in the MC group, many genes were upregulated in the catalog “biological process” associated with “cell differentiation” function (Table 1). For example, in term of “positive regulation of cell proliferation,” CYR61 can induce cysteine-rich angiogenesis; as a cell surface receptor for fibrillar collagen, DDR2 also regulates cell activities, such as cell differentiation, migration, proliferation, as well as remodeling of the extracellular matrix; BMP2 is an important bone morphogenetic protein. In the “molecular function,” most of the genes were related to cellular response to the osteogenic differentiation. The catalog “cellular component” involved some genes related to fibrillar collagen, such as COL1A1 and COL1A2, and some other genes of cell proliferation, such as IL6ST and CTGF.
GO, gene ontology.
Comparing the HA group with the MC group, among the significant GO terms, several enriched terms associated with cell differentiation, ossification, skeletal system development, bone development, and correspondingly the signal transduction in biological process, molecular functions, and cellular component categories (Table 2).
KEGG term analysis
KEGG pathway analysis was performed to study osteogenesis-associated pathways. The differentially expressed genes of the hMSCs, which met the selection conditions, were involved in the analyses. Probes of the microarray were mapped to gene identifiers, which were used as the input for statistical analysis, p < 0.05 was considered significant.
For cells on the MC group, the enrichment analysis revealed that 28 pathways were associated with differentially expressed genes, as listed in Table 3.
Comparing the HA group with the MC group, the enrichment analysis revealed that eight pathways were associated with differentially expressed genes, as listed in Table 4.
Analysis of microarray data indicated that some genes involved in osteoblast differentiation and function were significantly upregulated in the HA and MC groups (Fig. 9), including FGF2, EDNRA, GHR, FOSL2, IL1R, CTSK, CREB1, and so on.
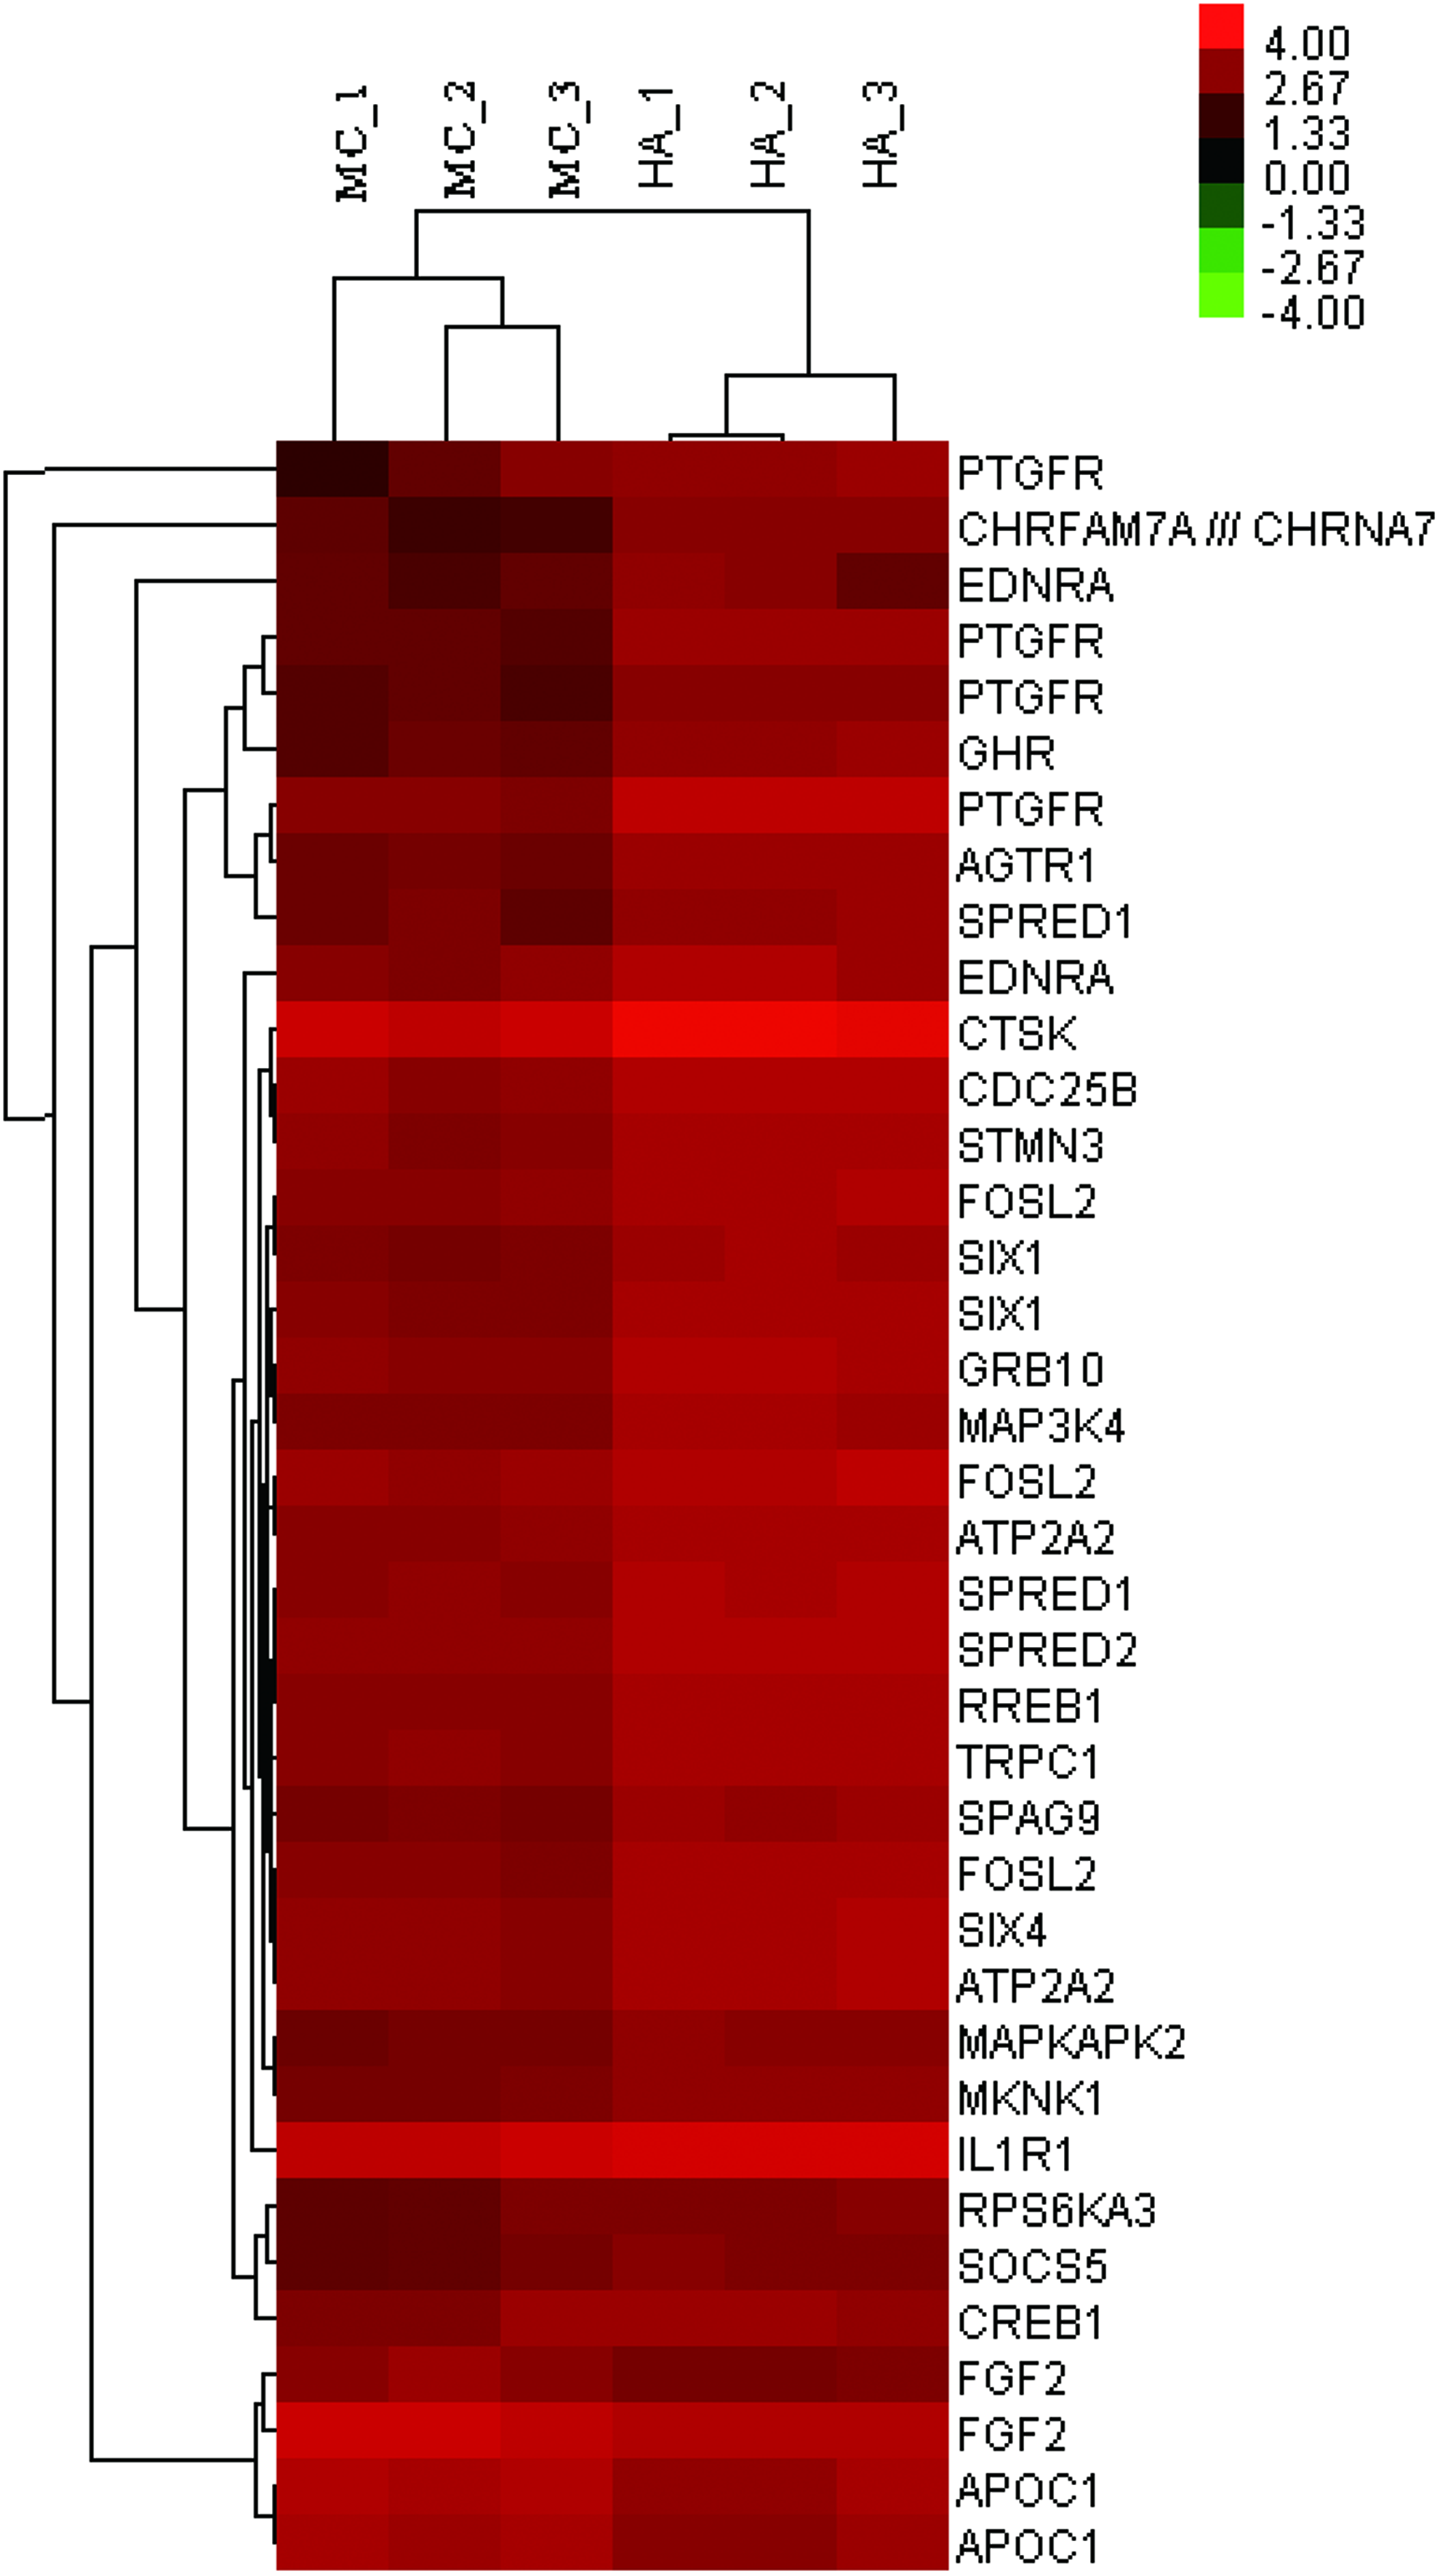
Visual display of the cluster analysis for the MC group compared with the HA group. Color images available online at www.liebertpub.com/tea
FGF2, a signal molecule of the fibroblast growth factor (FGF) family, was significantly increased (Fig. 9). FGF2 has been shown to accelerate fracture healing in mice. 36 Similarly, EDNRA, the endothelin receptor type A, was induced in the MC and HA groups. Endothelin-1(ET-1) signaling is important for postnatal bone formation. ET-1 promotes osteoblast proliferation, survival, and differentiation in vitro. 37 Moreover, deletion of endothelin receptor type A in osteoblast resulted in impaired osteoblast differentiation and bone formation. 37
Growth hormone (GH) is known to promote anabolic bone formation. The effect of GH on bones partly works through growth hormone receptor (GHR) expressed in osteoblasts. 38 Indeed, GHR is critical to mediate pro-proliferation and antiapoptotic functions of IGF-1 signals. 38 Interestingly, GHR is significantly upregulated in the MC and HA groups, implying a role of local GH signaling in MC-induced osteoblast differentiation.
FOSL2, a Fos-related transcriptional factor of the AP-1 family, is a positive regulator of osteoblast differentiation and collagen synthesis. 39 FOSL2 was significantly upregulated in the MC group, suggesting that FOSL2 plays an important role in MC-induced osteoblastogenesis and matrix synthesis.
In summary, MC promoted osteoblast differentiation and function through regulating a network of osteogenic factors. Moreover, signaling pathways associated with cell adhesion were also triggered, for example, adherence junction pathway (Fig. 10).
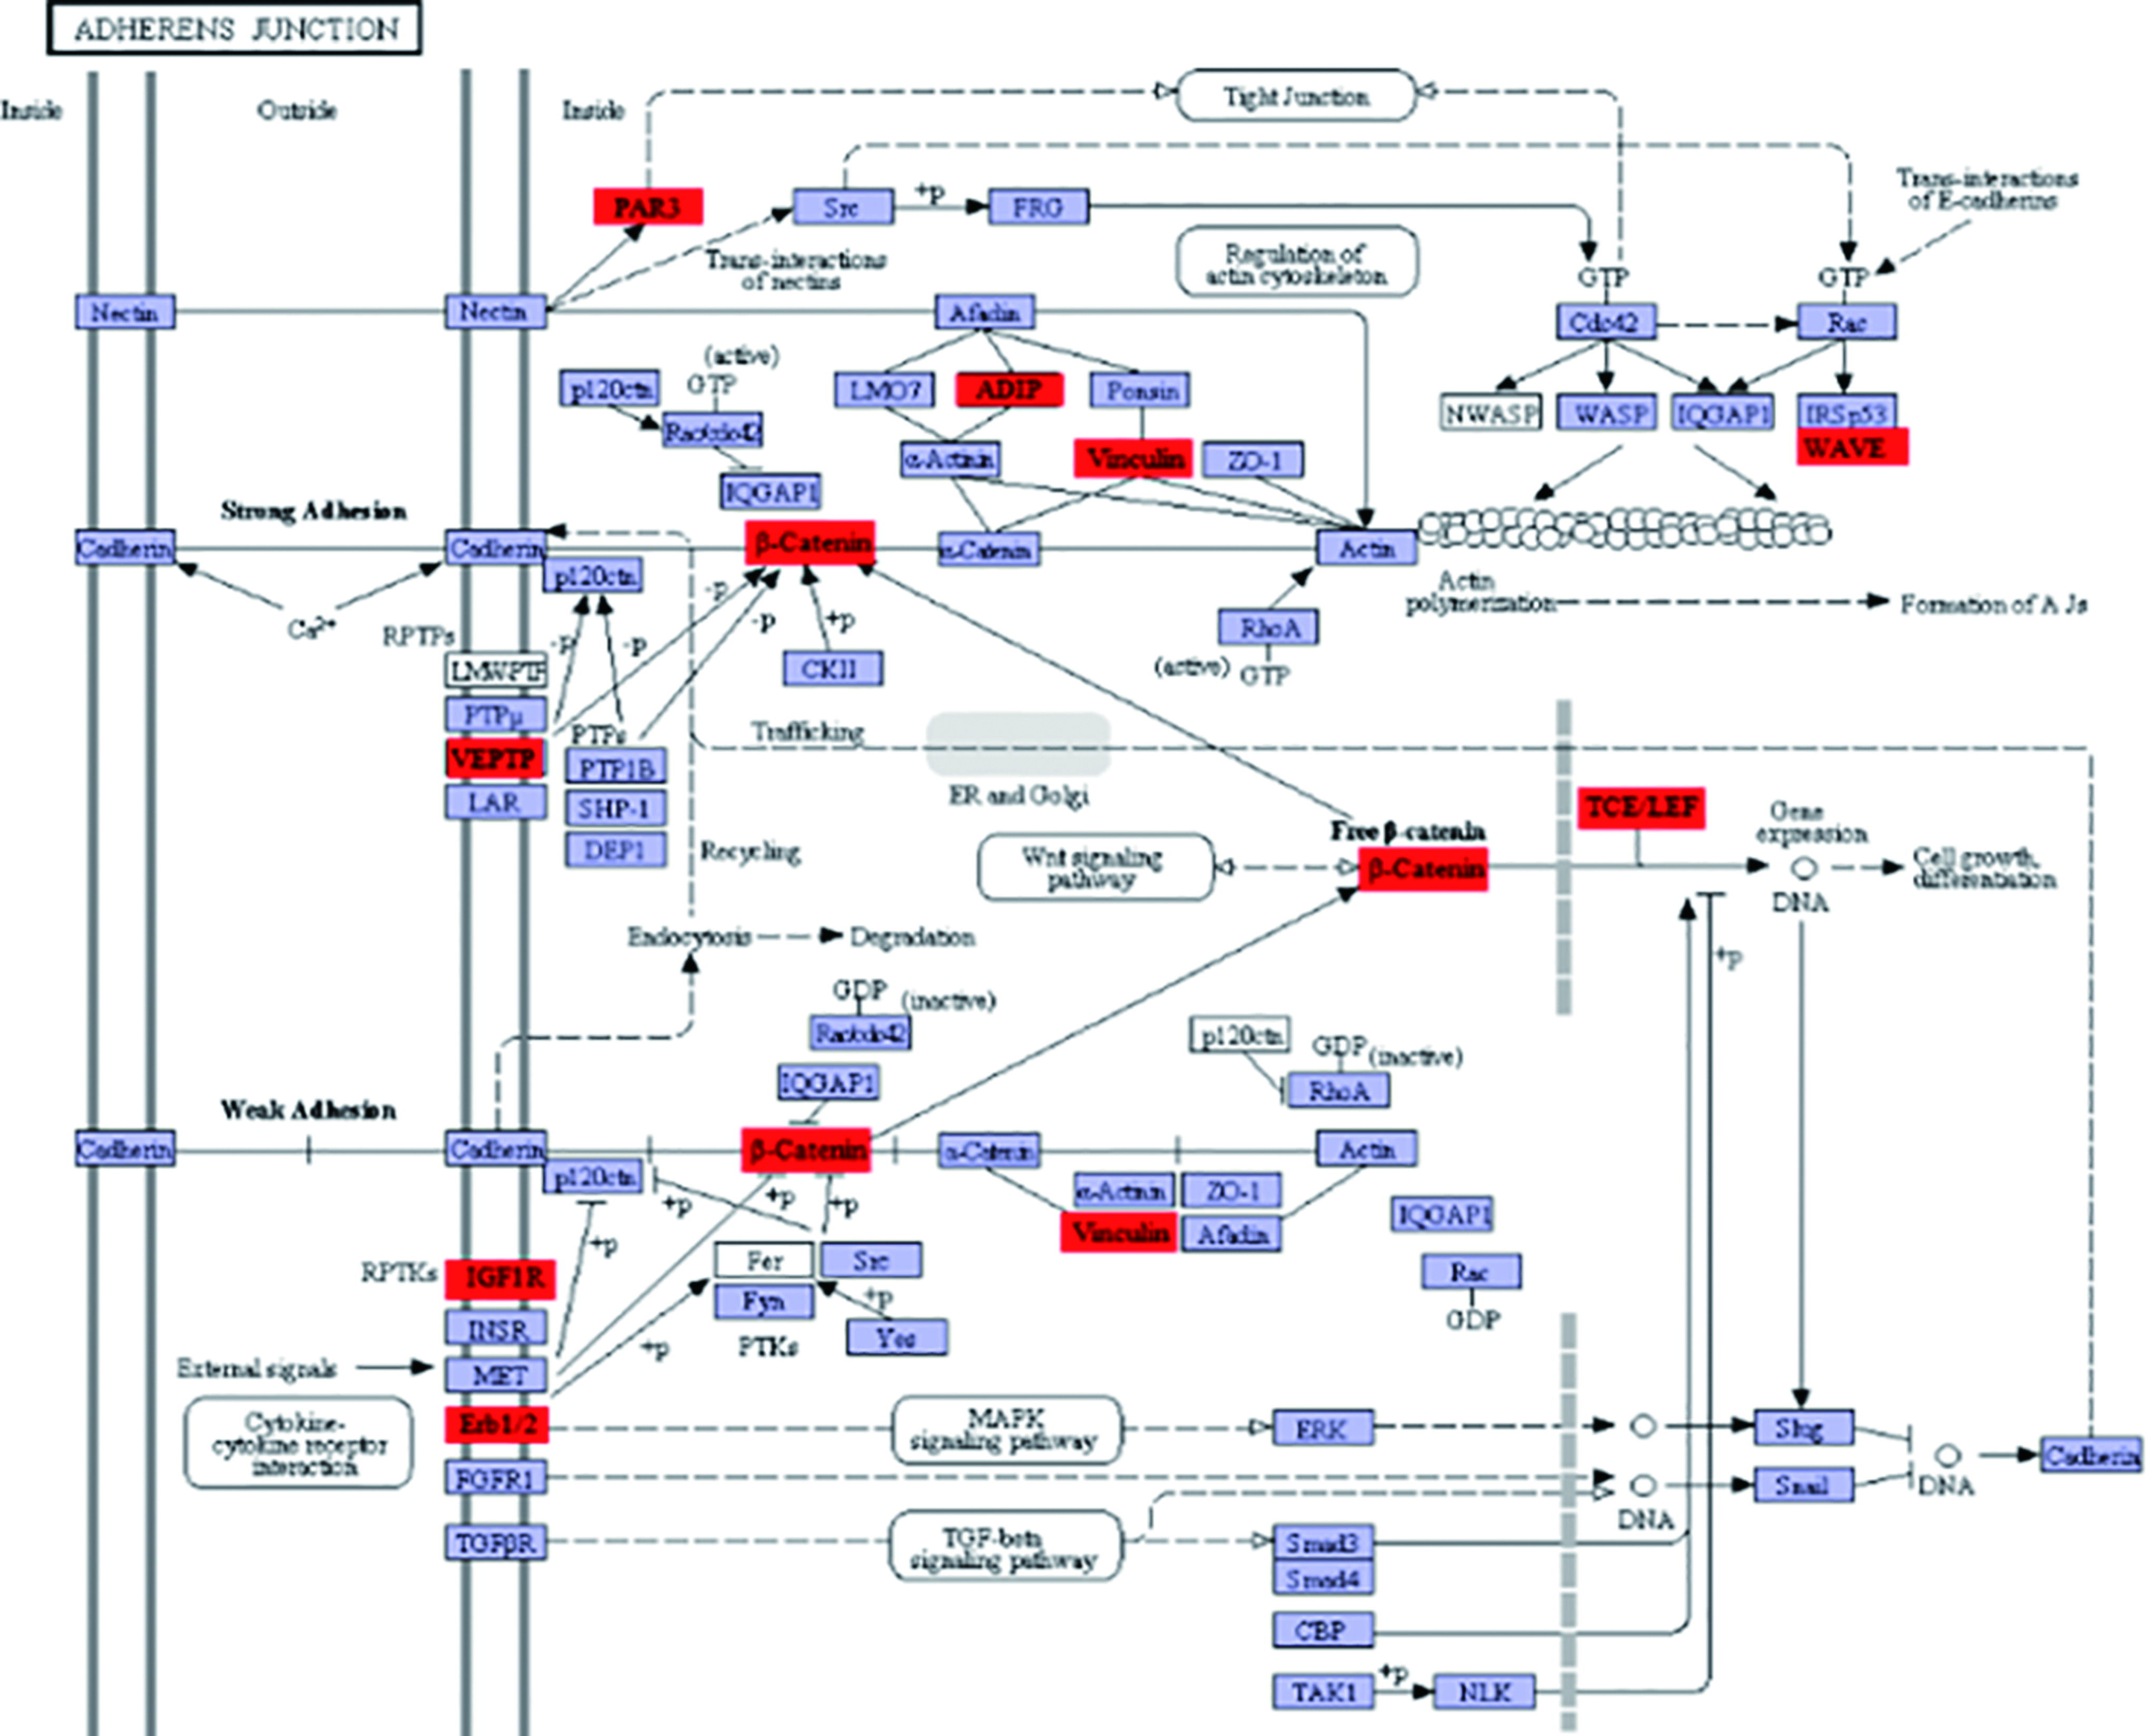
Upregulated expression in osteoblast differentiation pathway was assigned as red in the figure. The change of expression quantity refers to the MC group compared to the HA group. Color images available online at www.liebertpub.com/tea
Conclusion
The major finding of this study was that MC could promote osteogenic differentiation of hMSCs. Microarray analysis detected that MC was conducive to the expression of osteogenesis-associated genes, such as FGF2, GHR, FOSL2, BMP-2, and COL1A1, and was able to stimulate osteogenesis-associated pathways. Meanwhile, hMSCs could exhibit changed cell behaviors, including cell proliferation, adhesion, and apoptosis on different materials. The results would be helpful to understand the regulation effects of the MC on osteogenic differentiation of hMSCs and should be useful for the development of novel bone graft substitutes being able to regulate cell activities and fates.
Footnotes
Acknowledgments
This work was, in part, supported by the National Basic Research Program of China funded by the Ministry of Science and Technology of China (2011CB606205) and by the National Natural Science Fund funded by the National Natural Science Foundation of China (21371106, 51402167). The authors thank Prof. Dai Jian-Wu (State Key Laboratory of Molecular Developmental Biology, Institute of Genetics and Developmental Biology, Chinese Academy of Sciences) for technical assistance in cell culturing and related tests, Prof. Chen Jian-Quan (Orthopaedic Institute of Soochow University) for his helpful advice and suggestions, and Dr. Helen Cui for her native English revision.
Disclosure Statement
No competing financial interests exist.