
Abstract
Stem cell fate specification is known to be regulated by mechanical cues such as cell–cell interaction and the rigidity of the extracellular matrix (ECM). At present, spheroid cultures of stem cells are conventional starting materials to generate organoids with tissue-like structures. However, the influence of ECM rigidity on stem cell mechanobiology has only been briefly explored in in vitro three-dimensional (3D) cultures, which presents better physiological relevance than monolayer cultures. To investigate how ECM rigidity acts on neural stem cells (NSCs) to drive specific biological processes, we performed live 3D-imaging on neurospheres in medium, in 1% and 1.5% agarose gel-medium matrix. In this study, we also report a novel method of 3D spheroid expansion stress quantification. Our results revealed that neurospheres in stiffer ECM exhibited higher stem cell ratio than those in medium. Moreover, we observed a negative correlation between the signal intensity of the NSC marker, SSEA-1 (CD15), and mean stresses exerted by the cell. This observation is implicative of a sparse actomyosin network in NSCs than nonstem cells. Based on these results, we propose that enrichment of NSCs or directed differentiation may be carried out by tailoring ECM rigidity and possibly its composition.
Impact Statement
Neural stem cells (NCSs) are integral to establishing in vitro models and regenerative medicine. To this day, there is an unmet need to enrich these cells from a heterogeneous cell population for clinical applications without irreversible manipulation. We identified a method to propagate human NCSs via computational analysis of their mechanical signature. In this study, we report a novel analytical method for mechanical forces in three-dimensional cultures. Further, our results revealed that stemness may, in part, be mediated by physical properties of the extracellular matrix. In conclusion, our findings have potential implications in understanding stem cell mechanobiology for enrichment or differentiation.
Introduction
Stem cell proliferation and differentiation are known to be partly driven by mechanical forces via cell–cell and cell–matrix interactions, which is crucial for developing in vitro three-dimensional (3D) models and for regenerative medicine. The increasing use of spheroids and organoids generated from stem cells in basic research has led to better understanding of self-organization, cell migration in development, and even diseases.1,2 However, long-term viability of stem cell-derived spheroids or organoids is limited by a lack of an intermittent assessment to trace cell identity without sacrificing the specimens at endpoints, followed by conventional labor-intensive sample processing. Hence, a method by which cells can be quickly characterized relies on physical properties such as mechanical signatures of cells. In addition, it is proven that understanding unique mechanical signatures of stem cell processes may be applied to improving directed differentiation of stem cells in 3D by recapitulating the mechanical properties of the microenvironment in native tissue.3,4 Thus, directed differentiation of neural cells in 3D cultures by fine-tuning ECM mechanical properties may be more efficient than the use of growth factors alone.5–8
The dependence of lineage specification during neurodevelopment on mechanical force cell migration was reported in an observation of neural stem cell (NCS) migration and responses to varied ECM properties using traction force microscopy to quantify stresses, shear, and compression.9,10 A study conducted by Shi et al. in 2009 reported that mouse NSC-generated stresses decreased with differentiation due to a loss of sensitivity to substrate rigidity. 11 By now, the mechanical properties of the ECM have been demonstrated to regulate morphology, motility, and cell signaling.5,12–14 In 2014, Pathak et al. on human neural progenitors identified that differential applied cellular stresses directed lineage specification of NCS via stretch-activated ion channels. 15 Together, these studies presented a potential to manipulate the ECM for propagation of NSCs and directed differentiation for modeling or clinical applications. However, the study of NSC mechanobiology using two-dimensional gels inadequately addresses the combinatorial effect of cell–cell and cell–matrix interactions, which native NSCs are subjected to. 16 To date, the relationship between such mechanical forces in the ECM and the mechanism by which stem cell activity is regulated in 3D remains a brief venture.
Force quantification of 3D cultures is dominated by measurement of displacement of beads embedded in gels as a consequence of cell-generated forces. 17 The spatiotemporal resolution of bead displacement in 3D depends on advanced microscopes and substantial computational resources. At present, there are a limited number of methods quantifying 3D force generation of individual cells within a population.18,19 Further, little has been explored on algorithms quantifying forces in 3D. Here, we aimed at generating a method for the quantitative analysis of cell-generated forces in a multicellular structure at single-cell resolution.
Based on the principle that NSC proliferation and differentiation can be modulated by ECM rigidity, we aimed at recapitulating the phenomenon in 3D by immobilizing spheroids in a tunable gel. Agarose was used as our 3D gel platform for cell culture. Previous groups had grown neurospheres in agarose gels. 20 Unlike collagen or Matrigel, agarose gels are not degraded by metalloproteases and other enzymes secreted by cells and maintain their mechanical integrity through multi-day cell culture, enabling the consistent tracking of bead displacement in the gels. 21 We hypothesized that NSCs and nonstem cells exhibit different mechanical signatures in gels of varied rigidity. To investigate cell-generated forces in 3D, the displacement of beads, fluorescent signals targeted to cell nuclei and membrane were analyzed. This article reports a novel 3D force quantification method of individual cells in spheroids. Specifically, we correlated gel rigidity and cell-generated forces with NSC stemness, as indicated with the stem-cell marker SSEA-1 or CD15. CD15 refers to 3-fucosyl-N-acetyle-lactosamine, which is a carbohydrate epitope associated with NSC migration and neurogenesis.22,23 Previous research on NSCs showed that expression of CD15 alone is sufficient to identify NSCs. 24 A prolonged timescale of culture was carried out to validate differential mechanical signatures of cells in the neurospheres. Further, neurospheres with CD15+ cells were co-labeled for myosin light chain to investigate cortical cytoskeletal network organization in response to different ECM rigidity.
Materials and Methods
Medium and cell culture
NSCs were derived as described.
25
The NSCs were cultured in neurobasal medium supplemented with 1 ×
Immunohistochemistry of live and fixed cells
Day 4–5 neurospheres were harvested and incubated in medium containing Hoechst 33342 (Life Technologies) at 1 μg/mL and CD15 antibody at 1:10 dilution (Miltenyi Biotec). The mix was incubated at 37°C, 5% CO2 for 30 min. After two washes with fresh NSC medium, the neurospheres were seeded onto a glass-bottomed well plate (Cellvis) for imaging.
Neurospheres were fixed in 4% paraformaldehyde for 20 min at room temperature. They were washed with 1 × phosphate-balanced solution (PBS; Life Technologies) and permeabilized with 0.25% Triton X-100 (Sigma) for 5 min at room temperature. After two PBS washes, the neurospheres were incubated in 10% goat serum (Life Technologies) for 1 h at room temperature. Next, the neurospheres were incubated in PBS containing CD15-antibody (Miltenyi Biotec) at 1:10 and anti-phosphorylated myosin light chain (anti-pMLC) antibody (#3671; Cell Signalling Technology) at 1:50 at 4°C, overnight. They were then washed with PBS thrice and incubated in PBS containing goat anti-rabbit Alexa 568 (Life Technologies) at 1:1000 and Hoechst 33342 at 1 μg/mL for 1 h at room temperature. After a 10-min wash and two 5-min washes, the neurospheres were imaged.
Sample preparation and confocal imaging
The live-labeled neurospheres were mixed in NSC medium containing 16% 0.5 μm Fluoresbrite carboxylate microspheres in 641 nm (Polysciences). This cell-bead mixture was then gently and quickly mixed with low gelling temperature agarose (Sigma) to generate final gel concentrations of 1% and 1.5% (w/v) with Young's modulus values of 13 and 30 kPa, respectively. 26
Immediately, 100 μL of the mixture was added to each well in a 96 glass-bottomed well plate with a 1.5 μm glass (Thermo Scientific Nunc). The samples were incubated for 5 min at room temperature, mounted onto the Olympus FV1000 inverted microscope, and imaged under a 20 × objective with long-working distance. Neurospheres were selected randomly, and a z-stack was acquired at two to three timepoints at a 10–15-min interval. Neurospheres embedded in the gel may be cultured up to a week with medium changes every other day.
Statistical analysis
The parametric Student's two-tailed t test (assuming unequal variances) was used to test the statistical significance of the data in Figures 1–5. The assumption of normality was considered to be sound because as the central limit theorem, sample means of moderately large samples are well approximated by a normal distribution. Differences between measurements were considered statistically significant at p < 0.05 and are denoted by an asterisk (*).
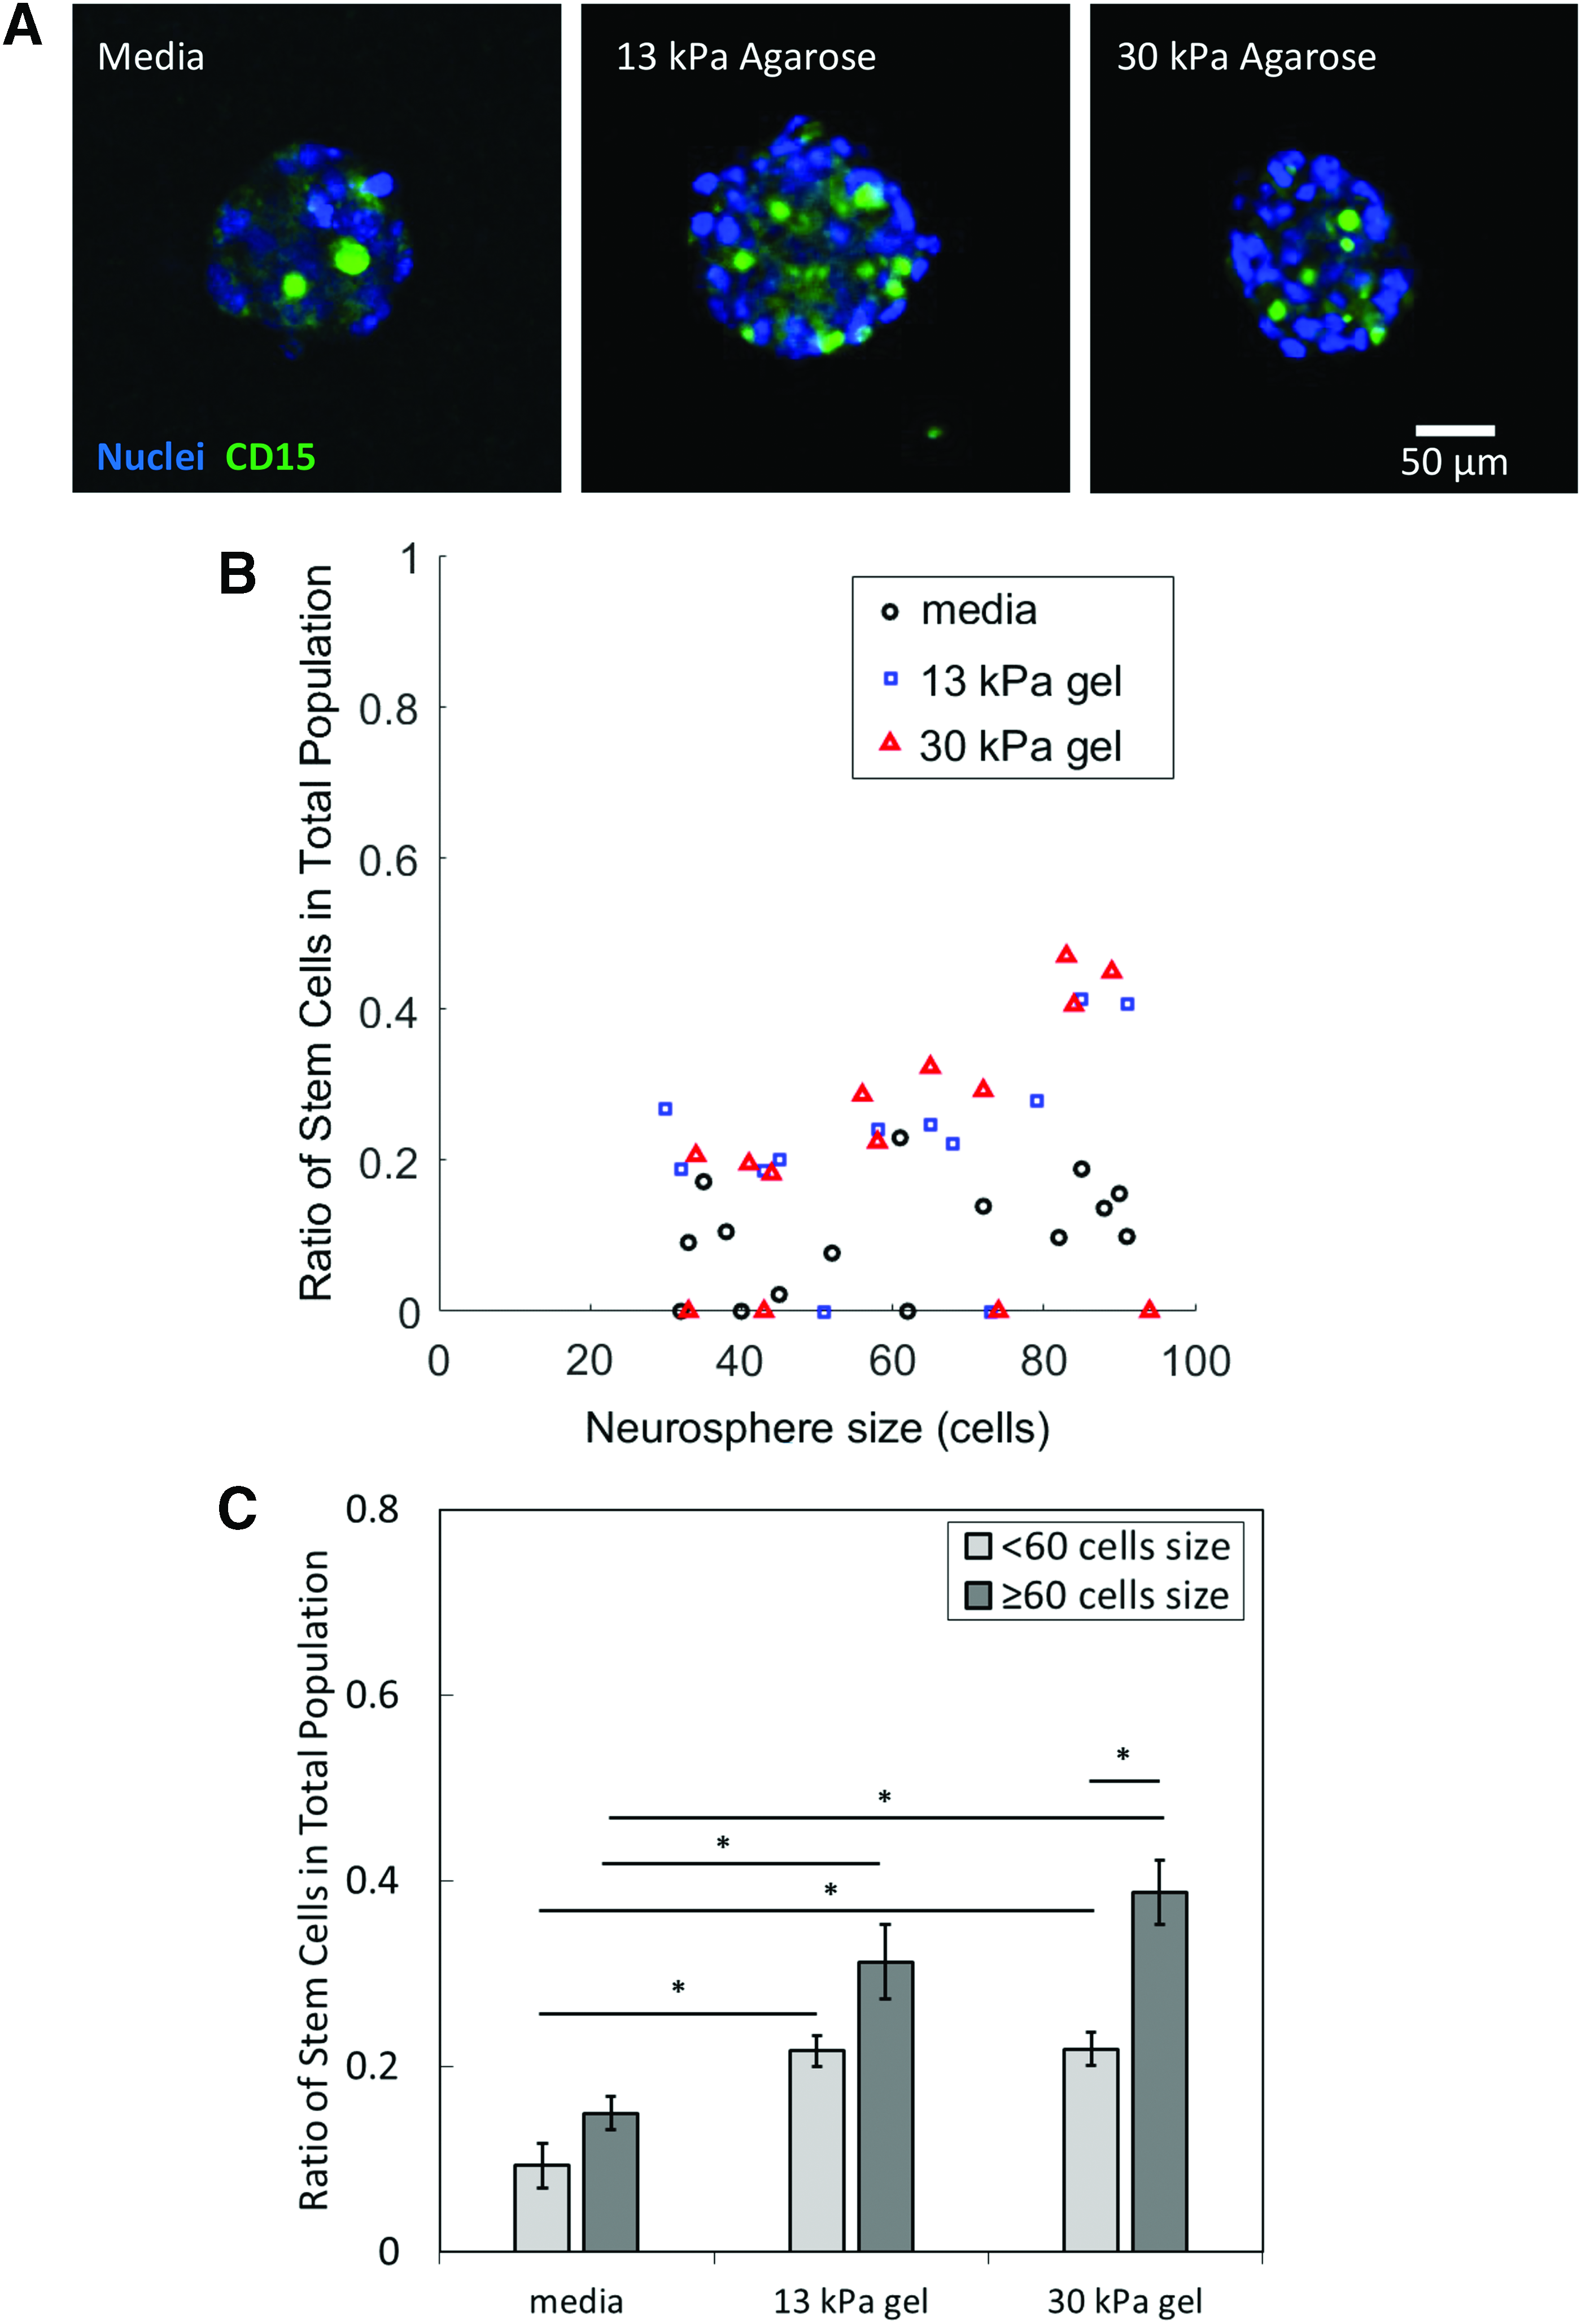
The ratio of stem cells in the total neurosphere cell population increases with environmental rigidity and neurosphere size.
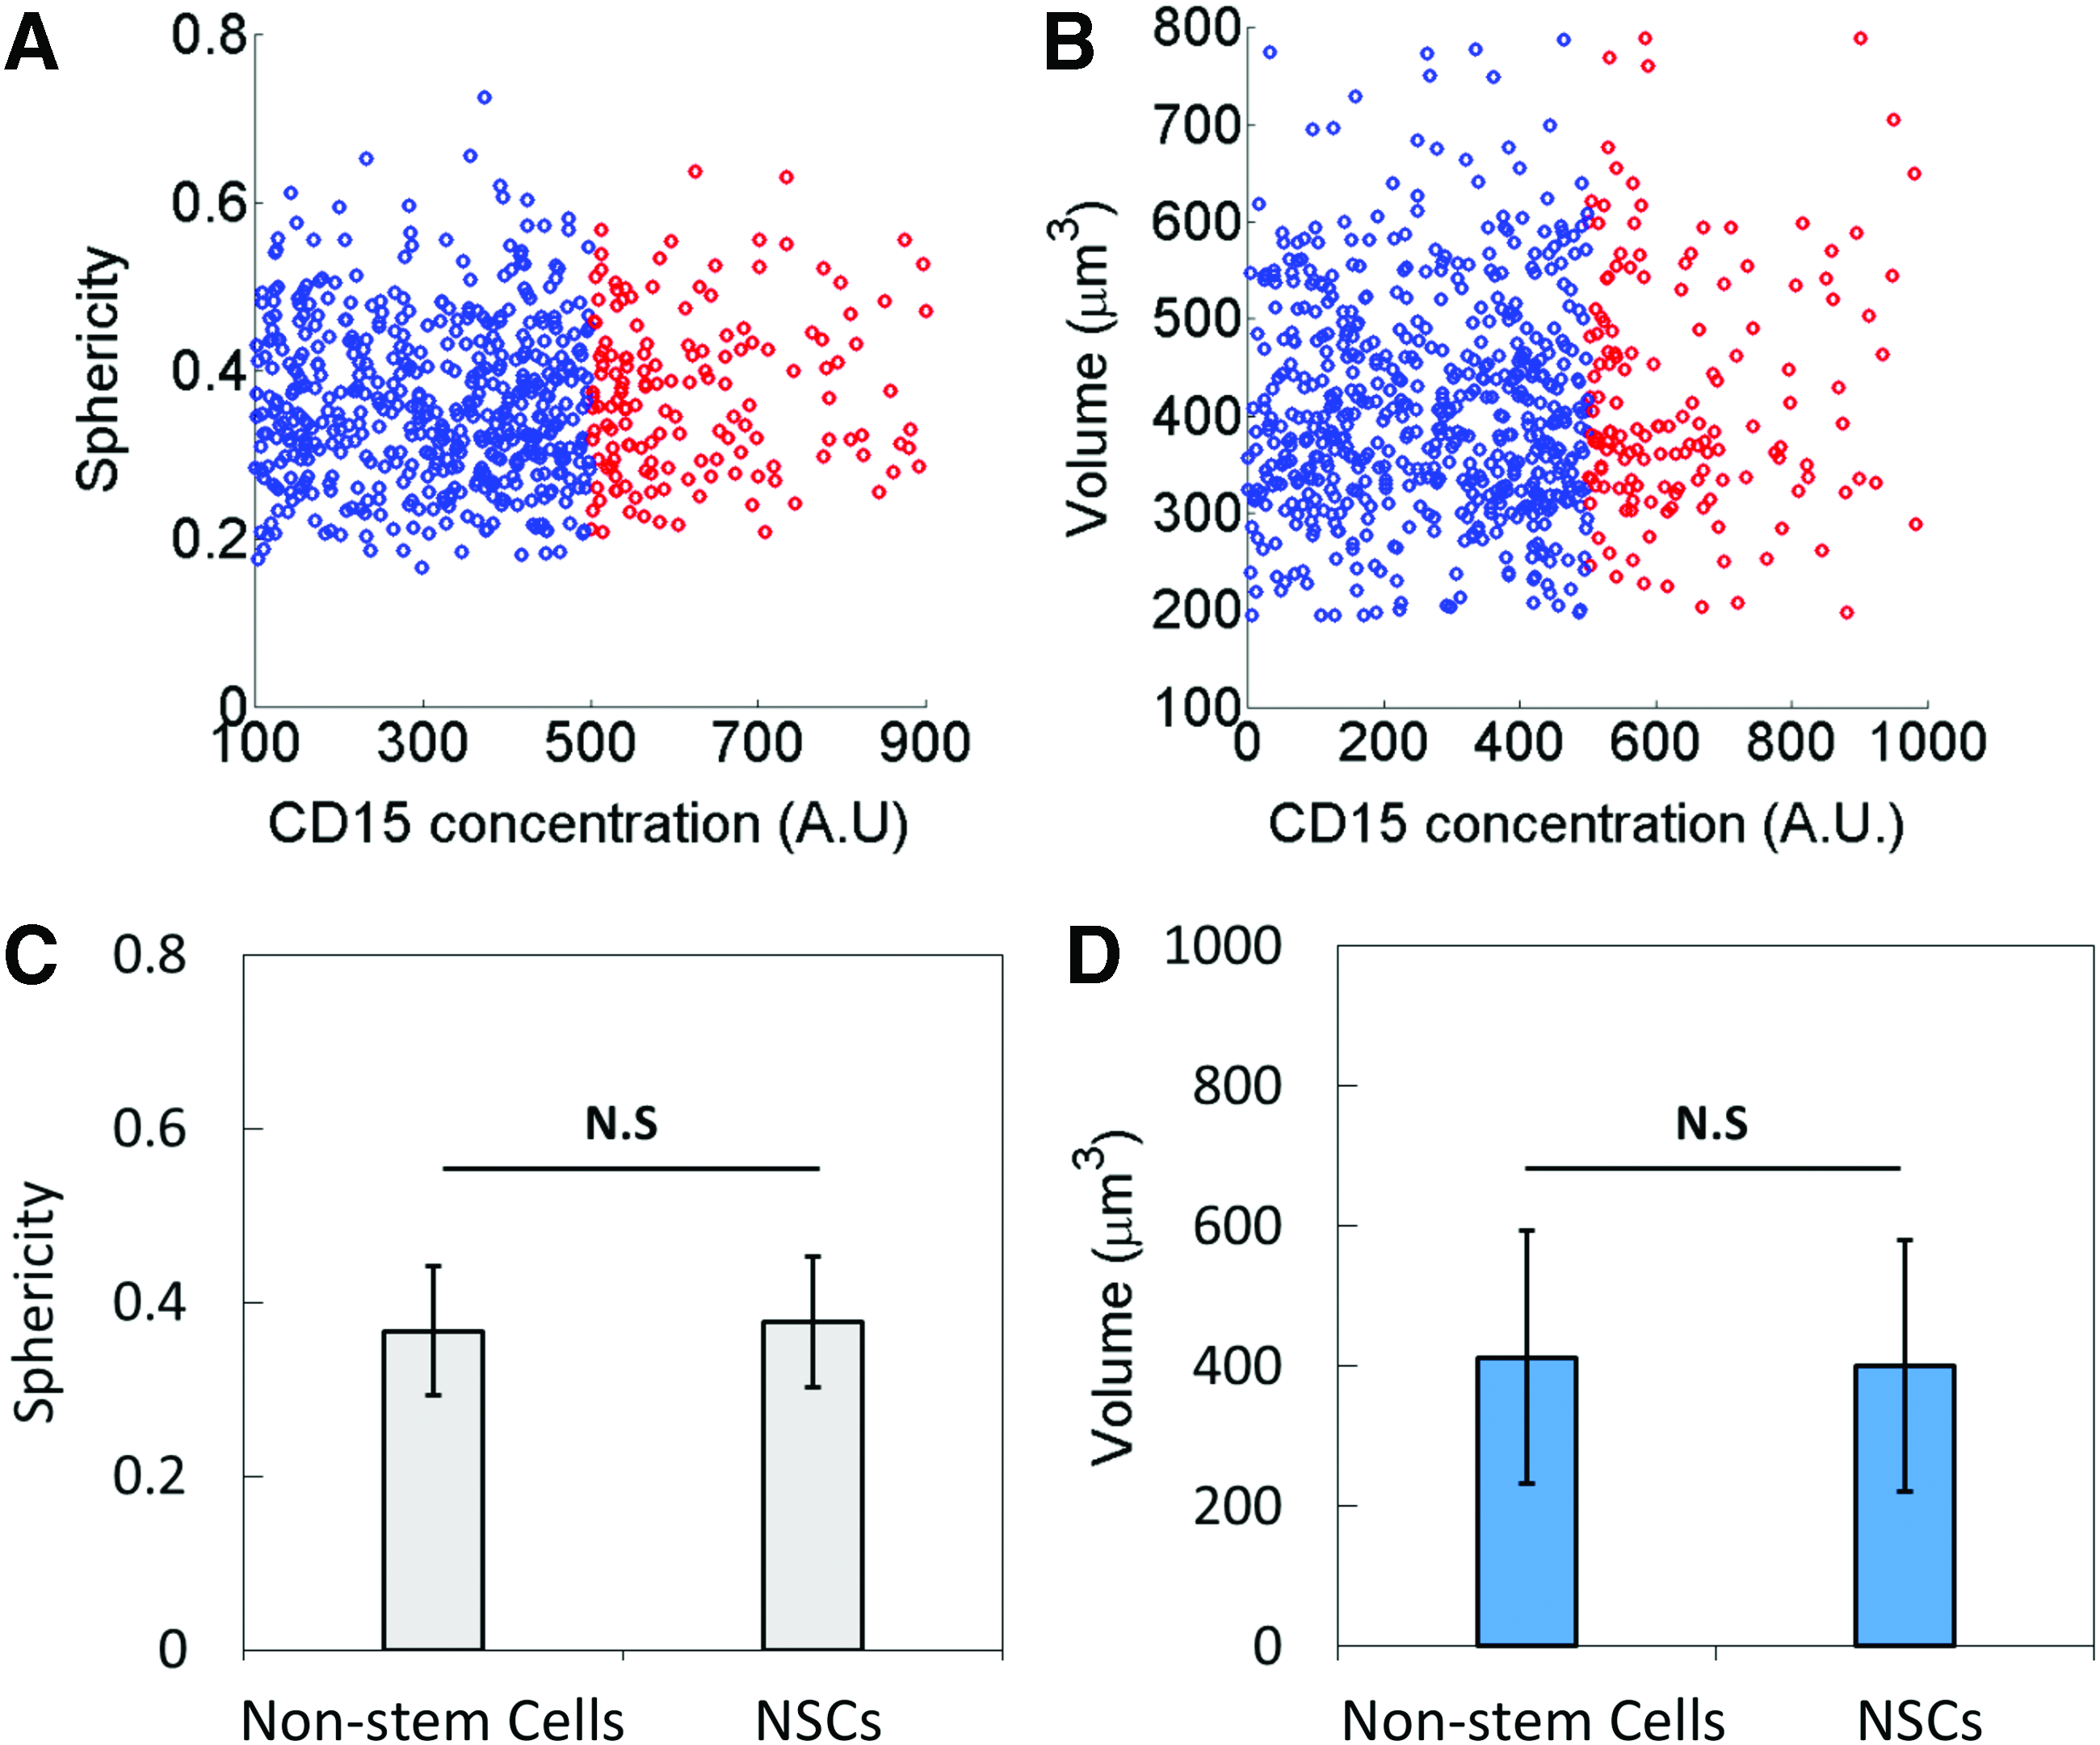
Nonstem cells and NSCs show no morphological difference. Plot of
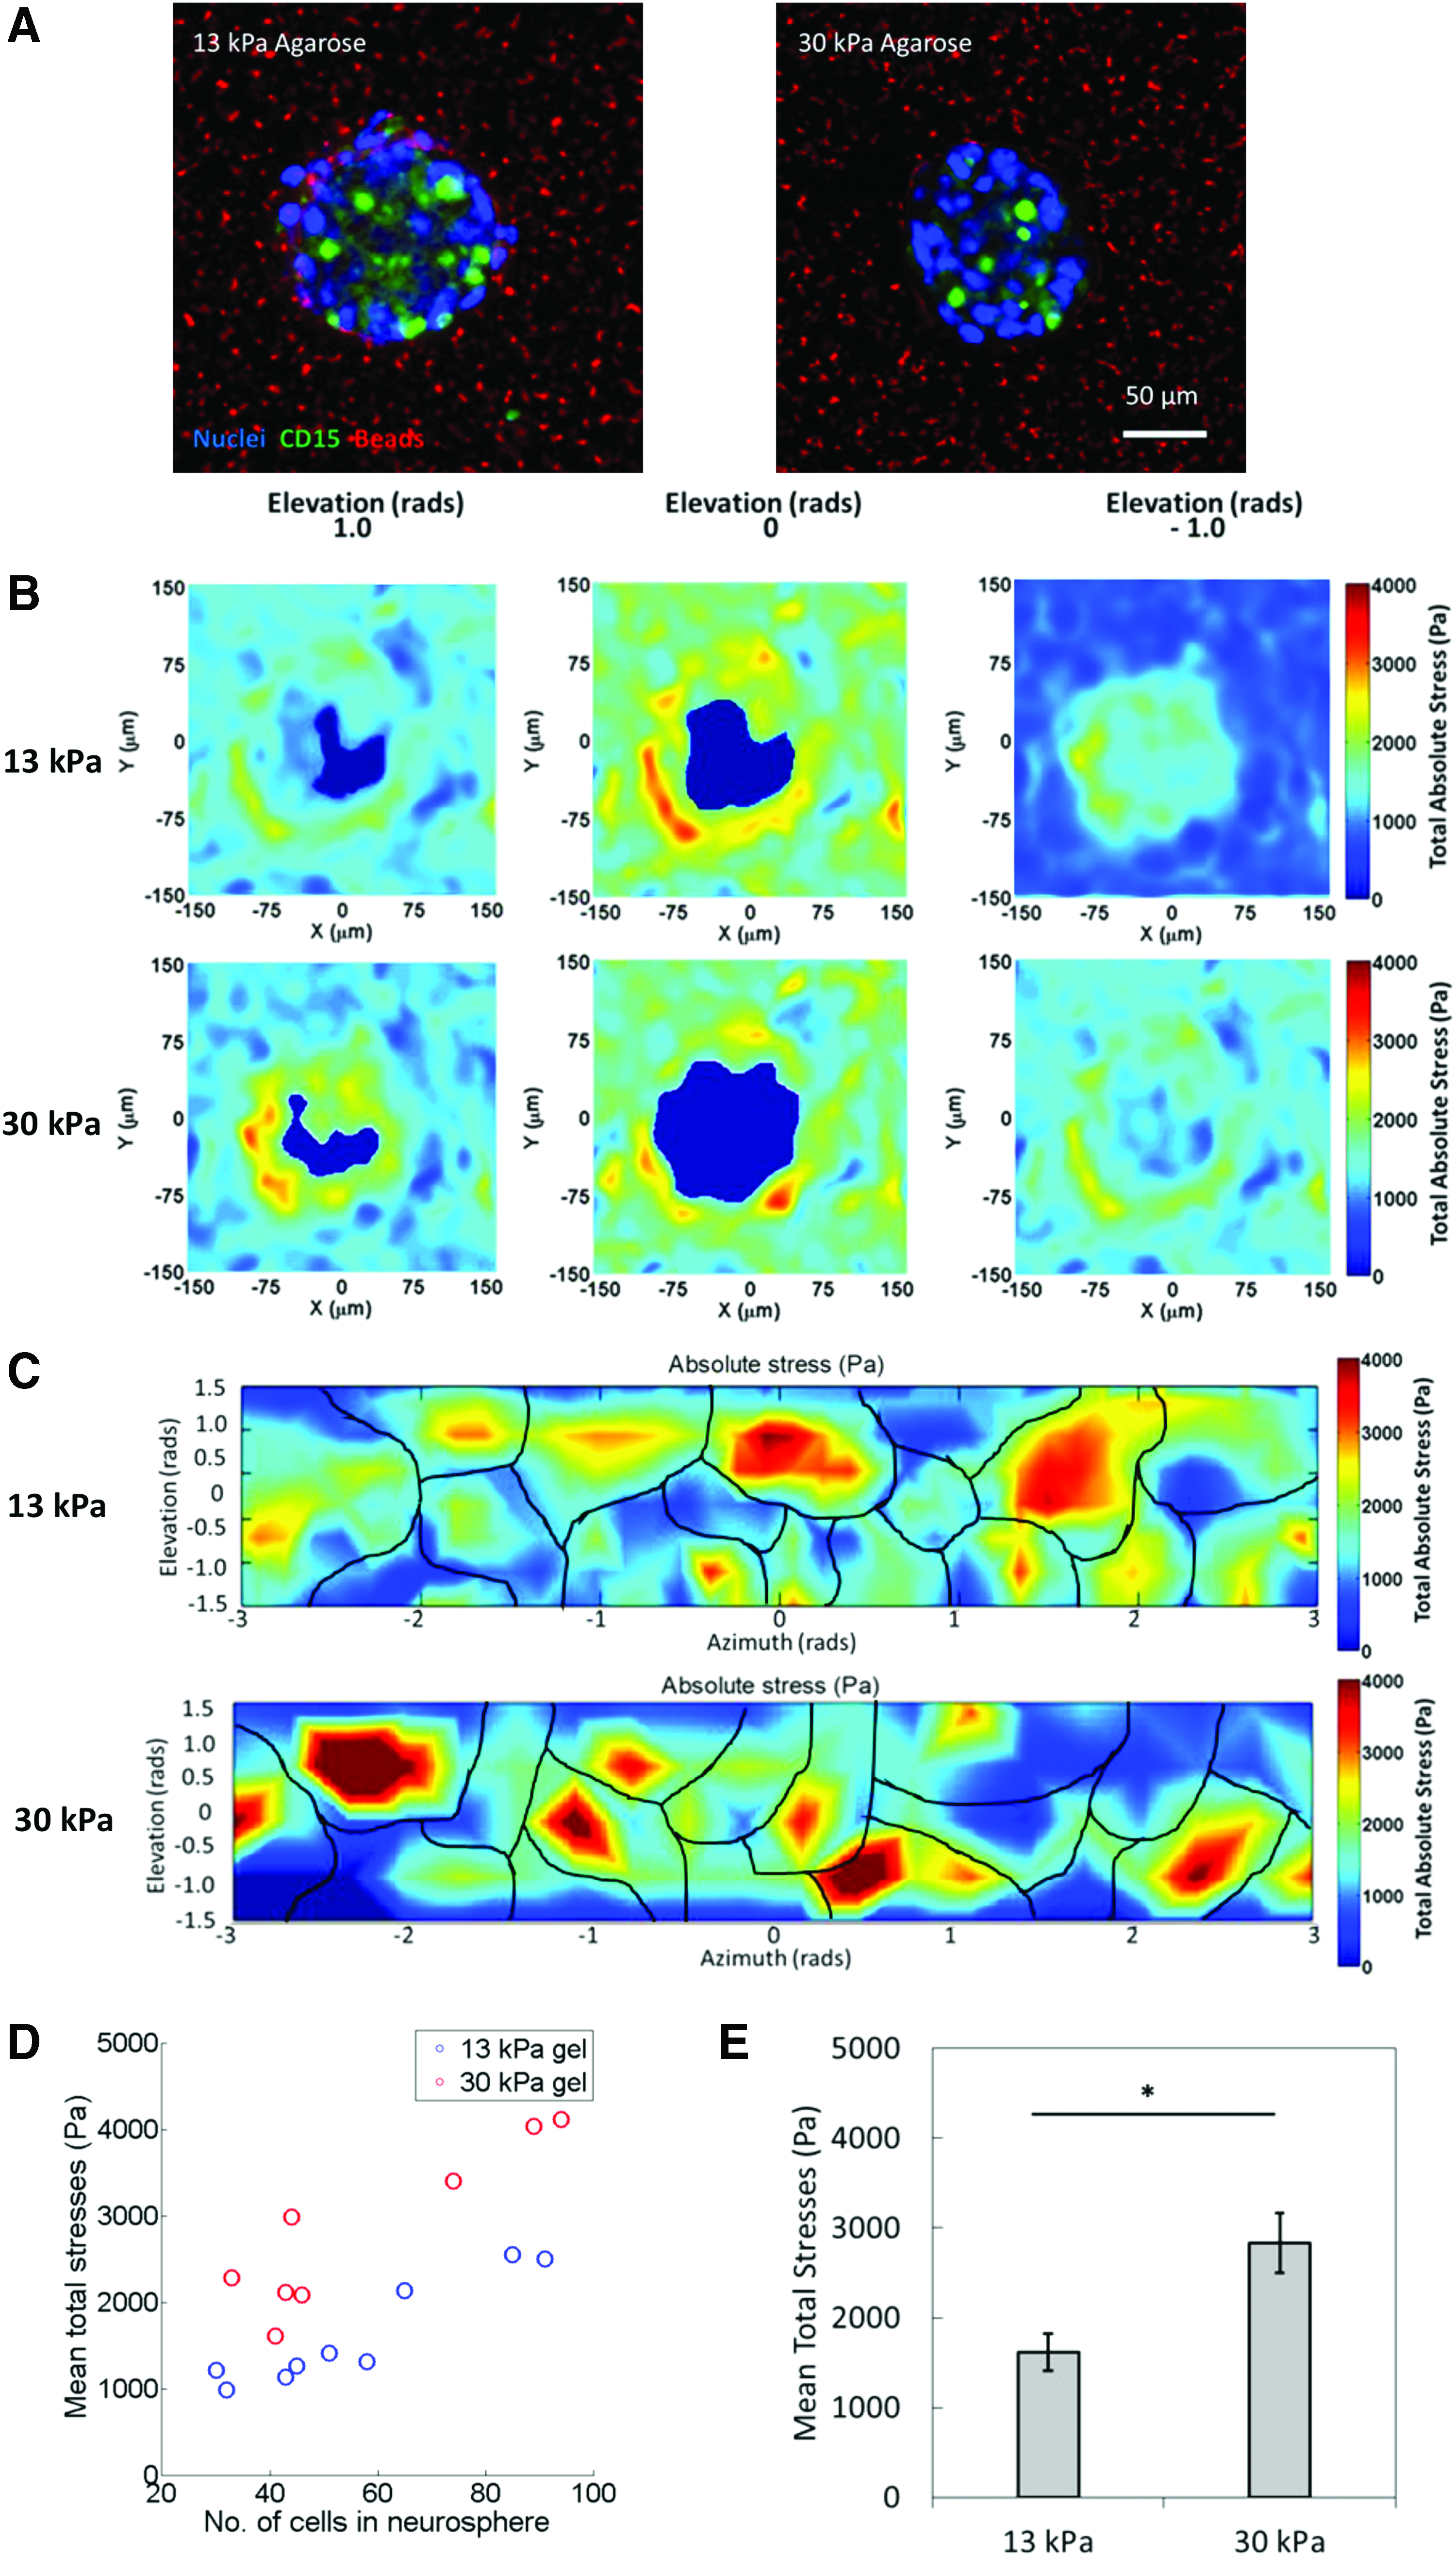
Mean 3D stresses exerted by neurospheres are dependent on neurosphere size and environmental rigidity.
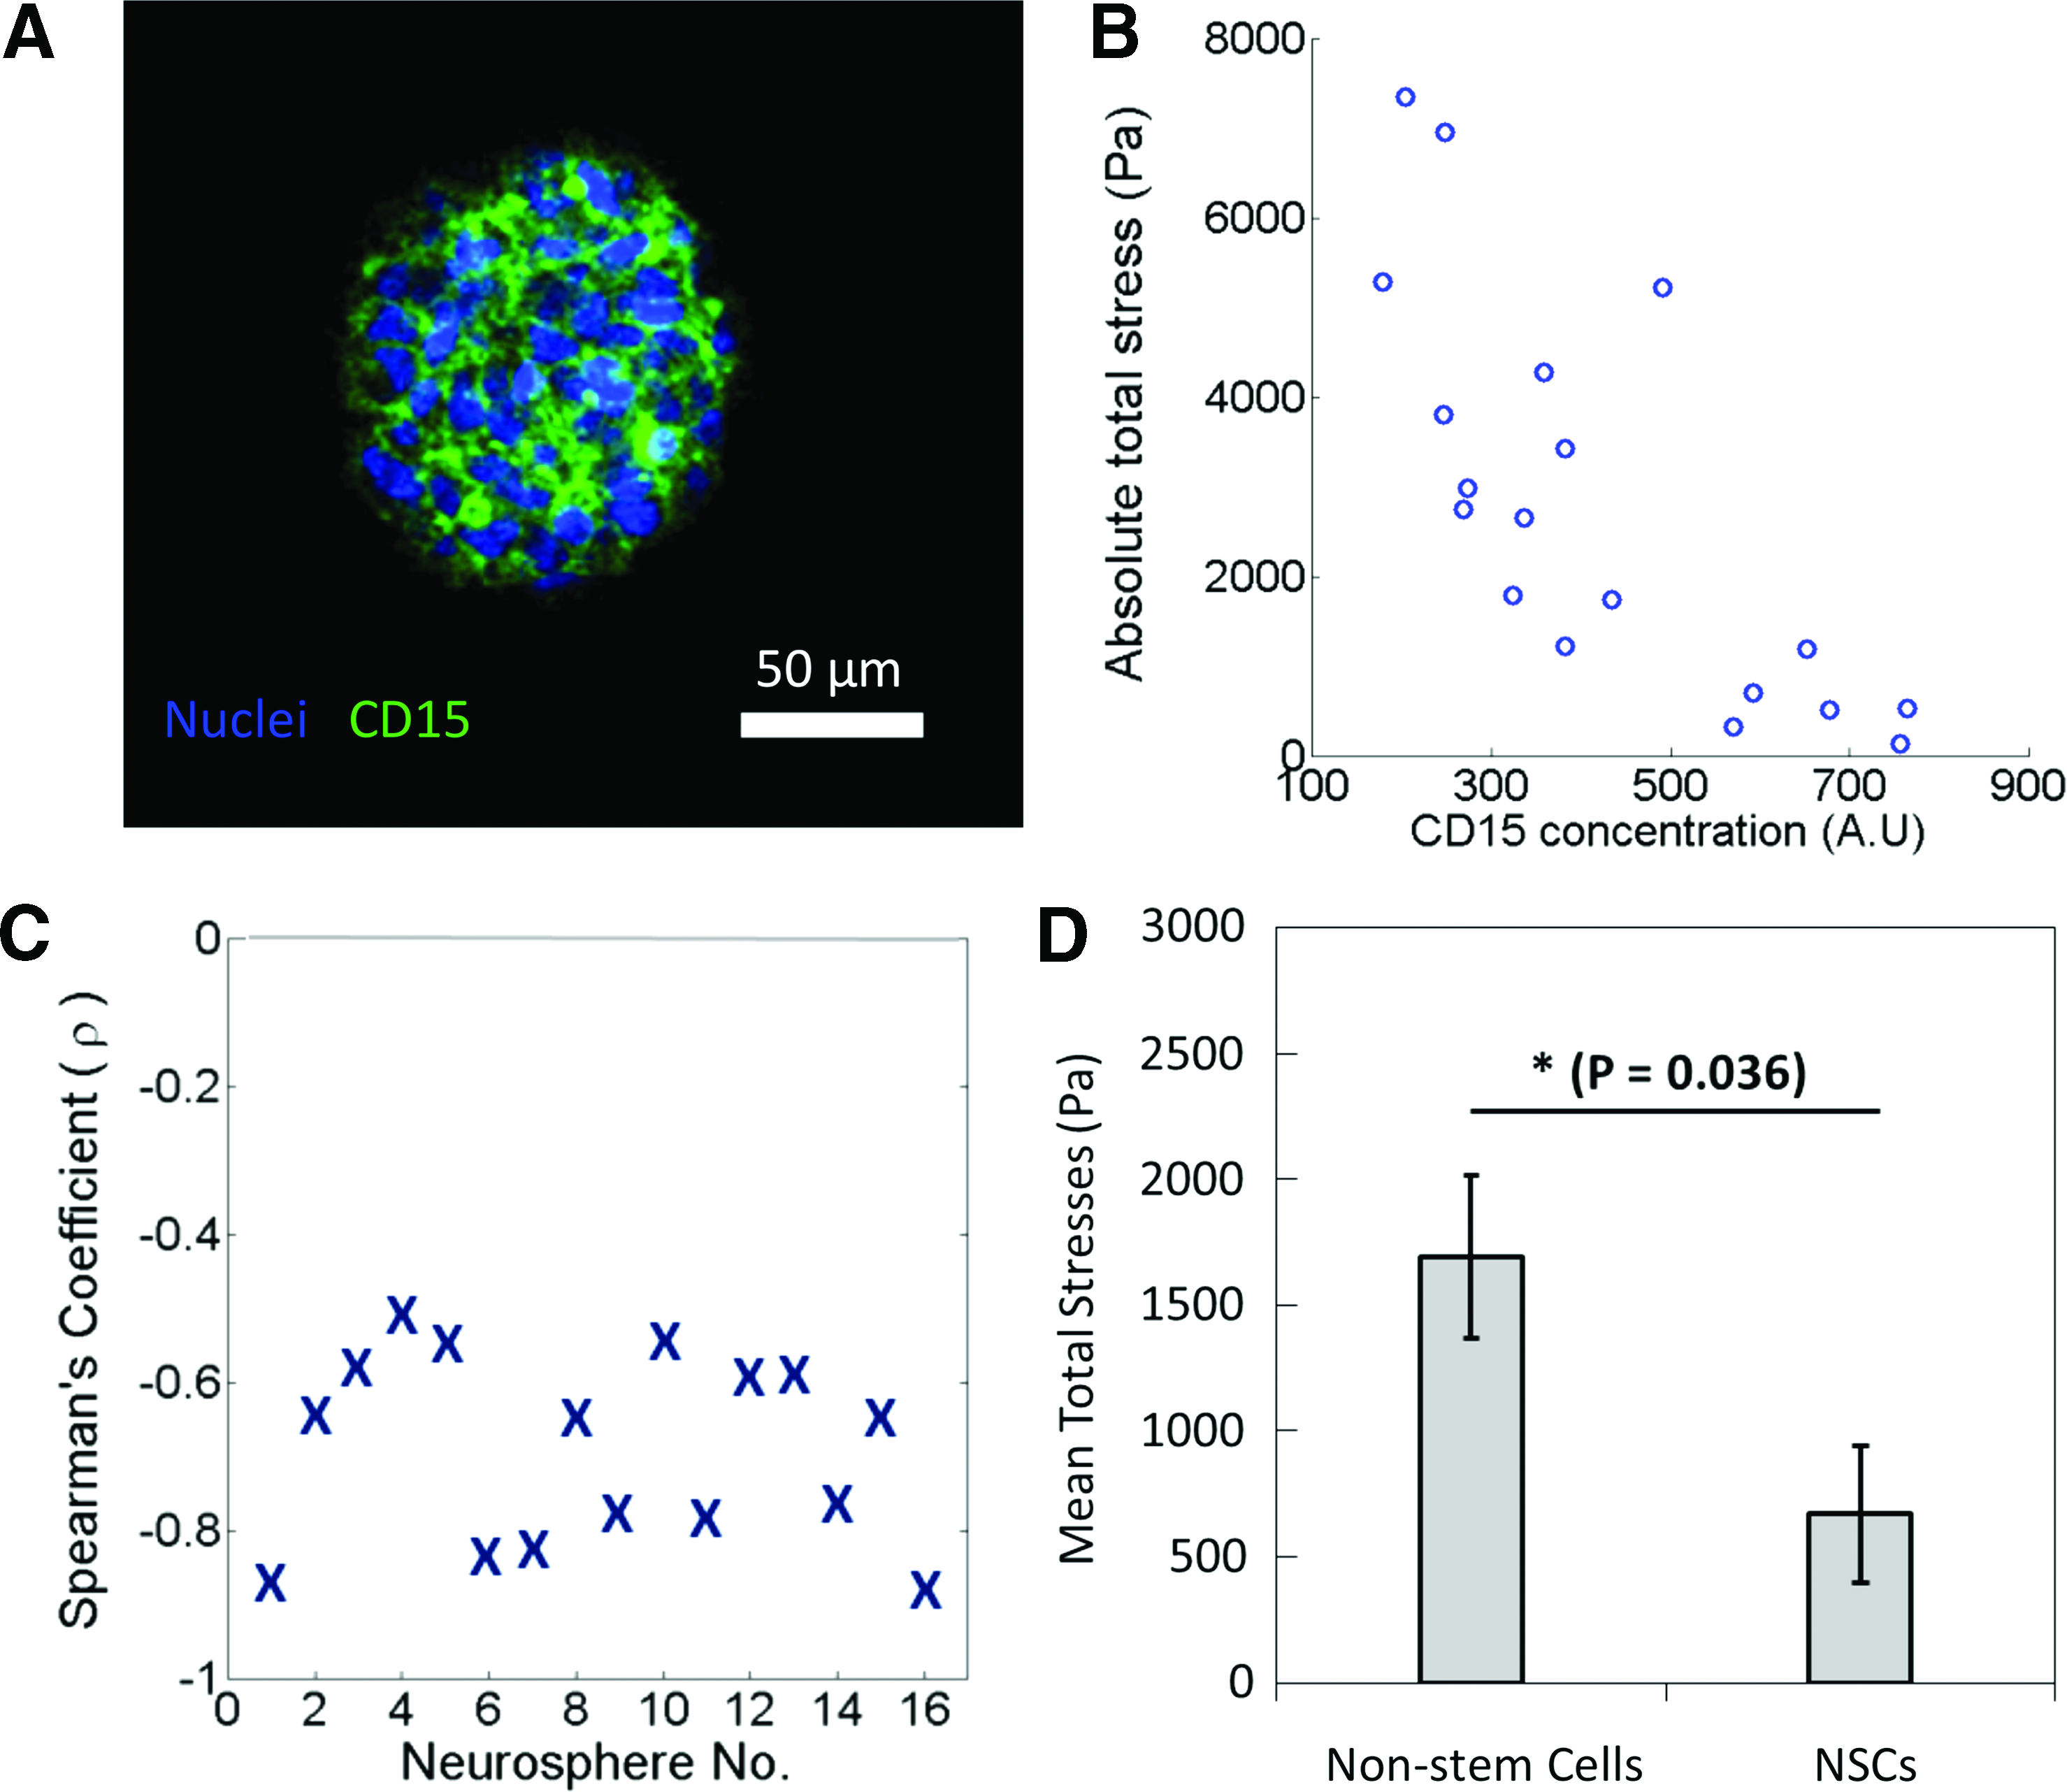
Negative correlation between total absolute stress exerted by cells and average cellular CD15 concentration.
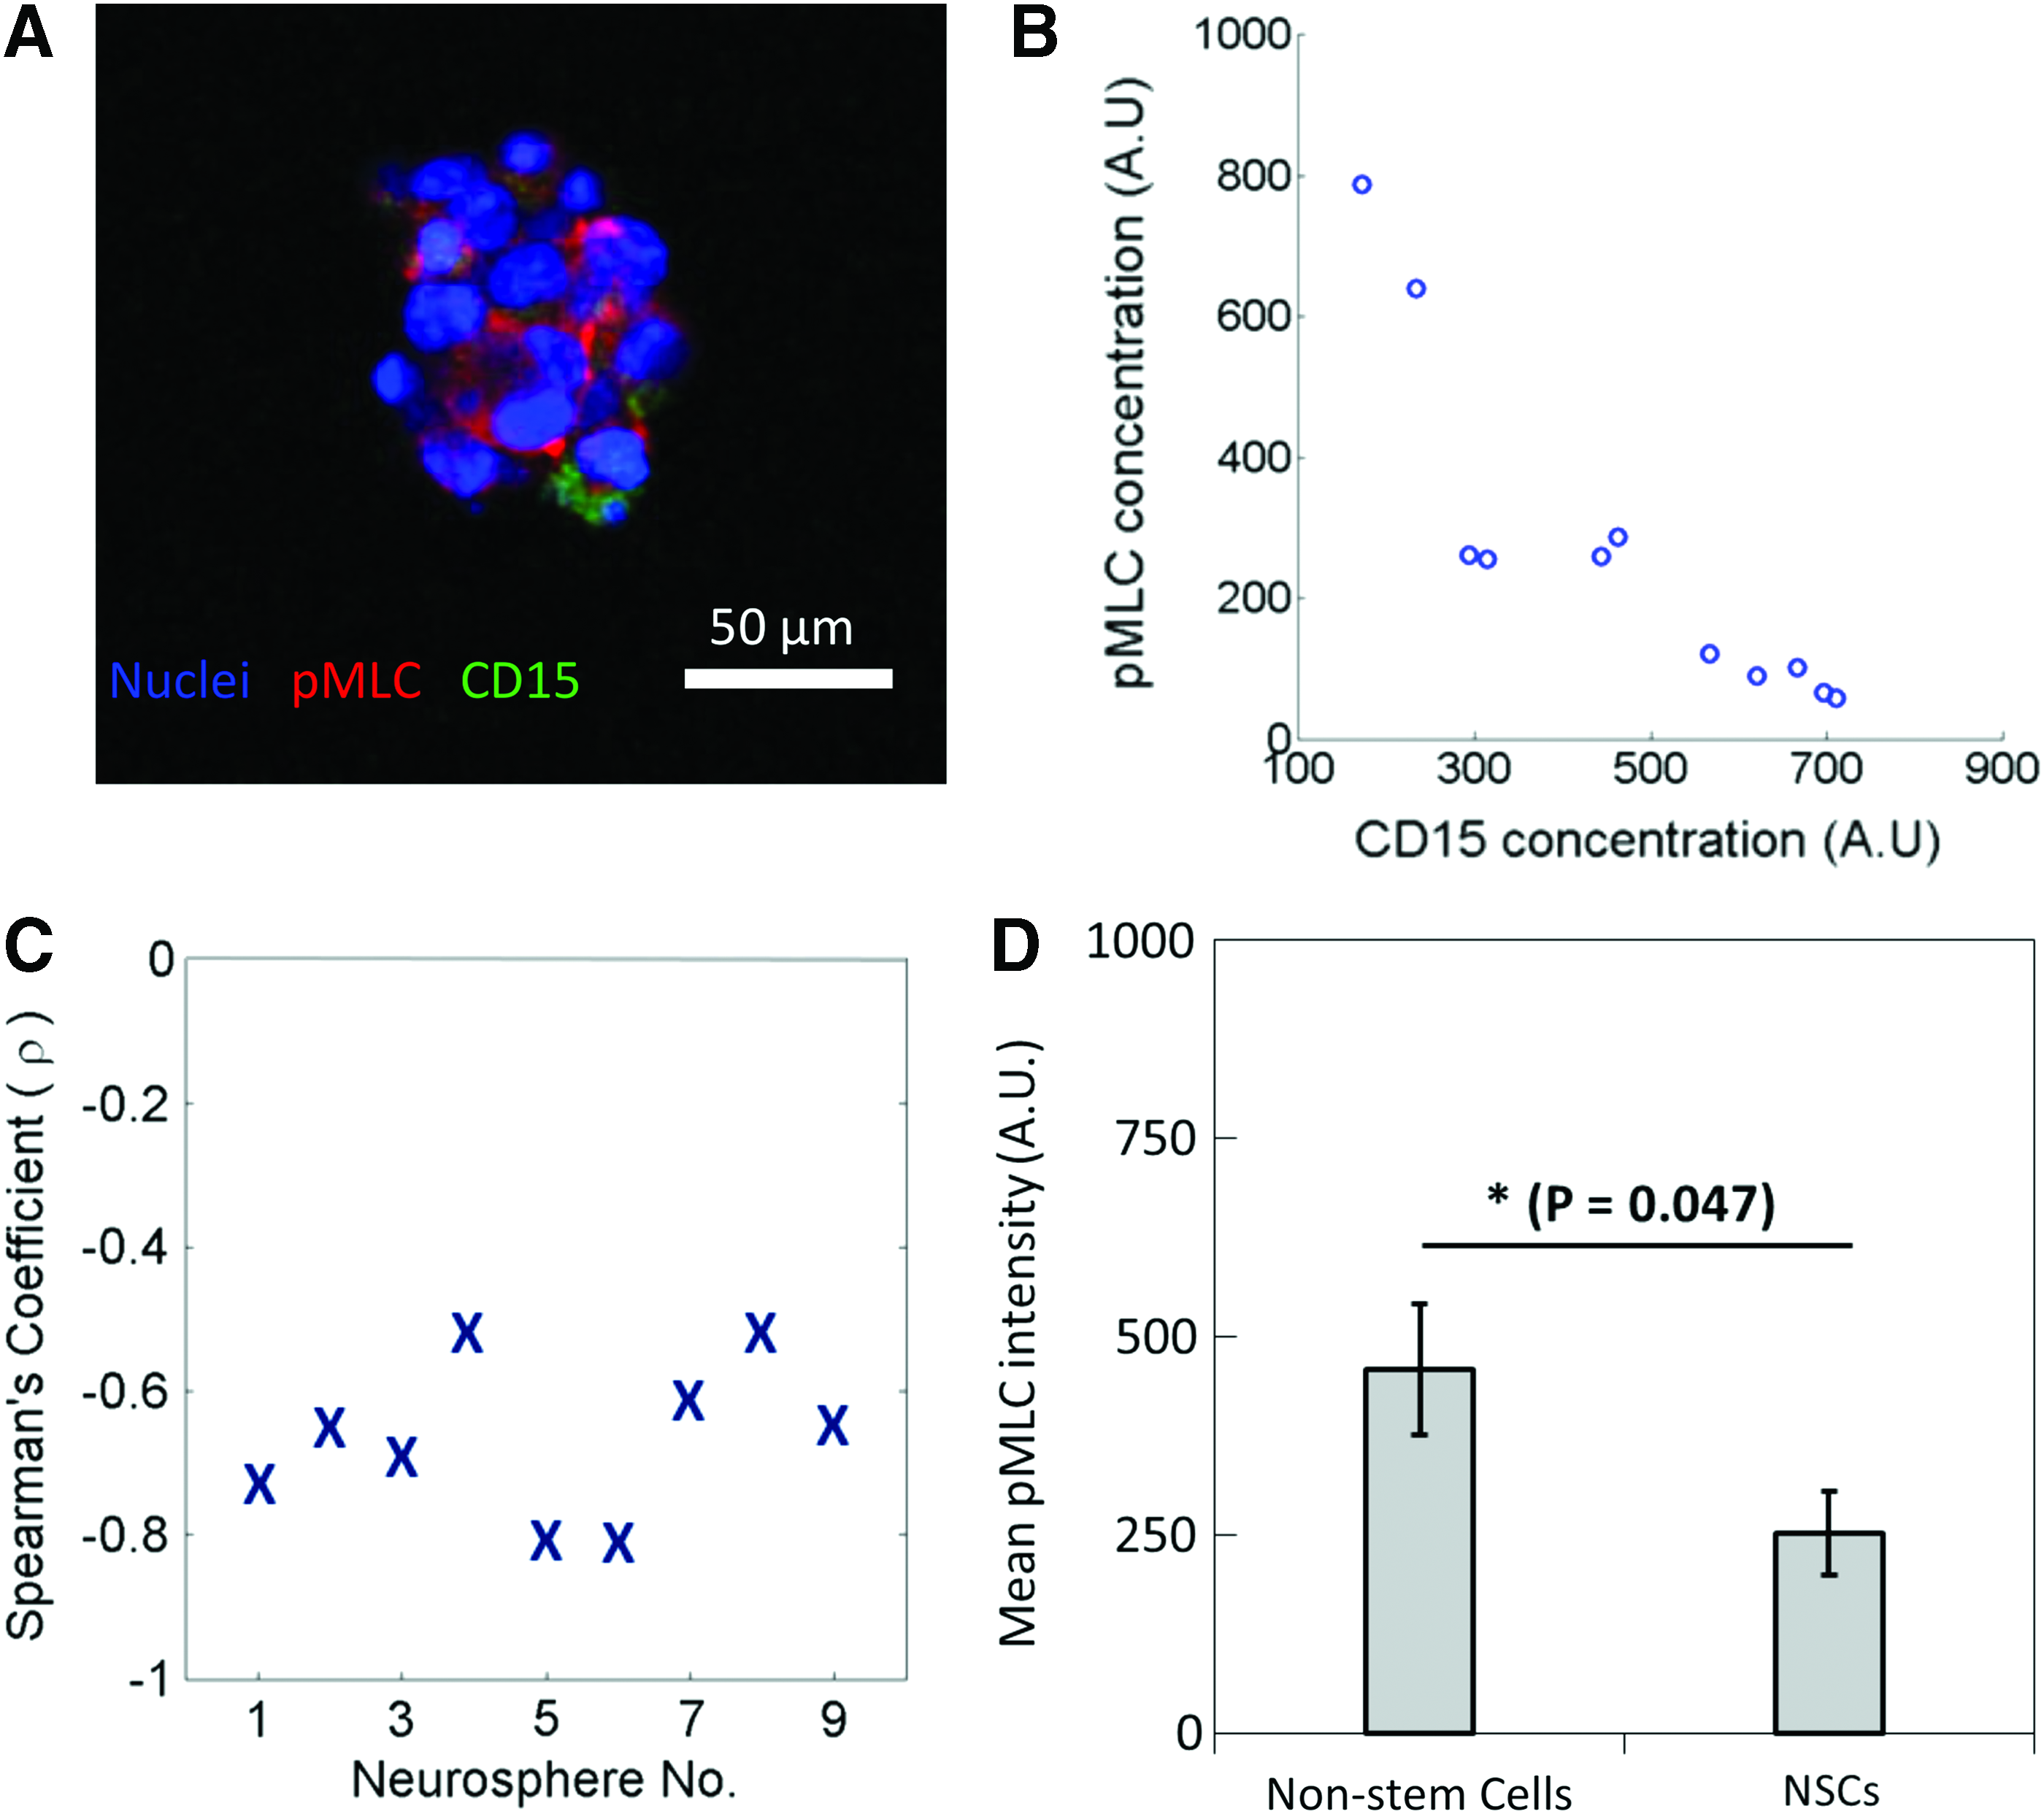
Negative correlation between pMLC and average cellular CD15 concentration.
Classification of NSCs and nonstem cells
Average CD15 fluorescence intensity of each individual NSC based on day 1 culture was determined to be ∼500 arbitrary units (AU), where NSCs were highly unlikely to have differentiated into nonstem cells. This value was used as the cut-off CD15 average cell intensity in classifying a cell as an NSC (AU ≥500) or as a nonstem cell (AU <500).
Neurosphere segmentation
The neurospheres are visible in the far-red channel 3D microscopy images with the beads. They are segmented by global thresholding using Otsu's method, 27 followed by selection by size and binary morphological operations to fill any holes in their volumes. The largest neurosphere in each image was taken as the neurosphere of interest.
Nuclei segmentation
To segment the many touching nuclei from the Hoechst stain channel 3D microscopy images, we use gradient vector diffusion by elastic deformation transformation. 28 Ideally, the intensity gradient vectors in an image should point inward toward the centers of bright blobs like the nuclei, and segmentation of nuclei from one another should simply entail following gradients from each pixel to find the nuclei they belong to. However, in real images, most gradient vectors are very small and noisy, especially within nuclei and in the background, with only a small proportion of strong gradient vectors at the borders of nuclei.
To smooth and denoise the gradient vector field and propagate the information from the strong gradients to the rest of the image to arrive at a more ideal image, we diffuse the gradient vectors with an elastic deformation transformation. This is defined as the solution to the following Navier-Stokes partial differential equation describing the deformation of an elastic sheet:
where v is the desired smoothed gradient vector field, f is the image, λ and μ are the positive Lamé coefficients describing the sheet's properties, q is a set of weights that determine how much different parts of the original image gradient should contribute to the result, ⨂ is element-wise multiplication, and
This equation converges to a solution after a number of timesteps, provided that both μ and (λ + μ) are less than 0.125. The higher these constants are, the more the first two smoothing terms contribute to the solution and the smoother the result.
For this application, we preprocess the image by normalizing the intensity values to [0,1] and then smoothing it with a 3D Gaussian kernel with standard deviation 1.0. We take μ = 0.1, (λ + μ) = 0.125, and the mask q:
We iterate for 15 timesteps to arrive at the smoothed gradient vector field. We then perform gradient ow tracking by looking in the direction of the gradient at each voxel and taking the first adjacent voxel in that direction as the next step. Tracking proceeds until the gradients at two succeeding steps differ in direction by more than π/2 radians, that is, where the dot product of the gradients at two succeeding steps is negative. All points where the tracking ends in this way are taken as a “seed.”
The binary image with all seeds set to true is then subjected to morphological closing with a spherical structuring element of radius 2. This merges seeds that are within a distance of four into larger seed regions. Each such region is labeled, and all voxels are labeled with the seed region that their gradients eventually flow to. These larger labeled regions are then filtered by size. Those above 10 5 or below 100 voxels are dropped from consideration.
The remaining labeled regions are each segmented by global thresholding using Otsu's method, with the bright volume above the threshold taken as the nucleus in that region. Finally, very small such nuclei below 100 voxels (likely due to imperfect seed merging) are merged with another nucleus if they are touching one (if they touch more than one other nucleus, the nucleus that they have a larger surface area of contact with is chosen), or they are deleted if they touch no other nucleus.
Cell segmentation
The neurosphere was segmented into cells by taking the nearest nucleus for each voxel in the neurosphere using the Euclidean distance transform. The CD15 intensity for each cell was then taken as the mean intensity in the CD15 channel within each segmented cell volume.
3D spheroid expansion stress using digital volume correlation and the Lucas-Kanade method
To derive the displacement field between the far-red channel images at two timepoints, we use the Modified Iterative-Warping Scheme (MIWS 29 ) extended to three dimensions, a variation of the well-known Lucas-Kanade method 24 for optical flow estimation. This method produces dense displacement fields, with a displacement value for every voxel in the image.
For two images I1 and I2 both of G ∈ Z
3
pixels, for each pixel k ∈ G, we seek a displacement u(k) that when applied to an interpolation of I2 minimizes a quadratic error Ek between the pixels k′ ∈ N in a finite neighborhood N ∈ Z
3
around k of each image, weighted by some radial weight function w. Using the sum squared difference as the error:
We minimize Equation (4) using a 3D adaptation of the MIWS,
30
a variant of the Lucas-Kanade method. MIWS takes the first-order Taylor expansion of Equation (4) with respect to u(k) − un(k′):
Taking ∂Ek/∂u (k) = 0, and
In this scheme, only one interpolation of I2 needs to be performed per iteration, since the interpolations at each pixel k are independent of k. The method returns a dense displacement field, that is, displacement for every voxel.
Obtaining values for fitting parameters p, Ks, Ka, and Kp in the analytical model
The numerical values for p, Ks, Ka, and Kp rate constants are obtained from curve fitting of the experimental data in Figure 6c, through the minimization of the sum of squared errors.
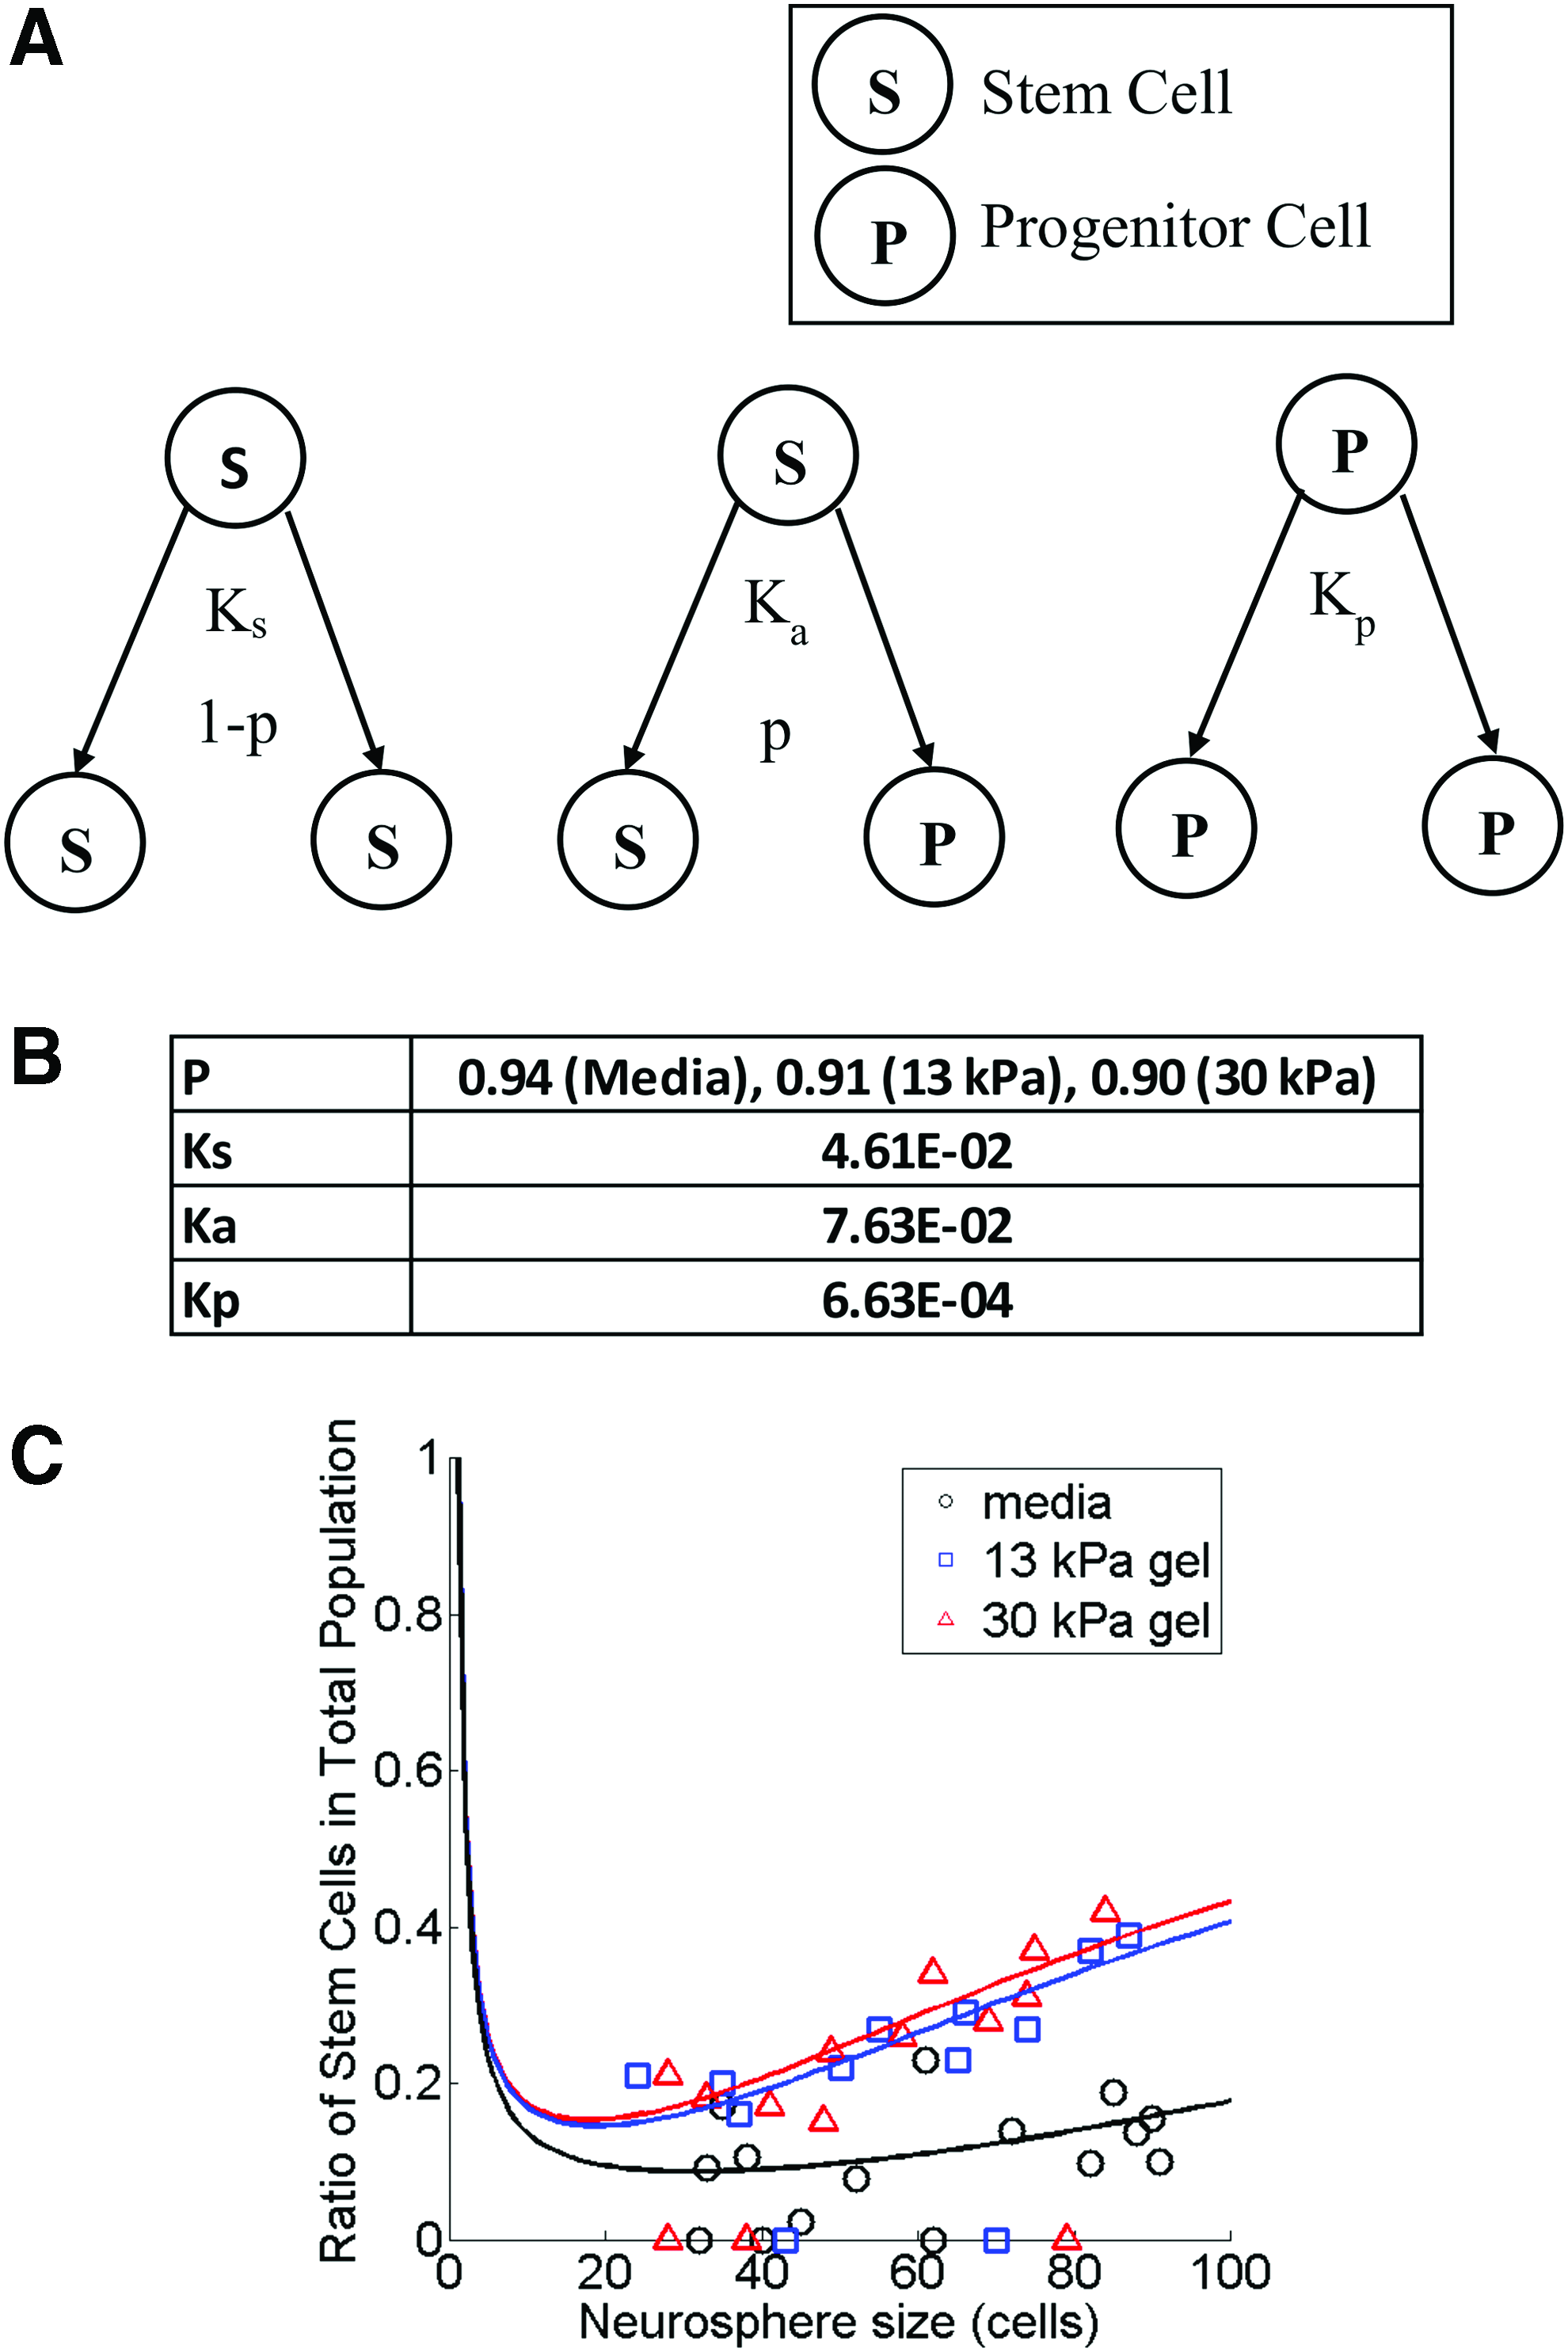
Analytical model of the ratio of stem cells in the total neurosphere cell population based on symmetrical and asymmetrical division of neural stem cells and division of progenitor cells.
Results
Ratio of stem cells in the total neurosphere cell population is positively correlated with environmental rigidity and neurosphere size
Neurospheres were immunolabeled with CD15 antibody, a known NSC marker, and Hoechst DNA stain. From the cell segmentation of neurospheres based on the DAPI channel in Figure 1A, the average fluorescence intensity of CD15 in each cell was quantified and the cells were then classified as NCSs or nonstem cells (see the Materials and Methods section).
To identify the most permissive 3D environment for NSC propagation, neurospheres of different sizes were grown in media, 13 and 30 kPa (1% and 1.5% agarose concentrations) stiff gels and the ratio of NSCs in the total cell population for each neurosphere was calculated (Fig. 1B, C). The average ratio of NSCs in neurospheres cultured in media between smaller (less than 60 cells) and larger (60 cells or more) neurospheres was not significantly different (Fig. 1C). This observation seems to imply that a suspension culture of NSCs may serve to maintain a small population of NSCs but not propagate them.
In addition, the ratio of NSCs in neurospheres cultured in 13 and 30 kPa agarose increases with increasing neurosphere size (Fig. 1C). The ratio of NSCs in smaller neurospheres grown in 13 and 30 kPa agar is significantly higher than those grown in media. A significantly higher ratio of NSCs is also observed in larger neurospheres cultured in 13 kPa (ratio = 0.4) and 30 kPa agarose (ratio = 0.45), compared with neurospheres cultured in conventional liquid media (approximate ratio of 0.15). However, there is no significant difference in NSC ratio between neurospheres in 13 and 30 kPa. It may be inferred that the optimal rigidity for propagating NSCs may be less than 30 kPa.
Quantification of sphericity of individual cells does not reveal significant differences between NSCs and non-SCs
To identify whether the NSCs were morphologically different from the nonstem cells, the sphericity of the cells was quantified. Figure 2A illustrates a plot presenting the sphericity of individual cells. The comparison revealed that the average sphericity of NSCs and nonstem cells was not significantly different. Further, Figure 2B shows that the cell volume of NCSs and nonstem cells is not significantly different as well. Thus, the findings imply that the 3D morphology of the NCSs is indistinguishable from that of nonstem cells (Fig. 2C, D). Agarose is not an ECM component in tissue. Therefore, it is speculated that the indifferent physical characteristics of the cells may be due to a lack of cell–matrix interactions. 31 To identify alternative characteristics of NSCs, the mechanical signatures of the cells were measured.
Mean 3D spheroid expansion stresses in neurospheres are dependent on neurosphere size and environmental rigidity
To quantify cell-generated stresses, the neurospheres, immobilized in 13 and 30 kPa bead-agarose gel (Fig. 3A), were each imaged at a 10-min interval. The magnitude and distance displaced were calculated from the two timepoints. To observe NSC behavior in different ECM stiffness, stresses exerted by neurospheres immobilized in 13 and 30 kPa agarose were compared. A heatmap displaying the stress magnitudes around a single neurosphere in three different planes is shown in Figure 3B, and it is plotted in the horizontal coordinate system (elevation and azimuth) in Figure 3C after fitting the surface of the neurosphere to a sphere. In addition, the mean stress exerted by neurospheres of different sizes were plotted (Fig. 3D). The scatterplot reveals a positive correlation of stress exerted and size of the neurosphere. Thus, the larger the neurospheres, the higher the mean stress exhibited. In addition, neurospheres in 13 kPa agarose (red circles) exerted less stress across the board compared with neurospheres embedded in 30 kPa agarose (blue circles), as shown in Figure 3D. The average mean stresses exerted by cells in neurospheres grown in 13 kPa agarose gels are lower than those grown in 30 kPa gels (Fig. 3E). Taken together, these observations imply that cells may display mechanical reciprocity to ECM stiffness in which a stiffer matrix results in differential stress modulation. Similar studies on stem cells speculated that stem cells exhibited a unique mechanical signature characterized by low stresses due to high nucleus-cell volume ratio and a sparse actomyosin network at the cell membrane.32–34
Negative correlation between total absolute stresses exerted by cells and average CD15 concentration
To elucidate the mechanical signature of NSCs, the total absolute stresses exerted by individual cells in a neurosphere grown in 13 kPa agarose gels was compared against CD15 signal intensity, as shown in Figure 4. In Figure 4A, a neurosphere stained for CD15 is shown and Figure 4B shows an example of a neurosphere where total absolute stresses exerted by individual cells were plotted against average cellular CD15 fluorescence intensity. To determine whether there was a correlation between total absolute stresses exerted and average CD15 intensity, Spearman's ranked correlation was carried out on 16 neurospheres (Fig. 4C) to obtain the Spearman's correlation coefficient, ρ. These results revealed a negative correlation between total stresses and CD15 signal intensity (Fig. 4C). Plotting the average total absolute stresses of NSCs and nonstem cells (Fig. 4D) reveals a significant difference between them. This suggests that 3D cellular stresses exerted by NSCs are lower than those exerted by nonstem cells. In conjunction with the findings reported in literature, that stem cells may exert less stress due to a sparsely organized actomyosin network, this result appears to be in agreement that NSCs also exerted less traction stresses compared with the nonstem cell population in the neurosphere. The general consensus on the mechanobiology of cells is that the denser the actomyosin and cytoskeletal network is in the cell, the higher the stresses generated by the cells. 31 This led us to postulate that the NSCs were likely to possess a sparse actomyosin network compared with the non-SCs.
Negative correlation between pMLC and average cellular CD15 concentration
We next determined why NSCs exert less stresses on their surrounding environment as compared with non-SCs. Since it is known that cells exert stresses on their microenvironment through actomyosin complexes, 32 we hypothesized that NSCs have lower levels of pMLC complexes compared with nonstem cells. Therefore, the neurospheres were co-labeled for pMLC and CD15. A comparison of pMLC fluorescent intensities against CD15 intensities of individual cells in the neurospheres grown in 13 kPa agarose gels was carried out (Fig. 5). A representative fluorescence image and plot of pMLC and CD15 intensities of each cell in the neurosphere are shown in Figure 5A and B. By carrying out a Spearman's ranked correlation on nine neurospheres (Fig. 5C), a negative correlation between pMLC and CD15 expression levels was revealed. Moreover, a significant difference was shown in a comparison of the average pMLC expression levels of NSCs and nonstem cells (Fig. 5D), where the expressed pMLC levels by NSCs were lower than those by nonstem cells. This finding suggests that NSCs may exert less stresses on their microenvironment as compared with nonstem cells because they express less active myosin complexes, which are needed to exert stresses through actomyosin complexes. 35
Analytical model of the ratio of NSCs in the total neurosphere cell population based on symmetrical and asymmetrical division of NSCs and division of nonstem cells
To explain the enrichment of the NSC population in the neurosphere cell population, we developed an analytical model of the ratio of stem cells in the total neurosphere cell population. This model that we have derived is based on the concept of symmetrical and asymmetrical division of NSCs and division of progenitor cells. A schematic representation of the various cell division possibilities is shown in Figure 6A. Here, the term p represents the probability that an NSC will undergo asymmetrical division and produce an NSC and a progenitor cell. As such, the corresponding probability that an NSC would undergo asymmetrical division is 1 − p. The rate constants of the symmetrical and asymmetrical division of NSCs and division of progenitor cells are Ks, Ka, and Kp, respectively. The number of NSCs (Ns) and progenitor cells (Np) in a neurosphere at any point in time t can then be represented as:
where we set Ns (0) = 1, Np (0) = 0 when t = 0. The ratio of NSCs to the total cell population in the neurosphere is denoted by f, where:
In this model, the parameters used in the simulations for the best fit to the experimental data are with the assumption that Ks, Ka, and Kp are unchanged in neurosphere cells grown in media, 13 and 30 kPa gels. Only the change in p, the probability that an NSC undergoes asymmetrical division, is considered. Parameters used for the fitting (see the Materials and Methods section) are shown in Figure 6B, whereas Figure 6C shows the graph of the experimental (data points) and simulation (solid line) results illustrating how the ratio of NSCs in the total neurosphere cell population changes with neurosphere size for neurospheres grown in media, 13 and 30 kPa gels. By biasing the value of p (the probability that an NSC undergoes asymmetrical division), the NCS population within the neurosphere cell population can be enriched.
Discussion
Cell-generated stresses and mechanotransduction have been studied in various stem cell types to distinguish stem cells and differentiated cells, which present vital implications for noninvasive identification of cell type and tissue engineering. We have established a novel method to calculate cell-generated stresses in 3D, which may contribute to better understanding of stem cell propagation and lineage specification via mechanotransduction. In principle, this may allow for researchers to generate tailored ECM to regulate the ratio of NSCs or differentiating cells in organoids.
Previously, 2.5D mechanical signatures of NSCs undergoing proliferation and differentiation were distinguished by Shi et al. 11 We have demonstrated that neurospheres embedded in 13 kPa agarose remained variable up to 4 days, resulting in higher NSC ratio than neurospheres grown in medium. Increased matrix rigidity was found to correlate with greater NSC ratio per neurosphere. The linear elasticity of agarose is advantageous for a comparison of traction stresses. However, it lacks the molecular cues for cellular adhesion. Therefore, we deduce that mechanical compression, rather than traction, appears to increase NSC ratio. Mechanical compression has been reported to drive cancer cells toward an invasive phenotype,13,36 suggesting that our finding is in agreement. However, a limitation of this study is that the mechanical compression of the agarose-medium matrix does not fully represent NSCs in vivo, given the complex composition of the ECM in native tissue.
We observed that NSCs exert less stress on the matrix than non-SCs. Further, pMLC was found to be downregulated in NSCs, which is associated with stress generation. It is speculated that the non-SCs may be differentiated NSCs, given that the actomyosin network is more established. Rho is known to govern myosin contractility, leading to differentiation hallmarks such as axon guidance and neurogenesis.37,38 Therefore, the manipulation of NSC gene expression profile by fine-tuning the stiffness and composition of the ECM may have important implications in generating NSCs or differentiated cells, which are more similar to cells in native tissue. A future work may include transcriptomic analysis to identify effector genes modulating the actomyosin network during lineage specification.
In this article, we describe a method for measuring stresses exerted by individual cells on the surface of neurospheres onto the surrounding environment. Our 3D spheroid expansion stress calculation method combines cell segmentation of individual cells within neurospheres with digital volume correlation and the Lucas-Kanade method. In principle, this method can be used to study the dynamics of any spheroid stress generation in a 3D environment and contribute to the understanding of the physical mechanisms of their stress generation. Further, this technique can be extended to elucidate changes in stresses exerted by cells resulting from cell differentiation, cell proliferation, and the effect of drugs and other soluble factors on stress production.
Conclusion
We have developed a novel assay that can enrich the NSC population in neurosphere cultures. A comparison of neurospheres cultured in media and agarose gels of different stiffness revealed that the ratio of NSC per neurosphere was enriched in neurospheres grown in gels with increasing stiffness. Subsequently, spheroid expansion stress microscopy performed on the neurospheres in 3D revealed two distinct populations of cells exhibiting different mechanical signatures: NSCs exerted less stresses on the environment as compared with nonstem cells. It was determined that NSCs expressed less pMLC compared with nonstem cells, whereby pMLC is needed in the actomyosin complex for cells to generate mechanical stresses. This may provide an explanation as to why NSCs exert less mechanical stresses on the environment.
Footnotes
Disclosure Statement
No competing financial interests exist.