
Abstract
The physical properties of the ovarian extracellular matrix (ECM) regulate the function of ovarian cells, specifically the ability of the ovary to maintain a quiescent primordial follicle pool while allowing a subset of follicles to grow and mature in the estrous cycle. Design of a long-term, cycling artificial ovary has been hindered by the limited information regarding the mechanical properties of the ovary. In particular, differences in the mechanical properties of the two ovarian compartments, the cortex and medulla, have never been quantified. Shear wave (SW) ultrasound elastography is an imaging modality that enables assessment of material properties, such as the mechanical properties, based on the velocity of SWs, and visualization of internal anatomy, when coupled with B-mode ultrasound. We used SW ultrasound elastography to assess whole, ex vivo bovine ovaries. We demonstrated, for the first time, a difference in mechanical properties, as inferred from SW velocity, between the cortex and medulla, as measured along the length (cortex: 2.57 ± 0.53 m/s, medulla: 2.87 ± 0.77 m/s, p < 0.0001) and width (cortex: 2.99 ± 0.81 m/s, medulla: 3.24 ± 0.97 m/s, p < 0.05) and that the spatial distribution and magnitude of SW velocity vary between these two anatomical planes. This work contributes to a larger body of literature assessing the mechanical properties of the ovary and related cells and specialized ECMs and will enable the rational design of biomimetic tissue engineered models and durable bioprostheses.
Impact Statement
Shear wave (SW) ultrasound elastography can be used to simultaneously assess the material properties and tissue structures when accompanied with B-mode ultrasound. We report a quantitative difference in mechanical properties, as inferred from SW velocity, between the cortex and medulla, with SW velocity being 11.4% and 8.4% higher in the medulla than the cortex when measured along the length and width, respectively. This investigation into the spatial and temporal variation in SW velocity in bovine ovaries will encourage and improve design of more biomimetic scaffolds for ovarian tissue engineering.
Introduction
There is a long history of ovarian follicle culture within biomaterials, with the ultimate goal of creating both in vitro models of health and disease and in vivo organ replacements, capable of restoring fertility and endocrine function over multiple ovulatory cycles.1–5 In vitro studies have demonstrated that the ovarian follicle—the functional unit of the ovary, composed of an oocyte surrounded by hormone-producing somatic cells—is exquisitely sensitive to the mechanical properties of its microenvironment and that the engineered matrix should be tailored to support optimal growth of each follicle stage.6–11
While the later stages of follicle development are regulated by hormonal signaling, it is hypothesized that mechanical signaling may drive initial activation of primordial follicles and their recruitment into the pool of growing follicles.12–15 Differences in mechanical properties between the ovarian cortex, where primordial follicles reside, and the medulla, which houses growing follicles, are thought to enable the opposing cell behaviors of the ovary: maintenance of the dormant follicle reserve for later years of life and simultaneous selection of some follicles for growth and maturation in the monthly cycle.13,16,17 Mechanical signaling may also impact proliferation, differentiation, and release of soluble signals, such as growth factors and steroid hormones.13,18
Mechanical signaling is not only involved in normal physiology of the ovary but also is implicated in ovarian pathophysiology. Increased ovarian rigidity is hypothesized to underlie the reduced ovulation rate, polycystic morphology, and hyperandrogenemia seen in polycystic ovary syndrome (PCOS).17,19,20 It may also contribute to the age-associated decrease in oocyte quality, as there is marked ovarian fibrosis during aging. 21 Understanding the mechanical properties of healthy, diseased, and aged ovarian tissue will enable the rational design of tissue engineered models that mimic the native physical properties which could then be used to uncover fundamental biomechanical signaling pathways that mediate cell and tissue function. Moreover, these findings could be applied to the design of transplanted artificial ovaries to enable long-term function of a durable bioprosthesis.
Most biomaterial approaches for ovarian tissue engineering have used scaffolds that are homogenous in composition and do not dynamically change in response to hormonal cycles. We posit that follicle function would be maximized in an engineered biomaterial matrix that recapitulates the spatial gradients and temporal changes in mechanical properties that exist in the native ovary.8,22,23
One approach to biomimicry was a multilayer hydrogel bead with a bioinspired structure, in which the inner core was a medulla-like soft collagen gel and the outer sheath was a cortex-like rigid alginate gel. Compared to encapsulation in alginate-only beads, there were improved rates of antrum formation (28% vs. 6%) when using the collagen/alginate bead, which exhibited biomimetic mechanical heterogeneity. 24
In another study, improved oocyte maturation rates were achieved when follicles were encapsulated in fibrin-alginate interpenetrating matrices compared to conventional alginate-only culture (82% vs. 67%). 25 Fibrin-alginate interpenetrating matrices dynamically soften over the culture period mimicking the remodeling of the ovarian extracellular matrix (ECM) that occurs during physiologic follicle development. 26 The results of these studies indicate that mimicking the spatial and temporal changes in the mechanical properties of the ovarian ECM could result in improved function of engineered ovarian tissues. However, there is a crucial gap in our knowledge of the mechanical properties of the ovary, specifically about spatial heterogeneity.
Traditional mechanical testing modalities, including compression, tensile testing, and nanoindentation, require that tissue samples be cut into a particular shape.27–30 While nanoindentation has been used to measure the modulus in discrete anatomic regions within slices of ovarian tissue, 31 accurate determination of the mechanical properties of whole ovaries, especially any spatial variations that contribute to function, requires that the tissue be measured in its intact three-dimensional state as it exists in vivo. Moreover, processing tissue removes tissue architecture and physical relationships between neighboring tissue structures that contribute to the overall mechanical properties of the tissue. Magnetic resonance (MR) and ultrasound elastography have been used to assess intact tissue in vivo, as well as ex vivo. One study measured the storage modulus of ex vivo bovine ovaries embedded in agar hydrogels (to maintain tissue hydration during measurement) using MR elastography, but they were unable to resolve spatial heterogeneities in the ovary. 31 The ability to evaluate mechanical properties of tissue in its intact state while allowing visualization of internal structures will offer a new way to understand the structure–function relationship of ovarian tissue as it exists in vivo.
Shear wave (SW) ultrasound elastography is a promising technique for characterizing the mechanical properties of ovarian tissue. It is a noninvasive, real-time imaging technique for characterizing the material properties of biological tissues, such as the mechanical properties. 32 SW ultrasound elastography uses acoustic forces to induce perturbations through the tissue and tracks the propagation of the resulting SWs. 33 In unstressed, homogenous isotropic materials, there is a direct relationship between SW velocity and shear or Young's modulus. However, because the ovary is heterogeneous and nonisotropic, these assumptions do not apply to ovarian tissue. Nonetheless, SW velocity can be used to make inferences about the material properties, such as the mechanical properties with consideration of the limitations of those assumptions when applied to biological tissue.
In this article, “mechanical properties” is used to describe the constellation of physical properties that describe how a tissue responds to applied force. Mechanical properties are influenced by the underlying composition and structure of the tissue.
SW ultrasound elastography on tissues has been applied to a variety of biological tissues, both healthy and pathological, such as breast, 34 nerve,35,36 liver, 37 and skeletal muscle. 38 It has been previously applied to ovarian tissue,39,40 but in a diagnostic and prognostic context, with SW velocity reported only in one plane. Not only can this technique potentially provide characterization of the mechanical properties of the ovary, but coupled with B-mode ultrasound, SW velocity can be determined within specific internal anatomical structures or regions without the need to disturb the native tissue architecture (e.g., no butterflying, processing into slices, and so on). Thus, the objective of this study was to determine spatial and anatomical differences in mechanical properties in ex vivo bovine ovarian tissue using SW ultrasound elastography.
Materials and Methods
Animal tissue collection
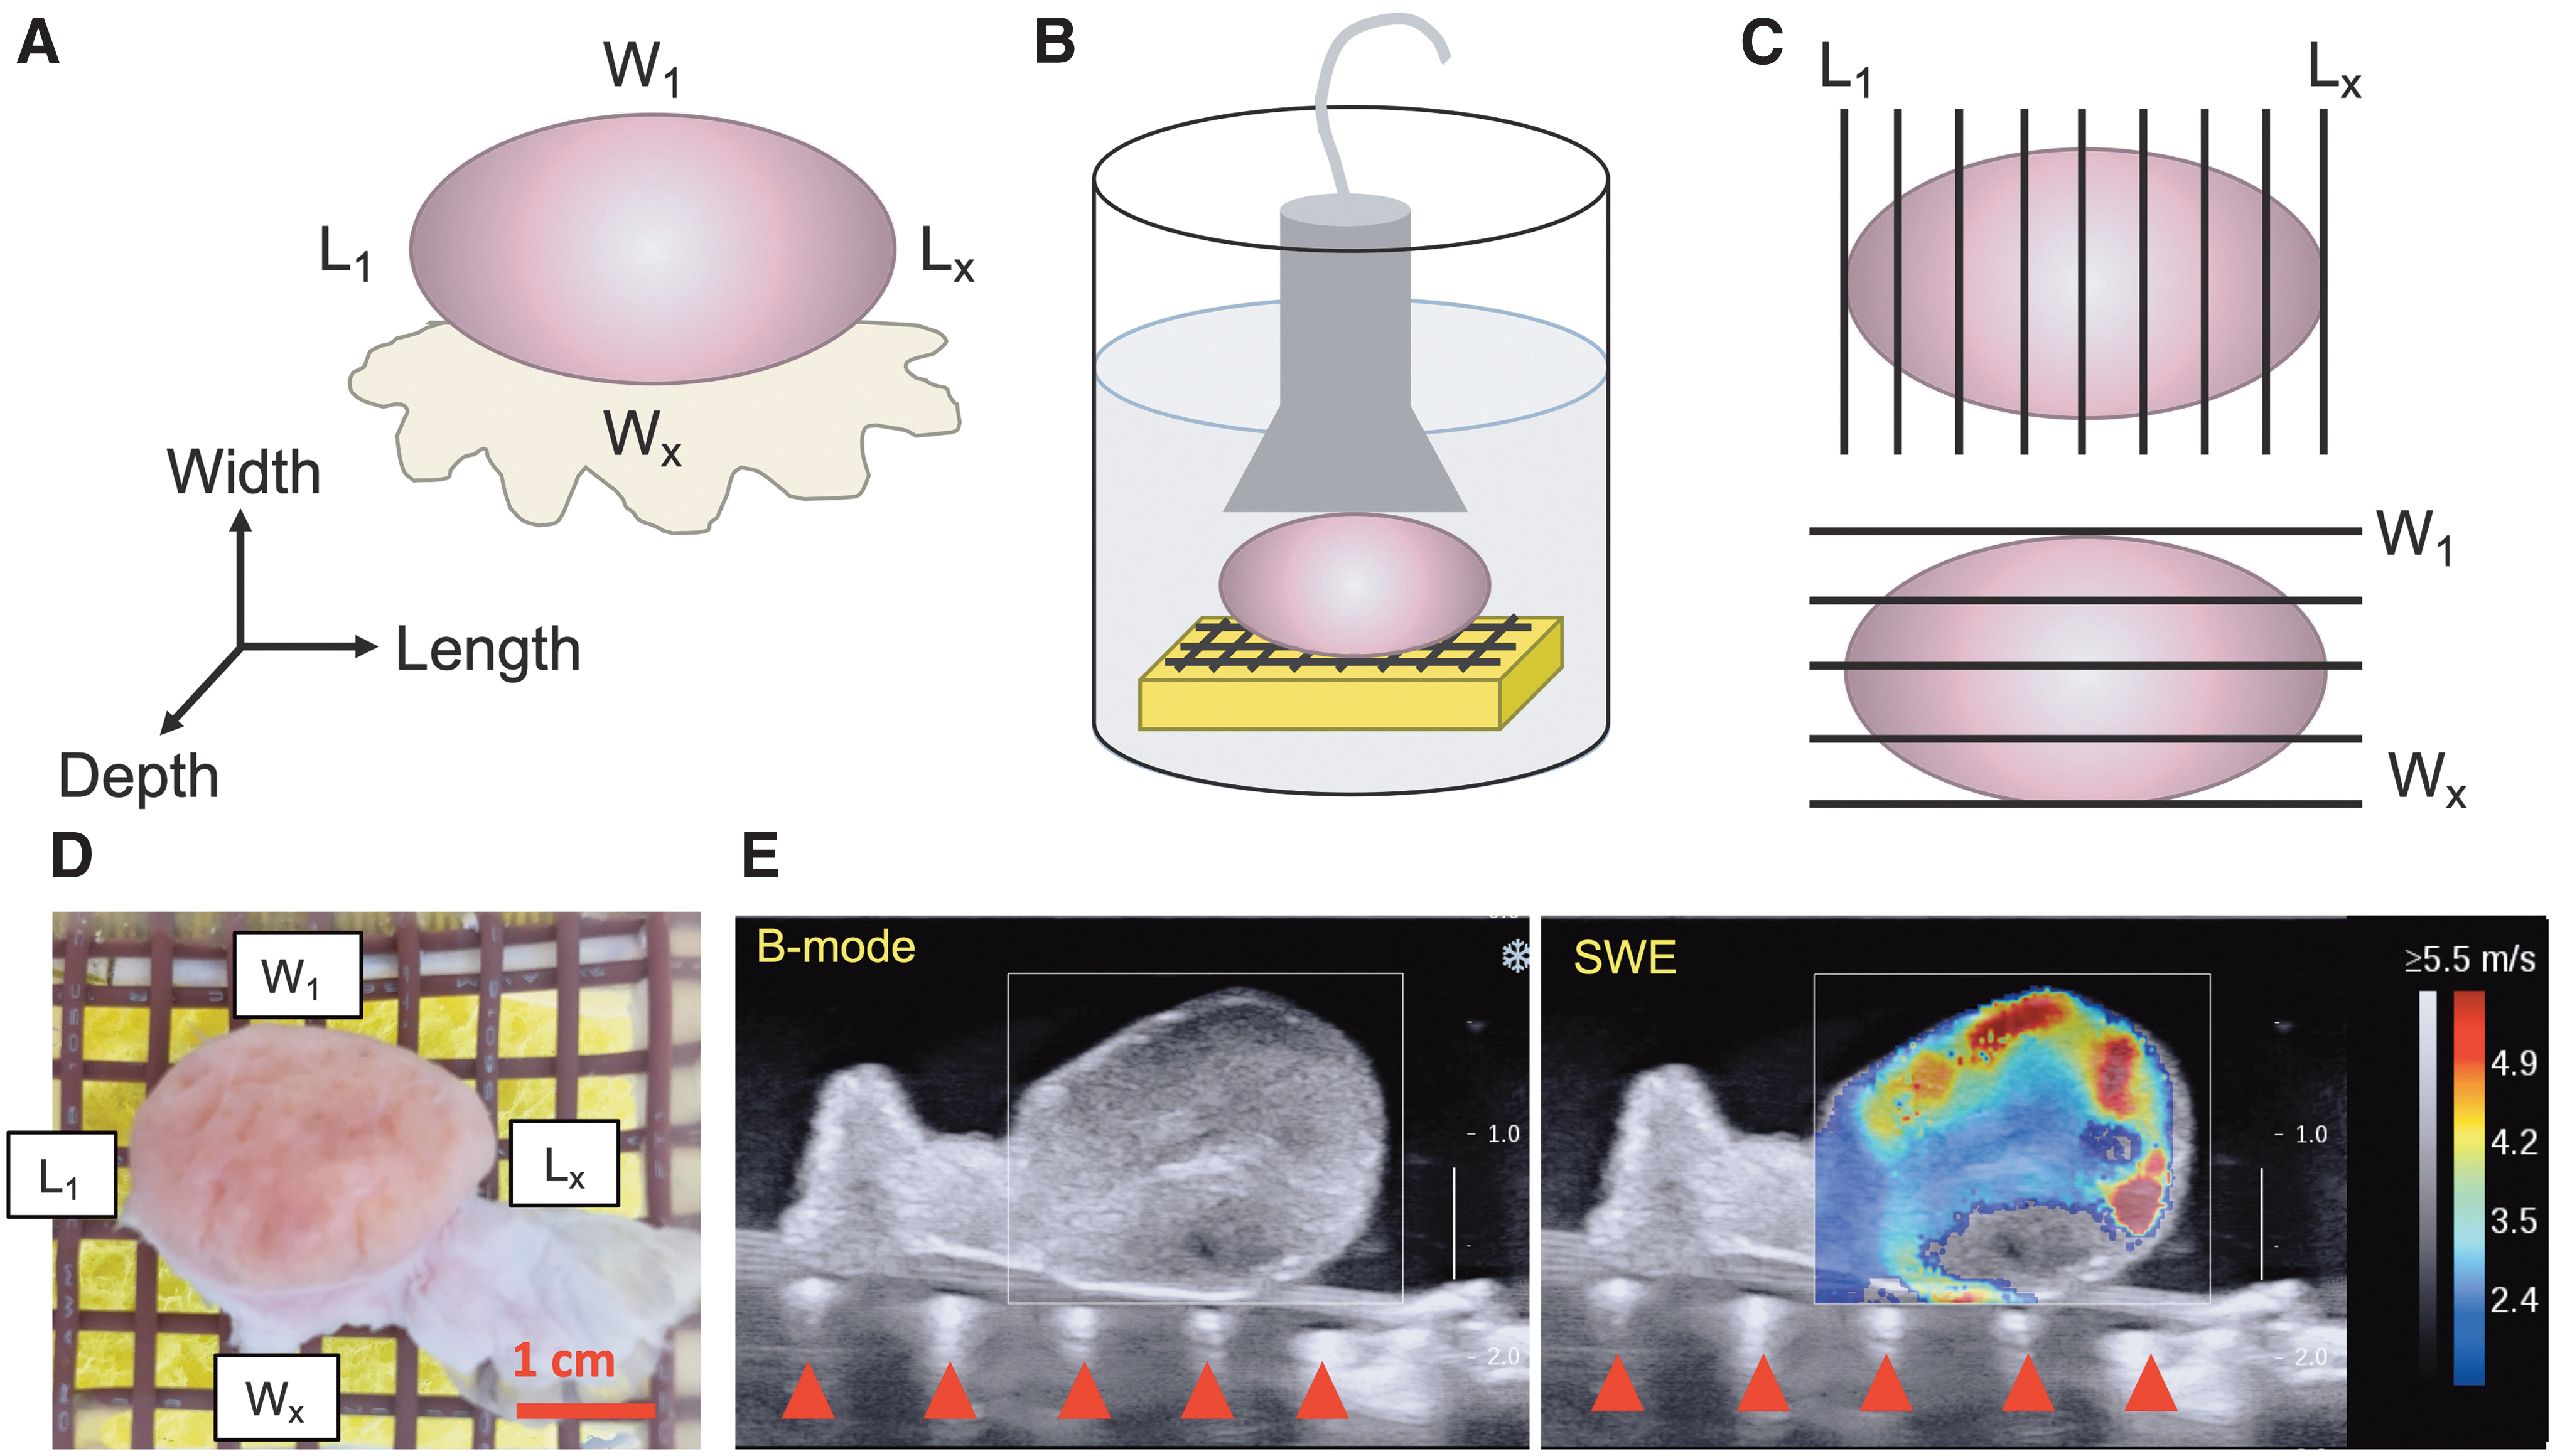
Five individual, nondominant bovine ovaries (Table 1) and 13 intact bovine reproductive tracts (13 dominant and 13 nondominant ovaries, Table 2) were included in this study. Bovine ovaries and reproductive tracts were isolated from postpubertal, reproductively adult heifers (age 24–30 months) following kosher slaughter at the Aurora Packing Company in Aurora, IL. The ovarian tissue was immediately stored at 4°C and transported by automobile to Northwestern University (∼1 h). Ovaries and tracts were stored in Liebowitz-15 media at 4°C until ultrasound measurements were made. All measurements were made within 24 h of tissue harvest, as our laboratory has previously demonstrated that there is no loss of structural integrity in ovaries incubated at 4°C for 24 h. 41 Ovaries were measured along three axes (length, width, depth, Fig. 1A) using digital calipers and weighed using a digital scale. Ovarian volume was calculated by assuming that the ovary was a perfect ellipsoid. Estrous cycle stage was determined by assessing morphology of ovarian structures, including follicles and corpora lutea. 42 After ultrasound measurements were made, ovaries were fixed in Modified Davidson's fixative at 4°C overnight, sectioned into 5 μm slices and stained with hematoxylin & eosin.
Experimental setup for SW ultrasound elastography of ex vivo bovine ovaries.
Bovine Ovary Anatomical and Shear Wave Velocity Measurements
Values are mean ± SD.
OV, ovary; SW, shear wave.
Characteristics of the Cohort of Paired Dominant and Nondominant Bovine Ovaries
F, follicular phase; L, luteal phase.
Shear wave ultrasound elastography
An Aixplorer V9.1.1 ultrasound system (Supersonic Imagine, Aix-en-Provence, France) coupled with a linear transducer array (4–15 MHz, 256 elements, SuperLinear 15–4; Vermon, Tours, France) was used to induce SWs and measure their resulting propagation. Measurements were made with ovaries fully hydrated in room temperature Dulbecco's phosphate buffered saline (DPBS; Gibco) (Fig. 1B). Ovaries were placed on a custom-made grid composed of ultrasound-visible wire spaced 6 mm apart, and pins were used to secure the connective tissue to the grid to reduce lateral movement of the ovary during ultrasonography without disturbing the ovarian tissue (Fig. 1D). The transducer was handheld with no contact between the transducer and the ovary to minimize the effect of contact pressure on SW measurement. 43 Images were taken at the midplane between adjacent parallel wires to eliminate interference of the wire parallel to the imaging plane with image generation. Perpendicular wires appear as hyperechoic points under the ovary in the ultrasound image but did not interfere with SW propagation or image quality (red triangles, Fig. 1E). Optical spacing of 6mm was chosen as the optimal spacing for the wires to maximize resolution but still allow for imaging planes free of interference from underlying parallel wires. Simultaneous B-mode imaging allowed for visualization of ovarian anatomical structures (follicles and corpora lutea) and the underlying wire grid (Fig. 1E). SWs were induced by a standard sequence of focused ultrasound pulses 33 using the “MSK/Muscle” mode of the Aixplorer system.
Data collection
All ultrasound images were taken within 24 h of tissue harvest. For a given ovary or given tract, all images were taken within 1 h to minimize variability due to time. To assess spatial differences (length vs. width, cortex vs. medulla) in the mechanical properties of ovarian tissue, five nondominant ovaries (Table 1) were scanned using SW ultrasound elastography as described above. Images (SW velocity mode and B-mode) were taken at regular intervals (∼6 mm apart, between wires) along the length (from L1 to Lx) and width (from W1 to Wx) of each ovary (Fig. 1A, C) (denoted “top”). To test for depth effects, the ovary was then flipped over, resecured to the wire grid, and imaged again at regular intervals along the length and width (denoted “bottom”). One image was taken at each location. We calculated no difference in top and bottom measurements in the first set of five nondominant bovine ovaries, indicating that depth did not have an effect on SW velocity measurements (Supplementary Fig. S1). Therefore, top and bottom measurements were averaged for each ovary for further analysis. To compare dominant and nondominant ovaries in the follicular and luteal phases, we assessed the ovaries from 13 reproductive tracts (13 dominant ovaries and 13 nondominant ovaries, Table 2). Images were taken along the length and width of each ovary at regular intervals, but the ovary was not flipped over for repeat measurements, as we calculated no difference in top and bottom measurements in the first set of five nondominant bovine ovaries (Supplementary Fig. S1).
SW velocity data processing
Custom software, written in MATLAB (Mathworks, Natick), was used for data analysis in this study. We manually drew polygonal region(s) of interest (ROI): one ROI per image to evaluate the whole ovary (ROI was drawn to outline the external contour of the ovary) or two ROIs per image to compare between two regions within a single image (cortex vs. medulla, ovarian tissue vs. corpus luteum).
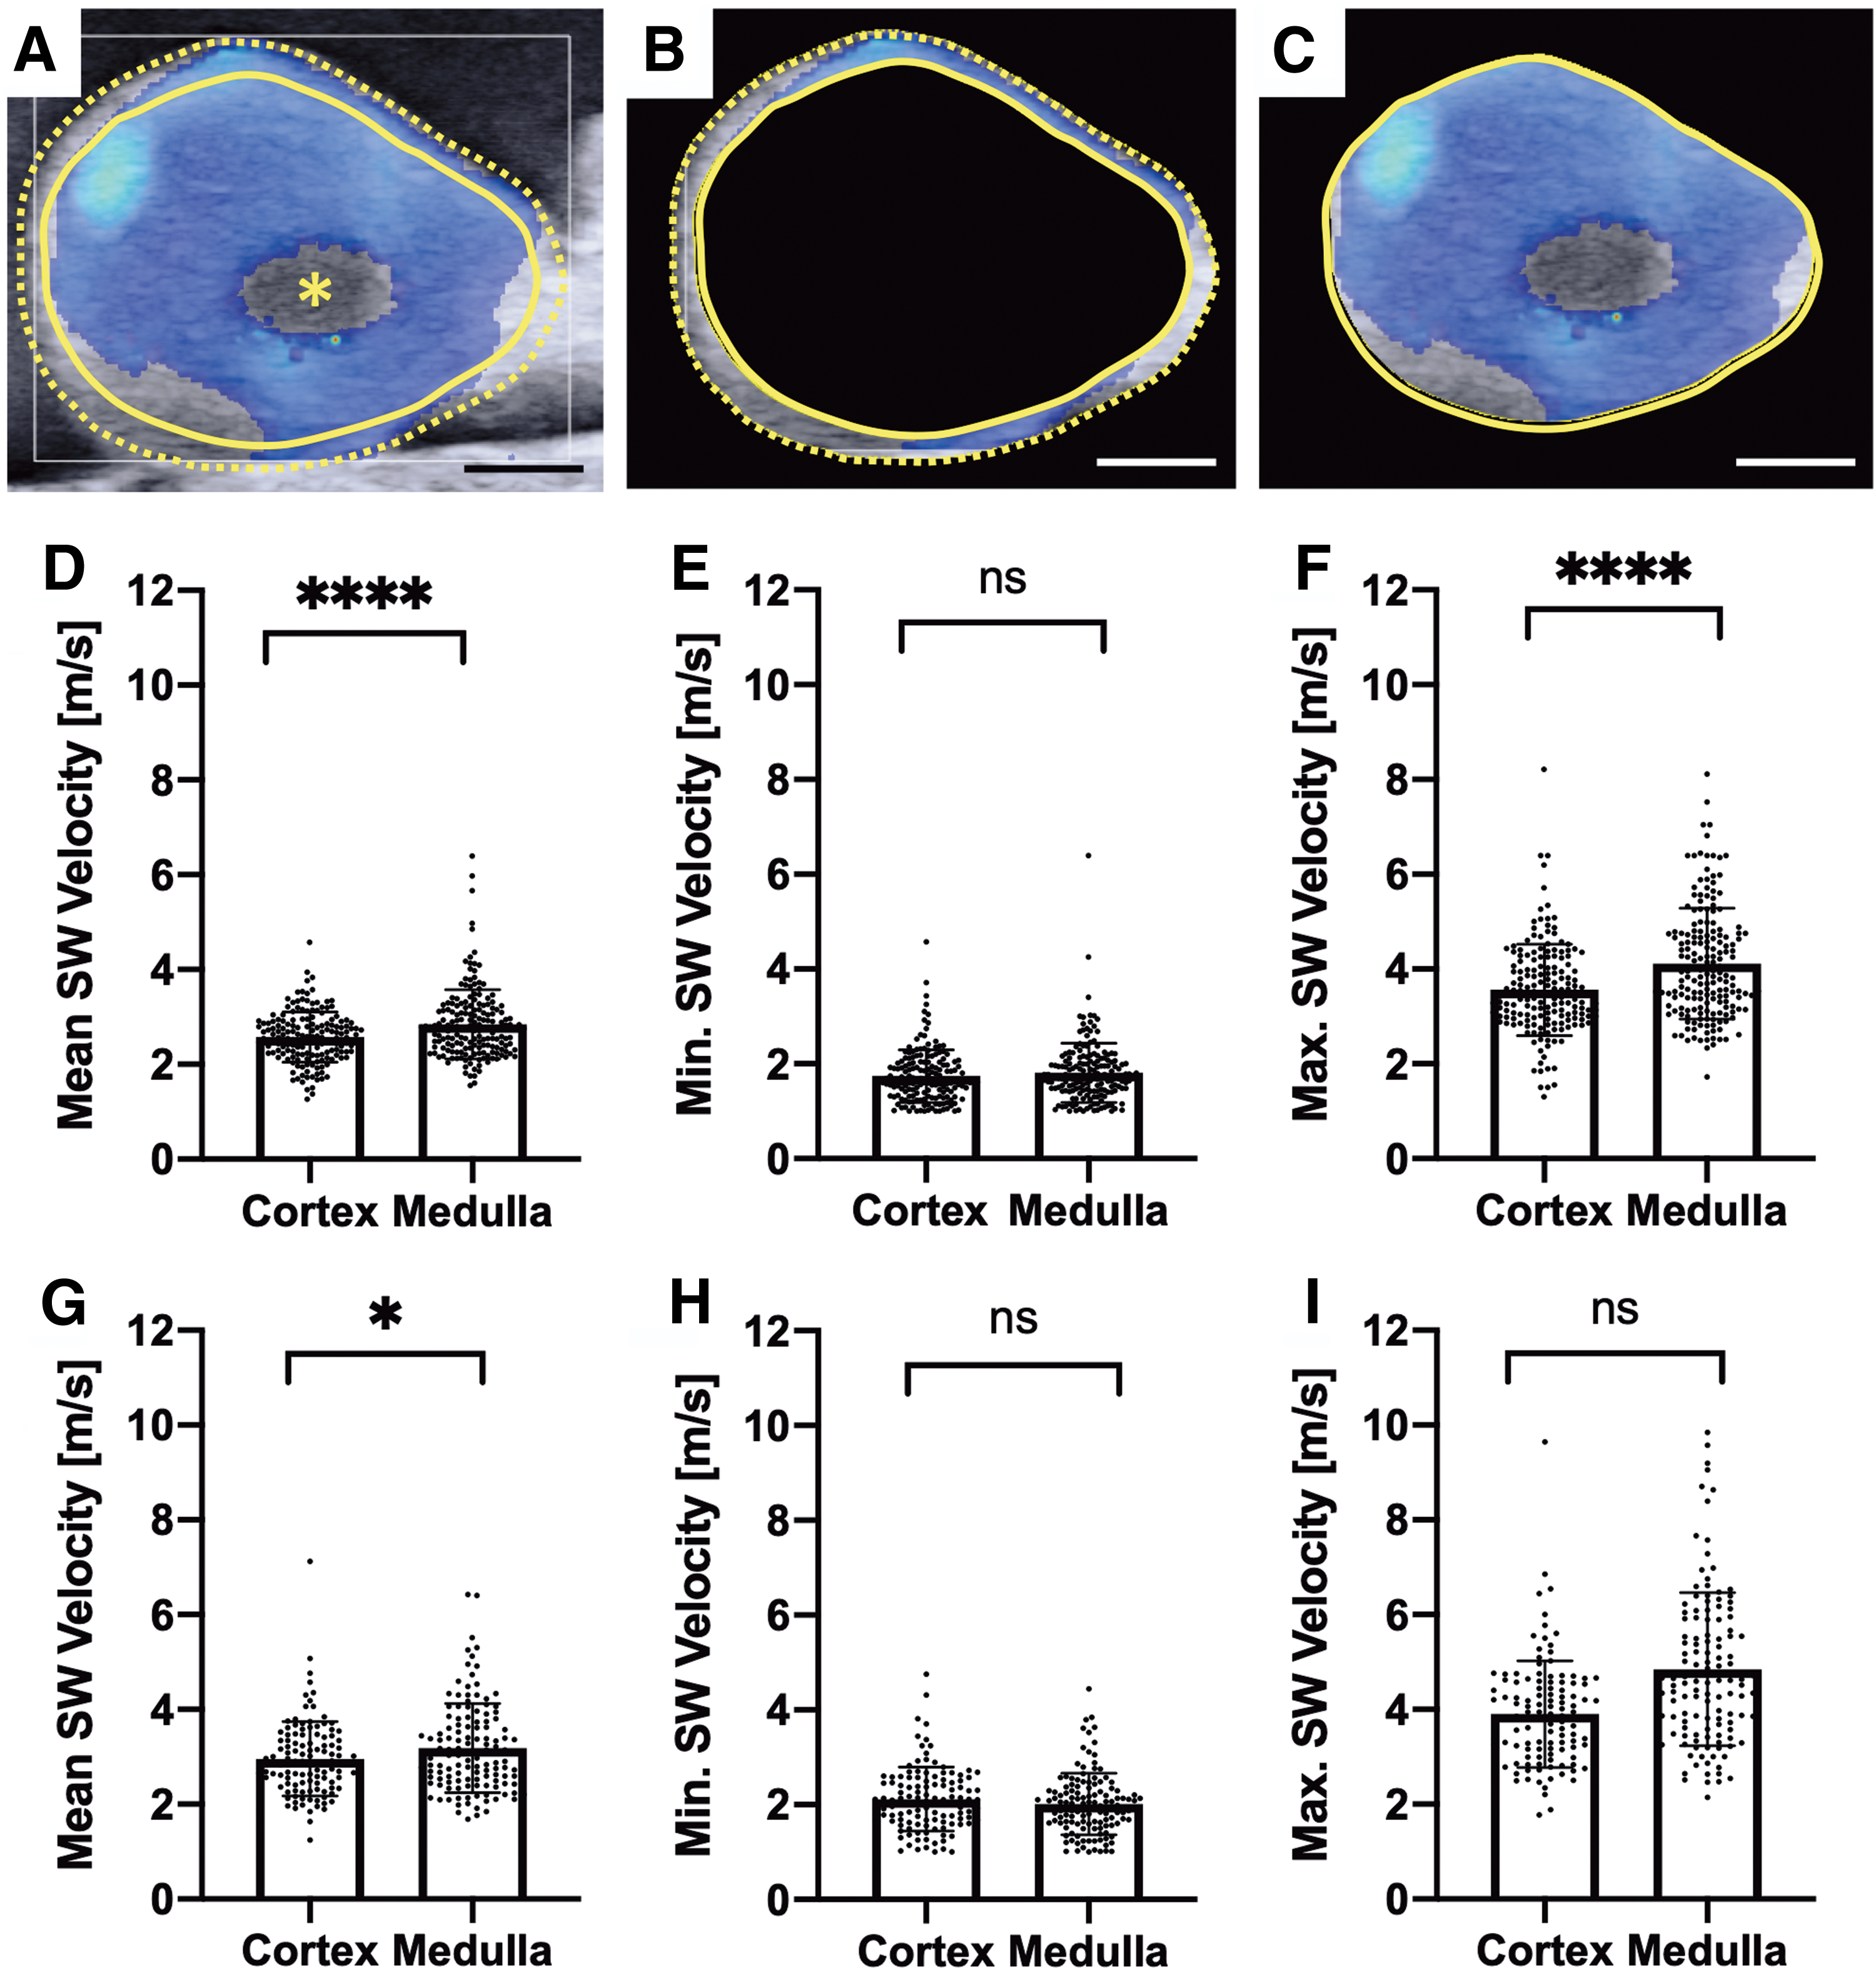
For comparisons of cortex and medulla, the outer dotted line outlines the exterior contour of the ovary, and the inner solid line is manually drawn approximately one millimeter inside of the outer ROI (Fig. 3A). The cortex was defined as the donut-shaped region between the two ROIs (Fig. 3B) and medulla as the region defined by the inner ROI (Fig. 3C). One millimeter was chosen as the cortical thickness because it is the thickness used clinically when performing freezing of ovarian cortical tissue for fertility preservation. 15
Differences in mean, minimum, and maximum SW velocity between ovarian cortex and medulla.
For comparison between corpus luteum and the ovarian tissue, one ROI was manually drawn to outline the external contour of the dominant luteal ovary, and the second ROI was manually drawn to outline the contour of the corpus luteum.
The custom software extracted the SW velocity and “quality factor” values from within the ROI. Each SW velocity value is accompanied by a “quality factor,” provided by the proprietary software from the ultrasound company, that indicates the reliability of the measurement. We only used values with a quality factor greater than 0.8. The custom software calculated a minimum, maximum, and mean SW velocity for each ROI selected. The mean SW velocity for an entire ovary (termed “ovary mean SW velocity”) was calculated from the selected ROIs for all images within a given imagining plane for an entire ovary. No significant difference between ovary mean SW velocity was observed between the two sets (top and bottom) of measurements, (Supplementary Fig. S1); thus, top and bottom measurements were averaged for each ovary for further analysis.
Statistical analyses
All data sets were analyzed using GraphPad Prism software and expressed as the mean ± standard deviation. Paired t-tests were conducted to determine differences between SW velocity of (1) length and width measurements of the same ovary, (2) top and bottom measurements of the same ovary, (3) cortex and medulla measurements from the same image, and (4) ovarian tissue and corpus medulla measurements from the same image. Unpaired t-tests were conducted to determine differences between R-squared values of linear and quadratic best fit curves of SW velocity distribution plots in the length and width measurement directions. To compare ovary mean SW velocity between the cohorts of five bovine ovaries, one-way analysis of variance (ANOVA) was conducted with SW velocity as the dependent variable and ovary specimen as independent variable. A two-way ANOVA with Sidak multiple comparison's test was conducted with volume or mass as the dependent variable and estrous cycle stage (follicular or luteal) and dominance (dominant or non-dominant) as the independent variables. All statistical analyses used an alpha level of 0.05.
Results & Discussion
Spatial distribution and magnitude of SW velocity differ when measured along two anatomical planes
Unlike skeletal muscle and tendon, which exhibit significant anisotropy due to the highly organized, parallel orientation of matrix fibers, 44 the ovary is less organized with ECM fibers randomly distributed throughout. 45 Therefore, we hypothesized that SW velocity would be the same at each 6 mm interval across both anatomical planes measured. To test this hypothesis, images were assessed at regular intervals along both the length and width of each ovary, and the mean SW velocity in each image was calculated (Fig. 1C). Visually from the images, the lowest SW velocity was observed in the center of the ovary with higher SW velocity laterally as the transducer scanned along the length from L1 to L15 (Fig. 2A). Along the width, the highest SW velocity was observed on ovarian surface opposite the hilum (W1), and lowest SW velocities were recorded near the ovarian hilum (W13) (Fig. 2B).

Spatial distribution and magnitude of SW velocity differ between two anatomical planes, length and width.
To quantify the spatial distribution that was observed, the mean SW velocity was plotted for each image versus the sequential image number along the ovary (i.e., L1 to Lx, W1 to Wx, Fig. 1C and Supplementary Fig. S2). Consistent with these visual observations, when scanned along the length of the ovary, an U-shaped curve was observed with values of mean SW velocity highest laterally and lowest centrally (Fig. 2C), and when scanned along the width of the ovary, the resulting curve was more linear, decreasing as the transducer was moved toward the connective tissue (Fig. 2D).
To characterize and compare the spatial distribution of SW velocity throughout the ovary, we fit linear and quadratic curves to the SW velocity–image number data for each ovary. This allowed us to compare the SW velocity distribution curves across all ovaries, since each ovary varied in size (Length: 2.07–2.77 cm, width: 1.23–1.85 cm, Table 1) and imaging was performed at regular intervals; thus, resulting in some ovaries having fewer images than others.
To visualize differences in the shape of the SW velocity spatial distribution curves between length and width, the resulting R-squared values for linear and quadratic best fit curves were plotted as a heatmap (Fig. 2E). Simple linear regression resulted in good curve fits for plots of SW velocity in the width direction as measured by R-squared value (mean = 0.7984 ± 0.1866, n = 10), but not in the length direction (mean = 0.1979 ± 0.2022, n = 10) (Supplementary Fig. S3A). Nonlinear curve fitting to a second order polynomial (quadratic) resulted in better fit curves for plots of the length direction and similarly well fit curves in the width direction (mean = 0.5358 ± 0.1790 and 0.8548 ± 0.1245, respectively, Supplementary Fig. 3B). Not only were spatial distributions of SW velocity distinct between the two anatomical planes, ovary mean SW velocity was also higher in images taken along the width direction compared to the length direction (p = 0.0224, n = 10, Fig. 2F). Finally, there was no statistically significant difference in the ovary mean SW velocity between ovaries when measured in the length (Fig. 2G) or width (Fig. 2H) directions, indicating that there was no significant variability between tissue samples.
Based on these findings, we conclude that the ovary is nonisotropic. We speculate that differences in SW velocity spatial distribution and ovary mean SW velocity between the length and width measurement directions may be related to the presence of vascular and connective tissue at the ovarian hilum. When scanning along the length, the hilum is present in nearly all slices, whereas when scanned on the width, the hilum is found on only one face of the ovary. Therefore, the SW velocity measured in vascular and connective tissue contributes more to the ovary mean SW velocity in the length than in the width direction. Given the differences in both the spatial distribution and magnitude of mean SW velocity, SWs appear to propagate more slowly in the vascular and connective tissue of the ovarian hilum than the surrounding ovarian tissue. This is consistent with an earlier case report, which used SW ultrasound elastography to evaluate a sclerosing stromal tumor of the ovary and found that normal vascular tissue (confirmed using Doppler mode to visualize blood flow) was softer than the surrounding ovarian tissue. 46 We speculate that differences in SW propagation between vascular tissue and ovarian tissue may be due to differences in tissue composition and structure in these regions. Using conventional B-mode ultrasound, we were not able to differentiate hilar and ovarian tissue; therefore, we could not isolate these compartments as independent ROIs for definitive comparison. Although it is most likely that the difference in SW velocity pattern and magnitude between measurement planes was the contribution of vascular and connective tissue at the ovarian hilum, we cannot exclude that these differences may be related to the relative contribution of ovarian cortex and medulla to the total ovarian tissue area in each image, as cross-sectional area varies across the ovary.
The cortex and medulla have different SW velocity distributions
To directly evaluate whether there were differences in SW propagation between cortex and medulla, we segmented the ovary into a cortex ROI and a medulla ROI and compared the SW velocities in these regions. Mean SW velocity in the cortex was significantly lower than the mean SW velocity in the medulla along the length and width directions (Fig. 3D, G, respectively). There was no difference in the minimum SW velocity between cortex and medulla (Fig. 3E, H), but maximum SW velocity was higher in the medulla than cortex along the length and width directions (Fig. 3F, I, respectively). This suggests that SW velocity in the medulla is not uniformly higher than SW velocity observed in the cortical region. Indeed, the minimum SW velocity is not different between the two regions, but the maxima are higher in the medulla and these maxima are likely responsible, at least in part, for the higher mean SW velocity seen in the medulla.
This result is contrary to the dominant paradigm in the field, which holds that the cortex is stiffer than medulla and that it is this increased stiffness that maintains quiescence of the immature primordial follicle pool. To our knowledge, no one has previously reported a quantifiable difference in mechanical properties between ovarian cortex and medulla. Wood et al. found no difference between the two regions in tissue slices from two bovine ovaries using nanoindentation, 31 and other reports are anecdotal and use density of collagen staining in immunohistochemistry as an indirect surrogate marker of tissue stiffness.15–17 The observed differences in mechanical properties between cortex and medulla using SW ultrasound but not when using nanoindentation are unsurprising. Biological tissues are hierarchical structures with different physical properties at each length scale.47,48 Due to the resolution of SW ultrasound elastography (∼1 mm), 33 the scale at which nanoindentation and SW ultrasound are measuring mechanical properties is different. Thus, the observed differences in SW velocity between cortex and medulla may reflect differences in their mechanical properties, including differences in ECM architecture and composition, 45 density, size, and shape of follicles and other structures 49 between the medulla and cortex.
SW velocity and the estrous cycle
The estrous cycle refers to the recurring series of physiologic phenomena that result in the sequential production of ovarian sex steroids, estradiol and progesterone, and ovulation or release of a mature oocyte. Cows, like humans, are a mono-ovulatory species, meaning that one oocyte is released in each cycle, resulting in one dominant and one nondominant ovary.
In the follicular phase, the dominant ovary is characterized by a large antral (fluid-filled) follicle (Fig. 4A, C). Using B-mode ultrasound, additional smaller subordinate follicles may also be visualized in the dominant follicular ovary (Fig. 4D). A dominant follicular ovary is largely composed of fluid-filled follicles, with comparatively less stroma than a nondominant ovary. SWs cannot travel through liquids; hence, there are fewer colored areas on the SW ultrasound image of this representative dominant follicular ovary (Fig. 4E).

Comparison of paired ovaries (dominant/nondominant) in follicular and luteal phases of the estrous cycle.
In the luteal phase, the dominant ovary has a large corpus luteum, which may appear yellow-orange or hemorrhagic, a transient tissue structure responsible for the production of progesterone (purple triangle, Fig. 4B, G). The corpus luteum can be visualized on B-mode ultrasound (Fig. 4H), but unlike a fluid-filled dominant follicle, SW propagates through the dominant corpus luteum as demonstrated by the colored area in the SW ultrasound image (Fig. 4I). Nondominant ovaries in the follicular and luteal phases are indistinguishable from one another. In both cases, they contain small follicles (<9 mm) and/or regressing corpora lutea (Fig. 4K–M) and are smaller in mass and volume (Supplementary Fig. S4) than dominant ovaries (Table 2).
Differences between dominant follicular, dominant luteal, and nondominant ovaries are also evident in histological sections (Fig. 4F, J, K). Of the 13 tracts, four tracts were in the follicular phase and nine tracts were in the luteal phase. Because of the large fluid filled regions impacting SW propagation and the subsequent number of SW values with a quality factor >0.8 in the dominant follicular ovaries compared to the dominant luteal and the nondominant ovaries, comparison of SW velocities between these groups was not performed.
The folliculo-luteal transition is characterized by a substantial reorganization of ECM, with the change from an ovulatory follicle with highly organized distinct layers of granulosa and theca cells to a highly vascularized corpus luteum composed of a heterogeneous mixture of luteinized granulosa and theca cells, endothelial cells, and fibroblasts and a shift in ECM composition from mostly type IV collagen in the follicle to fibrillar (type I) collagen in the corpus luteum.50–53 We hypothesized that this ECM reorganization would result in differences in SW velocity between the corpus luteum and the surrounding normal ovarian tissue. There was no difference in mean SW velocity between dominant corpus luteum and the surrounding ovarian tissue in the length (Fig. 4O) or width (Fig. 4P) directions, despite Wood et al. reporting an increased storage modulus in the corpus luteum compared to surrounding tissue in one of two bovine ovaries analyzed by nanoindentation. 31
The increased storage modulus measured using nanoindentation may reflect differences in the micromechanical properties between the corpus luteum and surrounding tissue. However, in present study, SW velocity was not significantly different between the corpus luteum and surrounding tissue, suggesting a lack of difference in mechanical properties. Several factors may affect the mechanical properties and SW propagation such as millimeter-scale differences in ECM composition, density, organization, and structure. This discrepancy in results may be also due to low sample number in the Wood et al. study or due to error that commonly occurs when performing nanoindentation on soft tissue samples (adhesion between tip and sample, uneven surface, etc.). Finally, MMP and TIMP activity in the corpus luteum is known to vary between corpus luteum development, maintenance, and regression. More refined estrous cycle staging into early, mid, and late luteal phase rather than simply luteal phase may reveal differences in SW velocity, but such analysis was not possible with the current sample number.
Limitations
This work contributes to a larger body of work on measuring the mechanical properties of the ovary31,39,40,46,54–60 and related specialized ECMs, the cumulus oophorus61,62 and zona pellucida.63,64 The mechanical properties of mammalian ovary and related cells and ECMs have been investigated using numerous techniques, including nanoindentation, SW elastography (ultrasound and MR), tensile testing, and rheology. These studies, even those using similar techniques, often report different physical properties (e.g., Young's modulus vs. tensile strength; strain ratio vs. SW velocity), making comparisons between studies difficult or sometimes impossible. Only one clinical study that used SW ultrasound elastography on human ovaries reported their findings as SW velocity. They report median SW velocity of two ovarian lesions: 4.20 ± 0.42 m/s in endometriomas and 2.54 ± 1.04 m/s in hemorrhagic ovarian cysts. 39 Our measurements of normal bovine ovarian tissue are also within this range (Table 1).
There are several limitations when interpreting the observed differences in SW velocity. SW velocity is not a direct measure of stiffness, but rather it is simply a measure of the speed at which SWs travel through tissue. Current models to convert between SW velocity and Young's or shear modulus require multiple assumptions (isotropy, homogeneity, and negligible viscosity), which are not true for ovarian tissue. SW propagation can also be influenced by the composition and organization of the ECM, the geometry of structures within the ovary, tension within the tissue, and the density of the tissue. Thus, we were unable to directly compare the measurements from our study to any other measurements of mechanical properties previously reported for bovine 31 or human.31,40,54,56–58 In addition, it is unlikely that parameters estimated from SW velocity would be equivalent to those calculated from nanoindentation studies, given that the modalities are measuring tissue properties at different scales within the hierarchical tissue structure.
Finally, it should be noted that the wavelengths of the induced SWs are larger than many structures within the ovary (wavelength magnitude on the order of mm). This will limit the resolution of our SW velocity measurements. Thus, due to the size of the cortex, the estimation of cortex SW velocity may also include or be influenced by other surrounding tissue. Due to the wavelengths being larger than the structures being imaged, wave guidance effects may be induced, impacting the wave propagation through the ovary.
We also acknowledge that our ultrasound measurements are planar (2D) measurements, while wave propagation occurs in 3D. Due to this limitation, SW velocity measurements were made along both the width and length of the ovary to better characterize wave propagation in all planes. Future work combining MR and ultrasound elastography, as well as modeling (e.g., finite element analysis), is needed to provide additional insight into these limitations. Despite these limitations, the observed differences in the SW velocity within the ovary provide useful information about the mechanical properties broadly, even if the direct relationship to specific mechanical properties, such as shear modulus or tissue structure, is unclear at this time.
Conclusions
In this study, we utilized SW ultrasound elastography to evaluate the material properties, such as the mechanical properties of bovine ovaries ex vivo. We demonstrated, for the first time, a difference in mechanical properties, as interpreted from SW velocity, between the cortex and medulla, and that the spatial distribution and magnitude of SW velocity vary between two anatomical planes, length and width. There is a need to standardize how measurements of soft tissue properties are made and reported and an urgent need to develop a unifying theory to relate measurements of tissue mechanics between modalities and across length scales.
Further research, including mathematical modeling and development of hydrogel phantoms, is needed to develop models to accurately convert between SW velocity and conventional measures of mechanical properties (e.g., Young's modulus, shear modulus, tensile strength) that are commonly reported for biological tissues and new biomaterials for tissue engineering applications. Wood et al. used simple bulk agarose hydrogels as phantoms to calibrate SW propagation against more traditional modalities. 31 Newer phantoms with more complex and biomimetic compositions and microarchitectures, 65 uniquely enabled by emerging fabrication technologies like 3D bioprinting, are likely to advance our knowledge. There is also an opportunity to combine SW ultrasound elastography with other complementary imaging techniques, including second harmonic generation, as has been done with prostate biopsies, 66 to gain new insights into how the structure and organization of ECM proteins contribute to the mechanical properties of tissues. Finally, SW ultrasound elastography data could be used to build three-dimensional (3D) maps of SW velocity and compared to 3D maps of ECM proteins 67 to interrogate how matrix composition influences SW propagation.
Applications to tissue engineering
The ability of SW ultrasound elastography to resolve spatial heterogeneities in mechanical properties without the need for sample processing would enable broad use of the technology to interrogate material properties of biomaterials and tissues in many diverse applications. One could imagine SW ultrasound elastography being applied throughout the tissue engineering design continuum. During the initial design phase, SW ultrasound elastography could be used to probe the material properties of the target tissue and be used on a suite of engineered biomaterial scaffolds to select the most appropriate material for the given application. For downstream functional assessment, SW ultrasound elastography could be used to noninvasively monitor in vivo remodeling of the engineered tissue after implantation. Without the need to remove the engineered tissue construct, the same tissue construct transplanted into one animal could be evaluated over time, thereby reducing animal use and saving rare or precious engineered tissue constructs, compared to sacrificing animals at various timepoints and performing histology.
Clinical applications
Ultrasound is a standard part of adult obstetrics and gynecology (OB/GYN) practice, and as a result the technology was quickly adopted for diagnosis and prognosis in OB/GYN. SW ultrasound elastography is more invasive than MR elastography as it typically requires a transvaginal transducer to image the ovaries, but transvaginal ultrasonography is commonly used and well tolerated by patients. SW ultrasound elastography is cheaper, faster, and easier to access than MR elastography, which is only available at a few academic medical centers.68,69 As another benefit, elastography of the ovaries through the transvaginal approach is less likely to be limited by increased body habitus. 70 The higher clinical impact of SW ultrasound elastography is evident by the eight ultrasound-based studies reporting use of elastography for evaluation of the ovaries compared to one MR-based article. MR elastography is still the preferred method for evaluation of ovarian tissue in pediatric patients, 31 where the transvaginal approach is inappropriate, although some groups have had success with transabdominal SW ultrasound elastography of the ovary. 59
We expect to see SW ultrasound elastography continue its role in the diagnosis of adnexal masses,39,56,59 thereby reducing the need for unnecessary surgical procedures and in the prognosis of ovarian cancer.56,57 It remains inconclusive if a difference in SW propagation exists between ovaries from women with PCOS and normally ovulating women.40,58 Additional studies are required to determine what, if any, utility SW ultrasound elastography has in the diagnosis of PCOS. We speculate that “mechanical phenotyping,” or stratifying patients based on different patterns of SW propagation, may be useful for the prognosis of PCOS. Furthermore, we anticipate that SW ultrasound elastography will be used increasingly as part of the standard work-up for infertility and fertility preservation counseling since ovarian tissue stiffness has been an implication in oocyte quality. 21 SW ultrasound elastography has also been applied to other nonovarian gynecologic pathologies, such as adenomyosis,71–74 fibroids,72,74 endometrial cancer, 75 cervical cancer,76,77 pelvic floor disorders,78,79 cervical insufficiency,80–82 and preterm delivery. 83
Simultaneous advances in our understanding and interpretation of SW ultrasound elastography from basic science and engineering to clinical medicine are expected to contribute to our understanding of and ability to model tissue structure and function in health and disease and to improve patient care, by improving diagnosis and prognosis in a noninvasive way.
Footnotes
Acknowledgments
The authors thank Sarah Wagner for her support in acquiring the bovine tissues, Camille Mulcahy of the Reproductive Science Histology Core, Center for Reproductive Science, and Chelsea Rugel for her technical support with image processing in MATLAB.
Author's Contributions
S.S.M.L. and E.S.G. designed the experiments. E.S.G., G.A.A., and S.J.M. collected the data. K.L.J. developed the MATLAB program for ultrasound image analysis. E.S.G., K.L.J., S.S.M.L., and T.K.W. performed data analysis and interpretation of results. E.S.G., K.L.J., S.S.M.L., and T.K.W. wrote this article. S.S.M.L and T.K.W. oversaw the project as principal investigators.
Disclosure Statement
The authors declare no financial interests.
Funding Information
This work was funded by the National Institutes of Health, National Institute of Aging (NIA) F30 AG058387–0 (E.S.G.) and the Thomas J. Watkin's Memorial Professorship (T.K.W.). ESG was also supported by NIH-NIGMS training grant T32GM008152.
References
Supplementary Material
Please find the following supplemental material available below.
For Open Access articles published under a Creative Commons License, all supplemental material carries the same license as the article it is associated with.
For non-Open Access articles published, all supplemental material carries a non-exclusive license, and permission requests for re-use of supplemental material or any part of supplemental material shall be sent directly to the copyright owner as specified in the copyright notice associated with the article.