
Abstract
Biological scaffold is a popular choice for the preparation of tissue-engineered organs and has the potential to address donor shortages in clinics. However, biological scaffolds prepared by physical or chemical agents cause damage to the extracellular matrix (ECM) by potentially inducing immune responses after implantation. The current study explores the fate of the decellularized (DC) scaffolds using a cocktail of chemicals following implantation without using immunosuppressants. Using the syngeneic (Lewis male–Lewis female) and allogeneic (Brown Norway male–Lewis female) models and different tissue routes (subcutaneous vs. omentum) for implantation, we applied in-depth quantitative proteomics, genomics along with histology and quantitative image analysis tools to comprehensively describe and compare the proteins following DC and postimplantation. Our data helped to identify any alteration postdecullarization as well implantation. We could also monitor route-specific modulation of the ECM and regulation of the immune responses (macrophage and T cells) following implantation. The current approach opens up the possibility to monitor the fate of biological scaffolds in terms of the ECM and immune response against the implants. In addition, the identification of different routes helped us to identify differential immune responses against the implants. This study opens up the potential to identify the changes associated with chemical DC both pre- and postimplantation, which could further help to promote research in this direction.
Impact Statement
The development of a biological scaffold helps in the preparation of a functional organ in the clinics. In the current study, we develop a strategy for chemical decellularization and explored two different routes to understand the differential responses elicited postimplantation. The use of sensitive protein and genomic tools to study the changes creates a favorable environment for similar efforts to develop and characterize biological scaffolds before further trials in the clinics. The current study, which was carried out without any immunosuppressive agents, could help to establish (a) appropriate chemical strategies for preparing biological scaffolds as well as (b) identify putative implantable routes to circumvent any adverse immune reactions, which will ultimately decide the outcome for acceptance or rejection of the scaffold/implant.
Introduction
Synthetic grafts and native blood vessels are often used as a conduit for revascularization strategy as a regenerative measure or tissue engineering approach to create functional blood vascular scaffold. The initial development of blood vascular scaffold 1 and refinement in terms of rapid endothelialization and extracellular matrix (ECM) deposition 2 has helped tissue engineering technique to develop successful blood vessels with minimum thrombosis, inflammation, and scaffold acceptance.3,4 Despite the inherent drawbacks, biological scaffold prepared by decellularization (DC) technology has been successfully used to recreate various types of tissues and organs, with an approach to repopulate with patient's cells to produce a personalized vascular scaffold.4,5
The usual chemical procedure used for the development of acellular biological scaffold (DC technology) has been reported to damage the extracellular matrix (ECM) 6 and elicit immunological reaction and incompatibility with limited mechanical tolerance.7,8 However, natural vascular scaffolds in comparison to synthetic scaffolds have certain advantages, such as natural binding routes for cell adhesion (conserved native three-dimensional structure), improved biomimetic and biocompatibility stimulating colonization, promoting the proliferation of recruited cells. Remodelling of autologous vascular scaffolds in vivo, which acquired native tissue architecture with the maintenance of smooth muscle cells, ECM organization, and endothelial cells have been reported.4,9
The selection of scaffold implantation routes with unique cellular niches and different blood supply, for example, subcutaneous (SC) and omentum (O), has been reported to support a variety of free structures for reconstructive purposes.10–12 The uniqueness of the two routes for implantation has earlier been documented with the O richer in blood supply, 13 whereas the SC route is associated with low oxygen tensions. 14
Implantation of a biomaterial and its degraded by-product induces an immune reaction in the host, which determines the final integration and the biological performance of the implant.15,16 The nature of the host immune cells, for example, macrophages, depends on the biomaterials influencing the outcome of the tissue-specific innate and adaptive immune responses. 17 A modern scientific tool to assess biological scaffold includes mass spectrometric-based quantitative proteomic analysis and bioinformatics prediction to identify and analyze proteins of the ECM 18 as well as an immune response after transplantation. 19
During the study, we developed approaches to prepare chemically DC scaffolds and study the fate of scaffolds following implantation by proteomics and immunohistological tools to monitor changes associated with ECM proteins as well as identify immune cell markers. The findings from our study could help us to better understand the remodeling of the implant because of the putative interaction between the ECM and the immune infiltrating cells as well as selection of an alternative source of implantation to minimize adverse immune reactions postimplantation.
Materials and Methods
All reagents used were of analytical grade. The antibodies used are summarized in Supplementary Tables S1 and S2.
All animal work followed the accepted guidelines reviewed by the local animal welfare committee at the University of Gothenburg (Göteborgs Djurförsöksetiska Nämnd, Ethical Number, 151/14). Lewis and Norwegian Brown donor male, and Lewis female recipient rats (2–2.5 months of age, weight ≈180–220 g; Janvier Labs, Saint Berthevin Cedex, France) were housed and bred with food and water ad libitum at the Gothenburg University Experimental Biomedicine Center. A 1-week acclimatization period was given to the experimental rats to prevent stress-induced disease. In addition to the animal groups mentioned above, we also prepared a SHAM group (SHAM group are operated animals which served as surgical control) consisting of female rats of the same age as the recipient animals. The SHAM female Lewis rats were prepared for surgery similar to the recipient Lewis rats but without implantation.
These rats were sacrificed at the same time points as the other recipient groups and used for comparison of the serum cytokine (proteome profiler status). Details of animal handling and operation are included in the Supplementary Data S1.
Chemical DC procedure of donor aorta
The DC steps were performed as reported earlier 20 at room temperature (20–24°C) with slight modifications using a closed-circuit system to minimize contamination. Each DC cycle consisted of a 7-h treatment with 0.2% sodium deoxycholate (SDC) (Sigma-Aldrich, St. Louis, MO) with an alternate cycle of 7- to 8-h treatment with glycerol mix solution (10% glycerol, 0.9% sodium chloride, and 2 mM sodium ethylenediaminetriacetic acid, Sigma-Aldrich) with a wash with distilled water in between to remove cell debris as shown schematically in Figure 1. After the DC cycle, washing was performed overnight with sterile water using an open system to drain out the wash continuously.
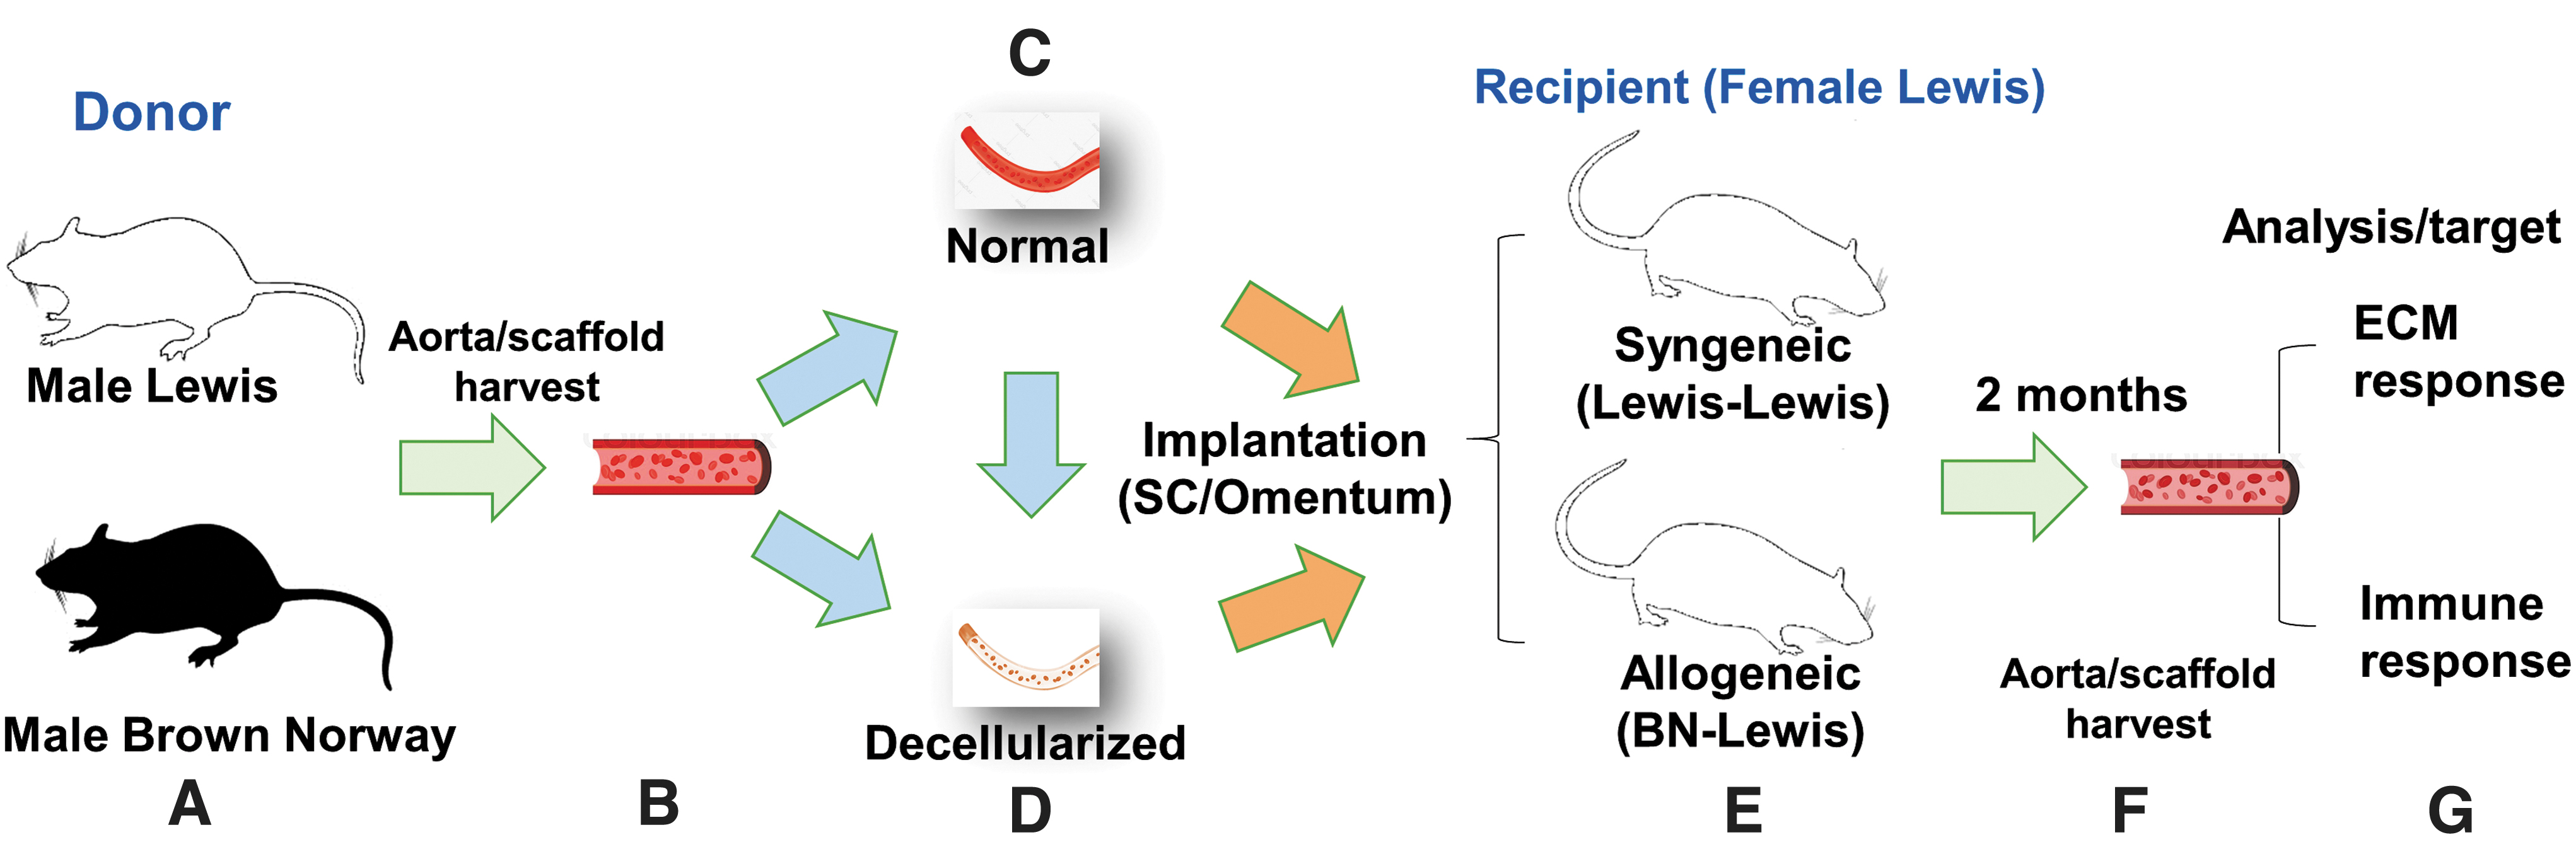
The experimental design and layout of the study. The experimental design is presented in a sequential layout
Subsequently, the chemically DC aortas were treated with 900 U (25 μg/mL DNase I recombinant, RNase free, Cat. No. 4716728001; Roche, Merck KGaA, Darmstadt, Germany) using a total of 3 DNase treatments for 2 h each to achieve the desired level of DNA assessed by the Quant-iT™ PicoGreen™ dsDNA Assay Kit (Cat. No. P7589) and Hematoxylin and Eosin (H&E) staining. A total of 5 cycles was given to achieve DC as assessed from DNA load and H&E staining. The DC and normal (untreated) scaffolds were subsequently sterilized before implantation of DC scaffolds as outlined in the Supplementary Data S1.
Implantation and postimplantation biochemical study
The Lewis female recipient rats (n = 6) were used for the implantation study. The nomenclature of the preimplant scaffolds, as well as implants, is outlined below.
The preimplant syngeneic normal (syn-N) and allogeneic normal (allo-N) scaffolds were used to prepare preimplant DC scaffolds, syn-DC, and allo-DC. Unless otherwise stated, syn-N and allo-N are referred to as N scaffolds; syn-DC and allo-DC are referred to as DC scaffolds, respectively, throughout the text and also in figure legends. The chemically DC scaffolds were used for implantation. The implants are named according to the genetic origin (syngeneic [syn-] and allogeneic [allo-]) and routes of implantations (SC or O). The Lewis (donor) to Lewis (recipient) is designated as syn-, whereas Brown Norway (donor) to Lewis (recipient) is designated as allo-. The syngeneic implants are: at the (a) SC route—syn-DC SC and (b) O route—syn-DC O; allogeneic implants are: at the (a) SC route—allo-DC SC and (b) O route—allo-DC O.
Processing of samples
The normal scaffolds (syn-N and allo-N), DC scaffolds (syn-DC and allo-DC), SHAM and implants (≈3–4 mm) each were stored separately for (i) proteomics and DNA, which was snap frozen in liquid nitrogen and stored at −150°C; (ii) for gene expression, each were stored with RNALater™ at −80°C, (iii) histological analysis (≈6 mm) were immediately fixed in formalin and the serum samples were prepared from collected blood and stored at −20°C for further analysis.
Histological assessment
Tissue processing and staining
The syn-N, allo-N, syn-DC, allo-DC scaffolds and syn-(DC SC and DC O) and allo-(DC SC and DC O) implants (collected from SC and O sites from the recipient rats) were fixed in formalin for a period of 48 h before paraffin embedding and sectioning at 4 μM thickness. The sections were finally processed for H&E staining and immunohistochemical localization of different protein targets (ECM and immune cells) as outlined in the Supplementary Data S1. The sections were also stained using a Masson's Trichrome Stain Kit (Cat. No. 25088-1; Polysciences) according to the manufacturer's instructions (collagenous materials stained blue). In addition, the sections were stained for elastin using the Elastic Stain Kit (Cat. No. HT25A; Sigma). Elastic materials (elastin) are stained black to blue black.
The area covered by blue (collagen) and black (elastin) was analyzed from pipelines developed as outlined in the Supplementary Data S1.
Histological score of the DC aorta
The H&E-stained sections were evaluated for structural integrity (architectural preservation), inflammatory, fibrosis, and necrosis score blindly by a pathologist (A.K.) using a Comprehensive method of masking tissues 21 with individually labeled slides followed by Ordinal Data Measurements. 22
Architectural score
The semiquantitative evaluation of the tissue architecture was performed using a scoring system represented as (1) complete breakdown of tissue, (2) marked disruption, (3) moderate disruption, (4) minimal disruption, and (5) no damage to cellular architecture. 22
Inflammatory, fibrosis, and necrosis score
To monitor the degree of inflammation, fibrosis, and necrosis, a simple scoring system was developed based on the following scoring criterion—(i) absent/none-0, (ii) mild/weak-1, (iii) moderate-2, and (iv) severe/strong-3. Qualitative assessment for the type of inflammatory cells was also monitored.
Immunohistochemical assessment
Formalin-fixed paraffin sections (4 μM) were deparaffinized and the target protein was probed by primary and secondary antibodies before being subjected to image acquisition and analysis as outlined in the Supplementary Data S1. The overlapped images at 20 × magnification, and for clarity and localization of cells 40 × magnification has been presented.
Proteomic analysis
For proteome analysis, 3–4 mm of scaffolds and implants were used. In total, eight groups were selected for proteomic analysis (syn-N, allo-N, syn-DC, allo-DC, syn-DC SC, syn-DC O, allo-DC SC, and allo-DC O). Details are outlined in Supplementary Data S1.
Briefly, samples were digested with the filter-aided sample preparation method 23 and peptides were labeled using Tandem Mass Tag (TMT) 11-plex isobaric reagents (Thermo Fisher Scientific, Waltham, MA) according to the manufacturer's instructions. Mass spectrometry (MS) analyses were performed on an QExactive HF mass spectrometer equipped with Easy-nLC 2000 (Thermo Fisher Scientific) using a gradient from 7% to 35% B over 76 min followed by an increase to 100% B for 8 min at a flow of 300 nL/min followed by MS2 data-dependent acquisition method. Identification and relative quantification were performed using Proteome Discoverer™ version 2.2 (Thermo Fisher Scientific).
Gene expression analysis: calculation of target gene
RNA quantification and droplet digital PCR
Tissue samples (scaffolds/implants) stored at −80°C in RNAlater Stabilization Solution (Cat. No. AM7021; Thermo Fisher Scientific) were used for analysis of RNA isolation and quantification by droplet digital PCR (ddPCR). The input RNA (ng) was calculated initially from the theoretical input RNA (ng) and reference, β-actin copy number as elaborated. 24 Details outlined in the Supplementary Data S1.
XY chromosome quantification identifications of the resident cells around the implant
The infiltrating cells in the implants were identified for their origin, that is either of the donor (male) or recipient (female) and expressed as percentage copies of the Y chromosome by ddPCR. Details of XY chromosome primers and amplification are outlined in the Supplementary Data S1.
Proteome profiler of cytokines present in serum
Cytokine arrays were used to find semiquantitative data of cytokines and chemokines in serum as an index of the immune response in the recipient rats following scaffold implantation and compared with SHAM treatment. Details outlined in Supplementary Data S1.
Statistical analysis
Data were statistically analyzed using GraphPad Prism version 8.4 (GraphPad Software, La Jolla, CA) and R statistical language. Differences between the two groups were analyzed and p-values below 0.05 were considered statistically significant. The statistical analysis carried out in each experiment is defined in the corresponding figure legends. Details are outlined in Supplementary Data S1.
Results
The experimental setup is shown depicting the overall strategy for the preparation of scaffolds and the implants (Fig. 1).
DC strategy: modulation of scaffolds following implantation
Chemically DC scaffolds (syn-DC and allo-DC) from normal (syn-N and allo-N) scaffolds with the DNA content found to be below 10 ng, which was significantly at a lower level (syn-DC—*p < 0.05 and allo-DC—**p < 0.01) compared with the corresponding syn-N and allo-N scaffolds (Fig. 2).
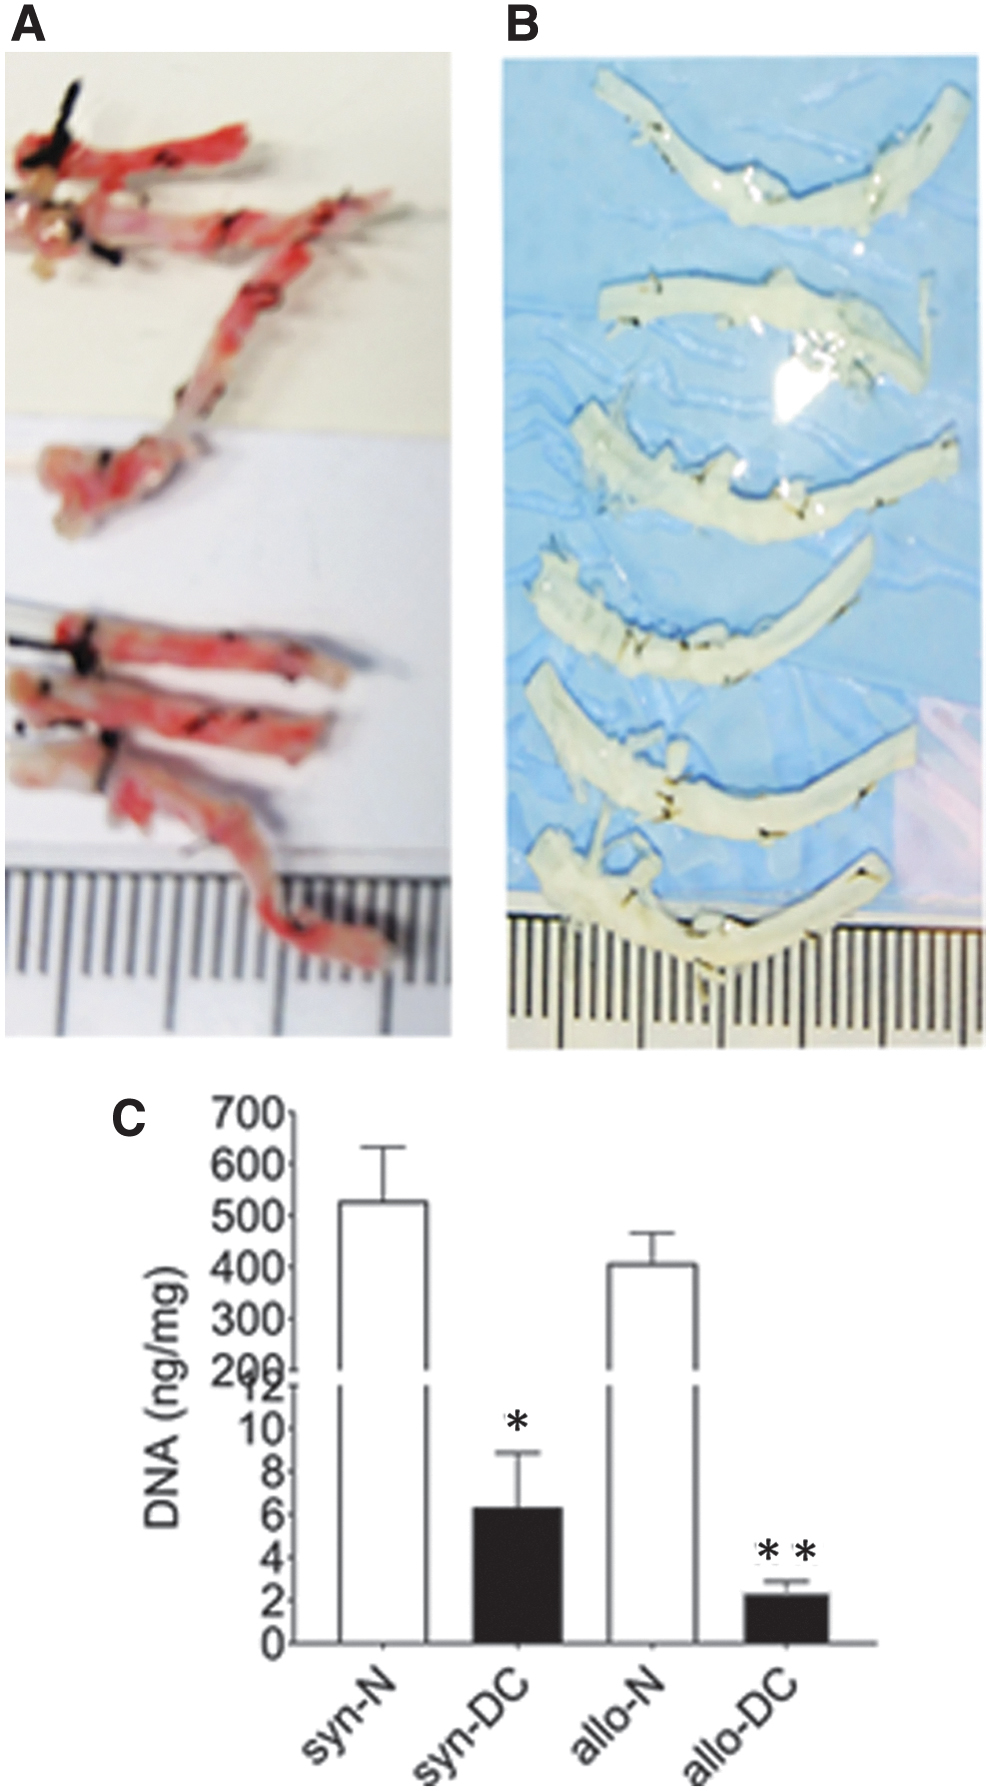
Measurement of DNA load after decellularization. The normal (syn- and allo-) scaffolds obtained under a syn- and allo- model of implantation
The tissue architecture score (Fig. 3A, B) of the DC scaffolds (syn-DC and allo-DC) and implants (syn-DC SC and allo-DC SC) were similar to the N scaffolds (syn-N and allo-N). However, the tissue architecture of the DC O implants was significantly lesser (syn-DC O-50%, ***p < 0.001 and allo-DC O-43.33%, **p < 0.01) than the syn-N and allo-N scaffolds. The syn-DC O (***p < 0.001), allo-DC SC (*p < 0.05) and allo-DC O (***p < 0.001) implants also showed significantly higher levels of inflammatory cells mainly lymphocytes with evidence of a few giant cells compared with the respective syn-N and allo-N scaffolds (Supplementary Figs. S1 and S2), which were later characterized immunohistologically mainly to be macrophages (Figs. 8–10). Although there was no evidence of any significant fibrosis, most of the implants showed significant necrosis (*p < 0.05). The allo-DC O implants showed the most extensive necrosis (**p < 0.01) (Supplementary Fig. S2).
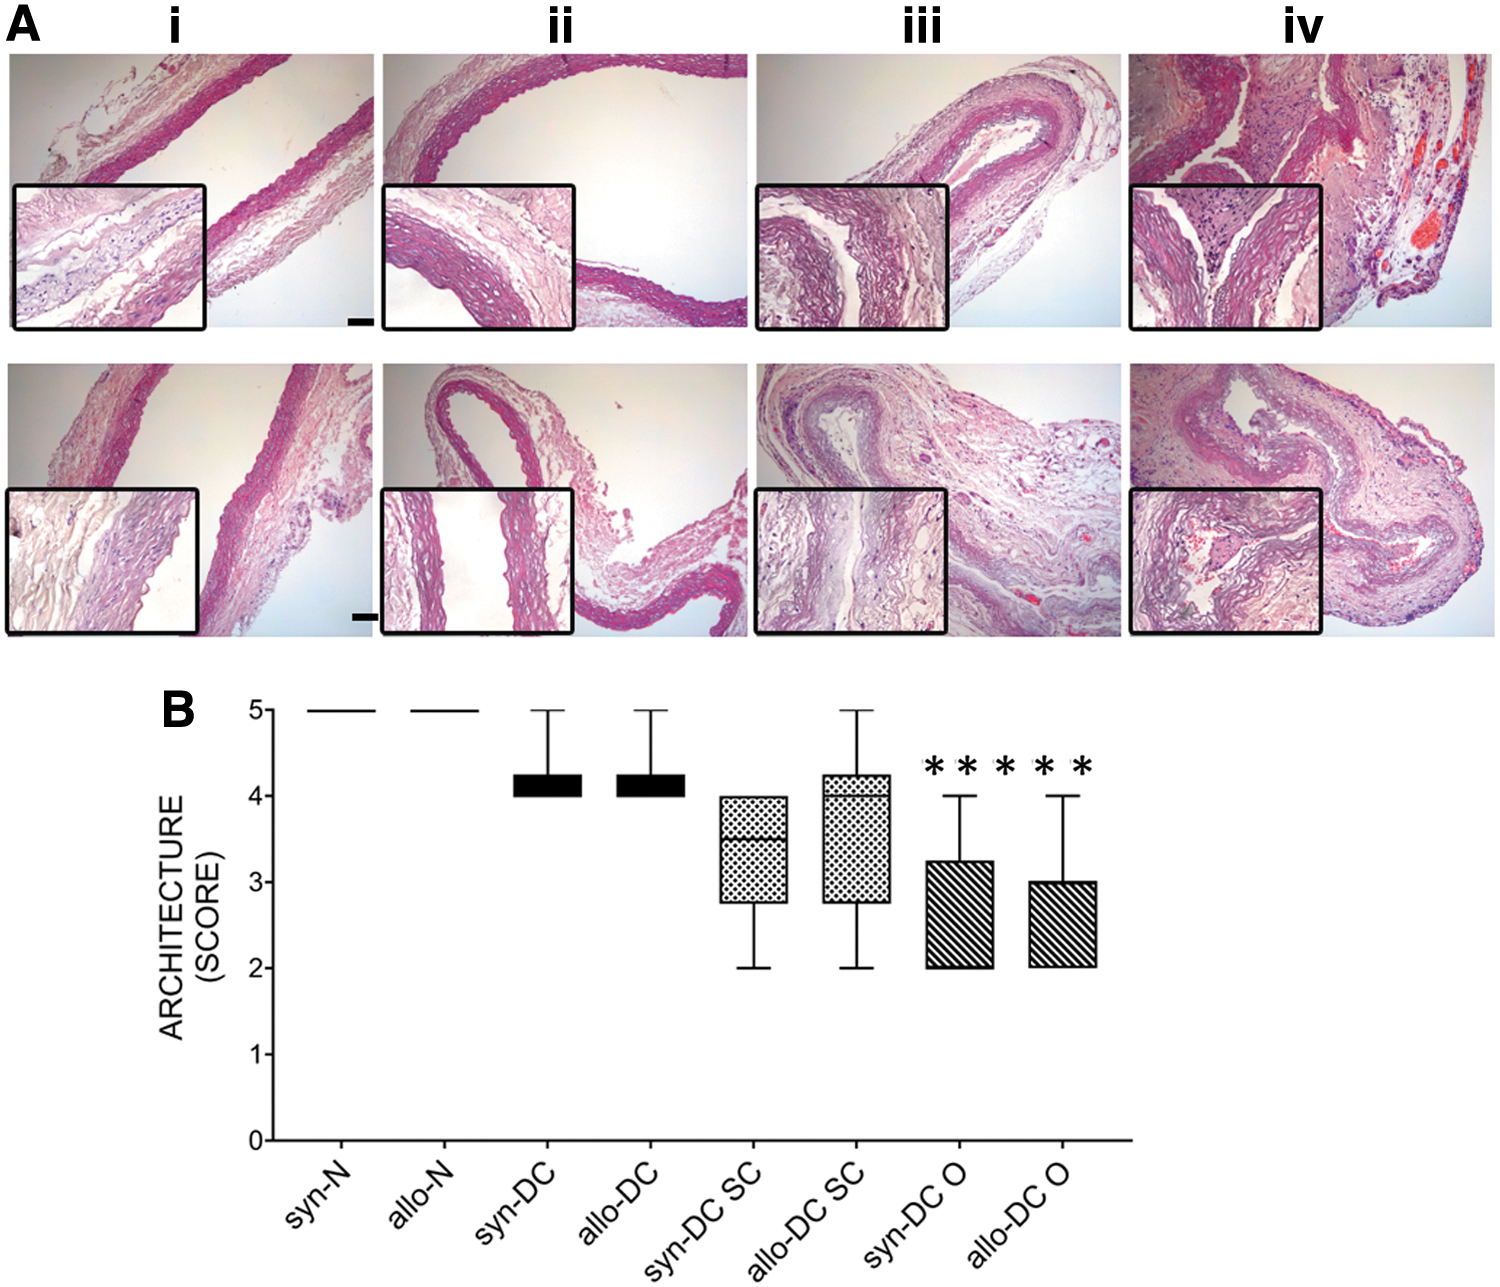
H&E staining of normal and decellularized control scaffolds and implants. The tissue architecture was studied after H&E staining of syn-N and allo-N scaffolds, syn-DC, allo-DC scaffolds, and different syngeneic and allogeneic decellularized implants placed at subcutaneous (syn-DC SC and allo-DC SC) and omentum (syn-DC O and allo-DC O) routes after 2 months of observation.
Furthermore, to confirm the identity of infiltrating cells (male vs. female), the presence of X and Y-chromosome was monitored by ddPCR analysis, which revealed negligible donor male cells (Y-chromosome) suggestive of infiltration by recipient cells (Supplementary Fig. S3).
Proteomic analysis of syn- and allo- scaffolds following implantation
To study the differential expression of the protein after implantation, the syn-N, allo-N, syn-DC and allo-DC scaffolds, and implants (syn-DC SC, allo-DC SC, syn-DC O, and allo-DC O) were subjected to 11-plex TMT-based liquid chromatography-mass spectrometry-based proteomic analysis (Supplementary Fig. S4A, B). A total of 2115 proteins were identified with 1% false discovery rate and used for downstream analysis (Supplementary Table S3; Supplementary Fig. S4C). The proteins were further analyzed for the nature and reproducibility of the transplanted samples wherein we performed a principal component analysis (PCA) of the normalized protein intensity data. The implanted groups showed clear differentiation in PCA space with regard to both the route (SC and O) and the nature of transplantation (syn- or allo-) due to homology and unique specificity (Supplementary Fig. S4B).
The identified proteins also showed excellent reproducibility between replicate runs between the route and nature of implantation (Supplementary Fig. S4D). The N and DC samples of both syn- and allo- implants also significantly correlated among themselves (Supplementary Fig. S4E). The expression pattern for both immune response proteins and ECM was unique for the route (SC vs. O) and genetic background (syn- vs. allo-) of the scaffolds implanted.
Analysis of ECM protein organization after implantation
The expression of ECM proteins was quite distinct in DC implants (Fig. 4; Supplementary Figs. S5A and S6). Both the DC (syn- and allo-) implants shared route-specific homology. ECM proteins were significantly (*p < 0.05) enriched for gene ontology (GO) categories related to the proteinaceous ECM, ECM organization, disassembly, and extracellular fibril organization (Supplementary Fig. S5B). Furthermore, to determine the functional significance of ECM proteins in syn- and allo- setup and to gain new insight into route-specific molecular features, we constructed a functional interaction network with the ECM proteins and visualized them in Cytoscape. Four functional modules or clusters were constructed using the molecular complex detection (MCODE) plugin within Cytoscape (Fig. 4A–D).
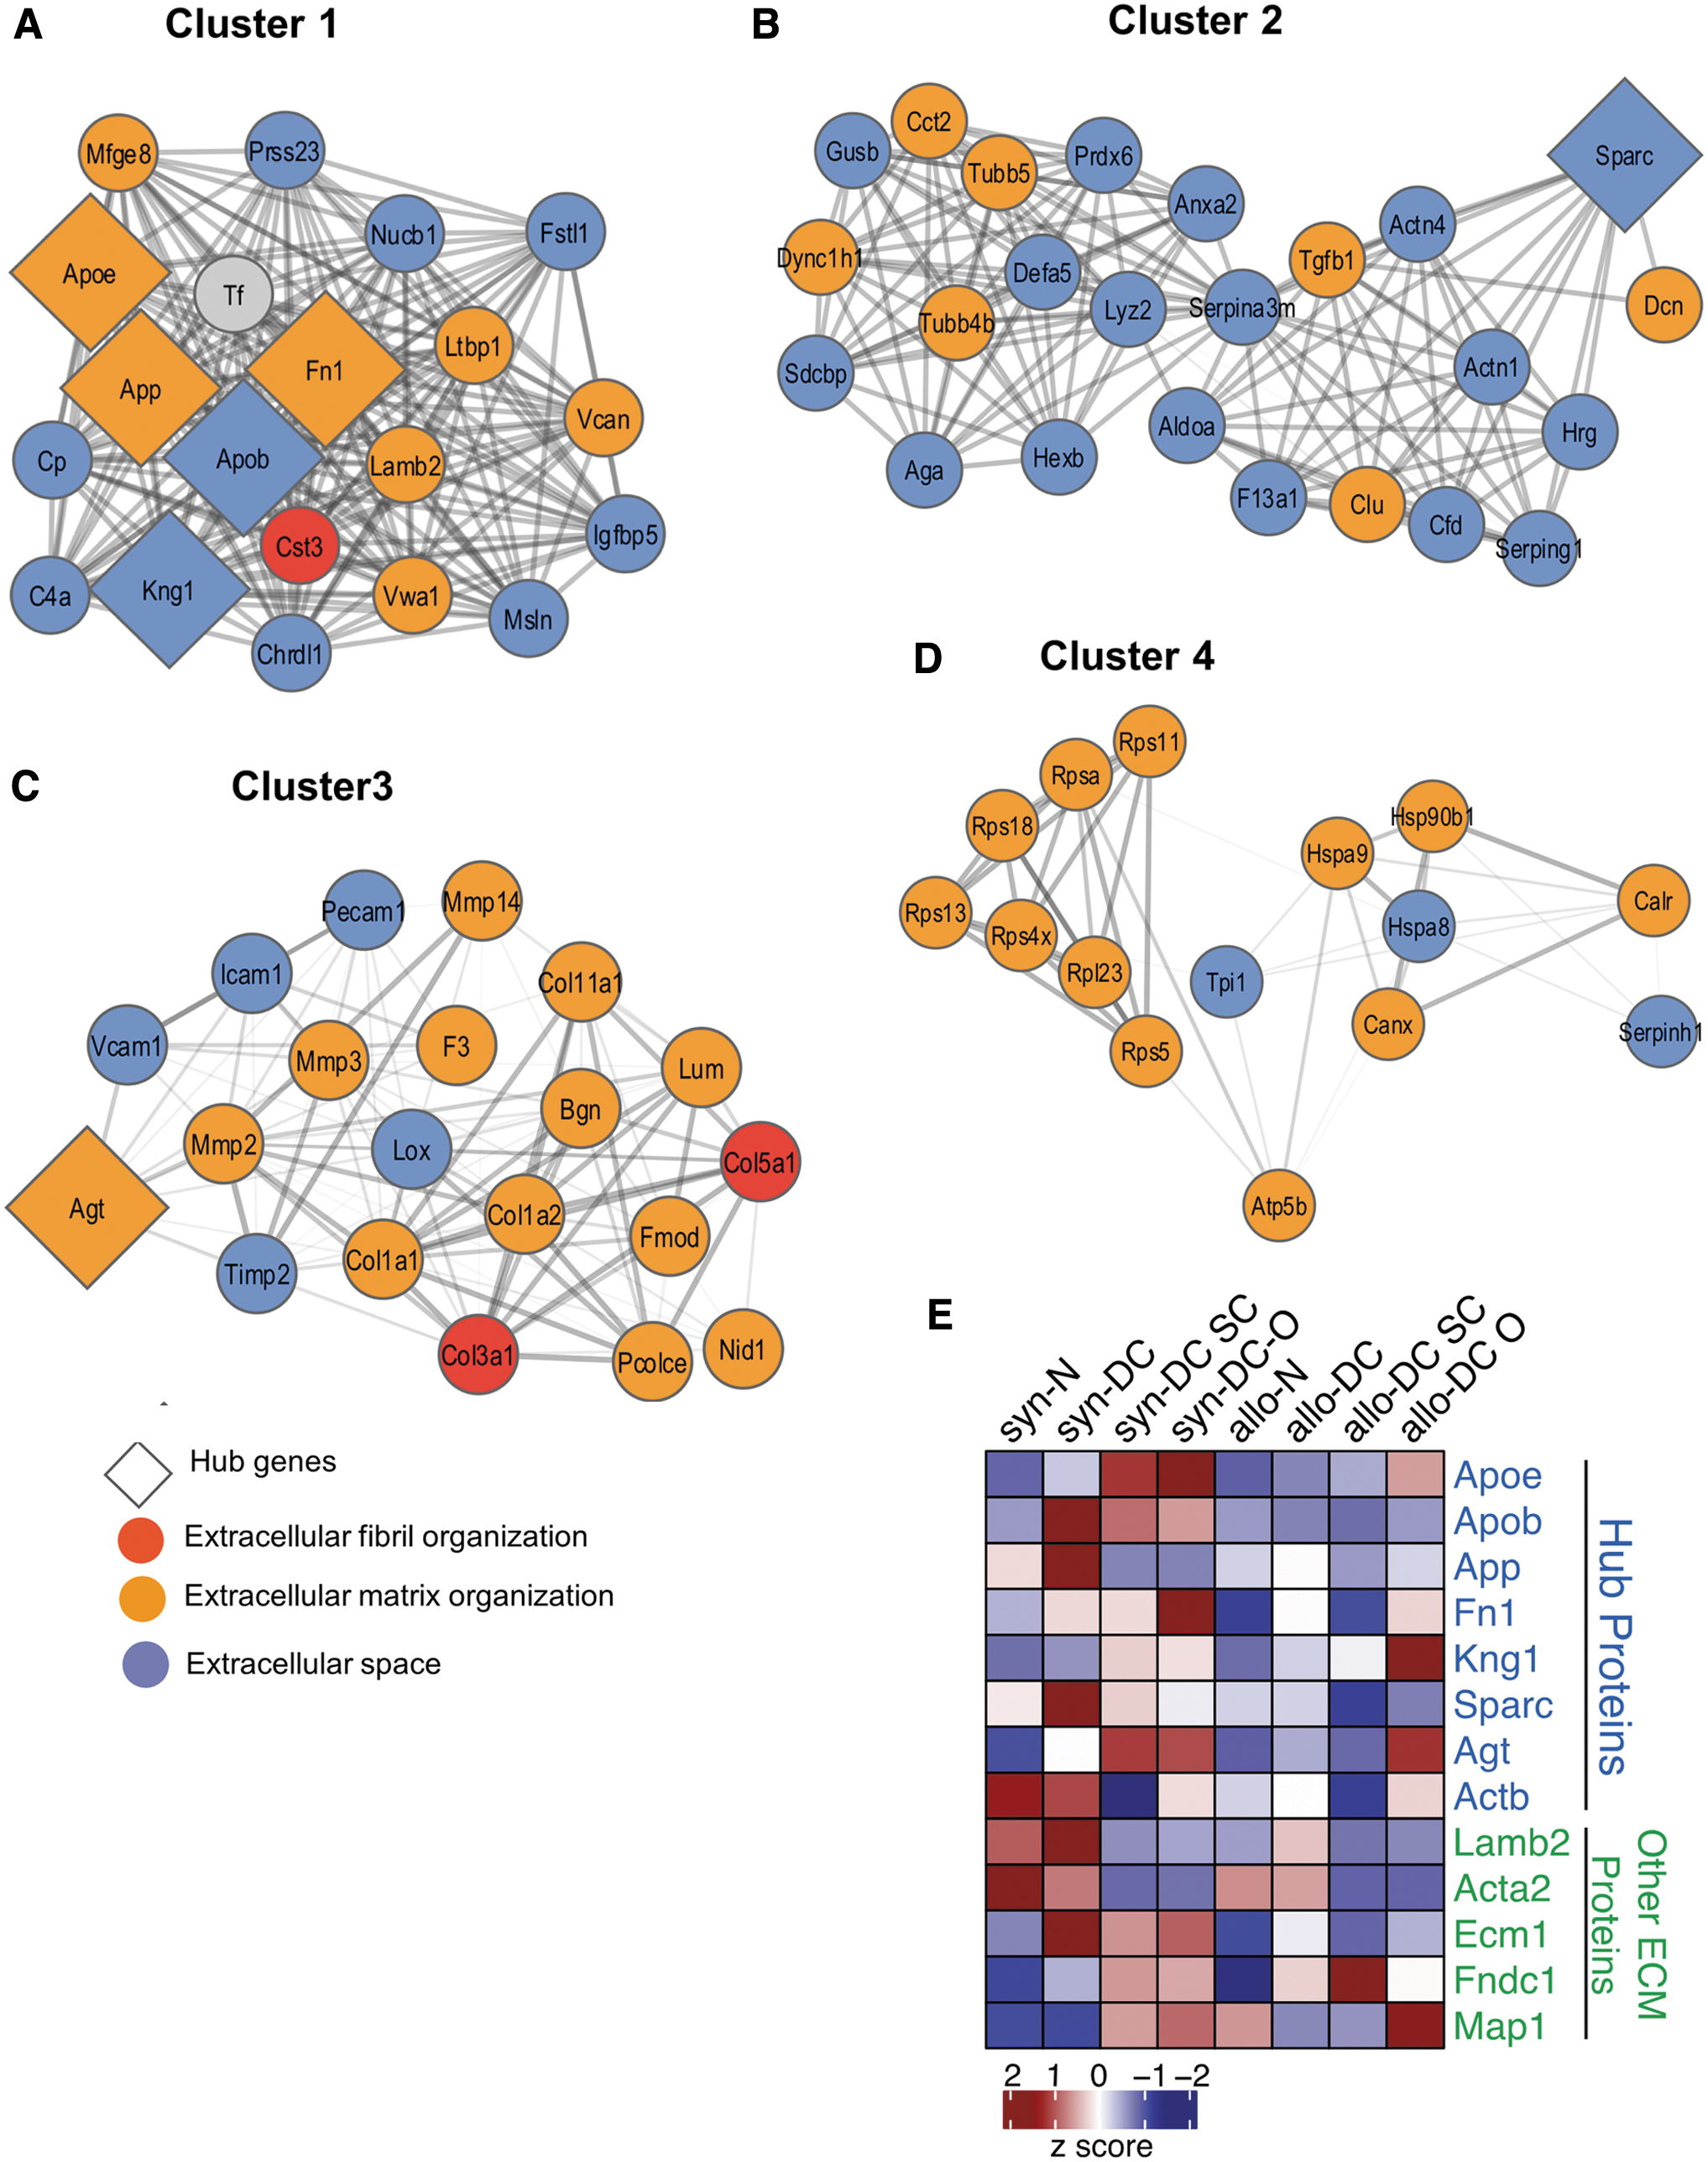
The topological features of the ECM network of the scaffolds and implants. The PPI network of the 8 hub and related proteins, created by querying the proteins enriched for ECM function against the STRING database. The network was exported and visualized using cytoscape. Proteins were then clustered with MCODE algorithm. Hub proteins were identified using Cytohubba app within the Cytoscape
It is evident from the cluster organization that ECM components interact with each other to maintain the ECM stability and integrity in the case of both syn- and allo- implants. In Clusters 1, 2, and 4, ECM proteins interact with extracellular space proteins, whereas in Cluster 3, ECM and extracellular space proteins interact with extracellular fibril organization proteins.
Some of these cluster members have a very dense connection and appear to regulate the cluster function. Ranked by degree and other 12 parameters in Cytohubba 25 and Network Analyzer app within Cytoscape, we identified the top 8 proteins (Apoe, Apob, App, Fn1, Kng1, Sparc, Agt, and Actb) as hub proteins along with four relevant ECM proteins (Lamb2, Acta2, Ecm1, and Fndc1). Cluster 1 is enriched with five of the eight hub proteins (Fig. 4A), whereas Clusters 2 and 3 have one each (Fig. 4B, C). These genes were Apoe, Apob, App, Fn1, Kng1, Sparc, and Agt. The heat map represents the additional hub protein, Actb (Fig. 4E).
The syn-DC SC implants showed significant expression of 6 out of 8 Hub ECM proteins (Apoe, Apob, App, Sparc, Agt, and Actb) as well as 3 additional ECM proteins (Map1, Acta2, and Ecm1). Out of these 9 proteins, 2 proteins were downregulated (App and Actb), whereas the rest of the proteins were upregulated. The allo-DC SC implants showed significant expression for 5 out of 8 Hub ECM proteins (Apob, Fn1, Sparc, Agt, and Actb) as well as 2 additional ECM proteins (Acta2 and Ecm1). However, all of the 7 proteins were downregulated (Supplementary Table S3; Supplementary Figs. S5A, B, and S6).
The DC O implants did not show significant expression for most of the Hub proteins and only 3 proteins were expressed. Apob and Agt were upregulated in syn-DC O implants and Acta2 was downregulated in allo-DC O implants.
Immune protein expression in syn- and allo- implants
The functional interactions of the immune-related proteins were studied from the proteomic data retrieved from the search tool for the retrieval of interacting genes/proteins (STRING) database. Most of the immune responsive proteins showed dynamic expression involved in the regulation of innate immune responses (Supplementary Fig. S5C, D). MCODE analysis revealed the top two clusters for immune-related proteins (Fig. 5A, B).
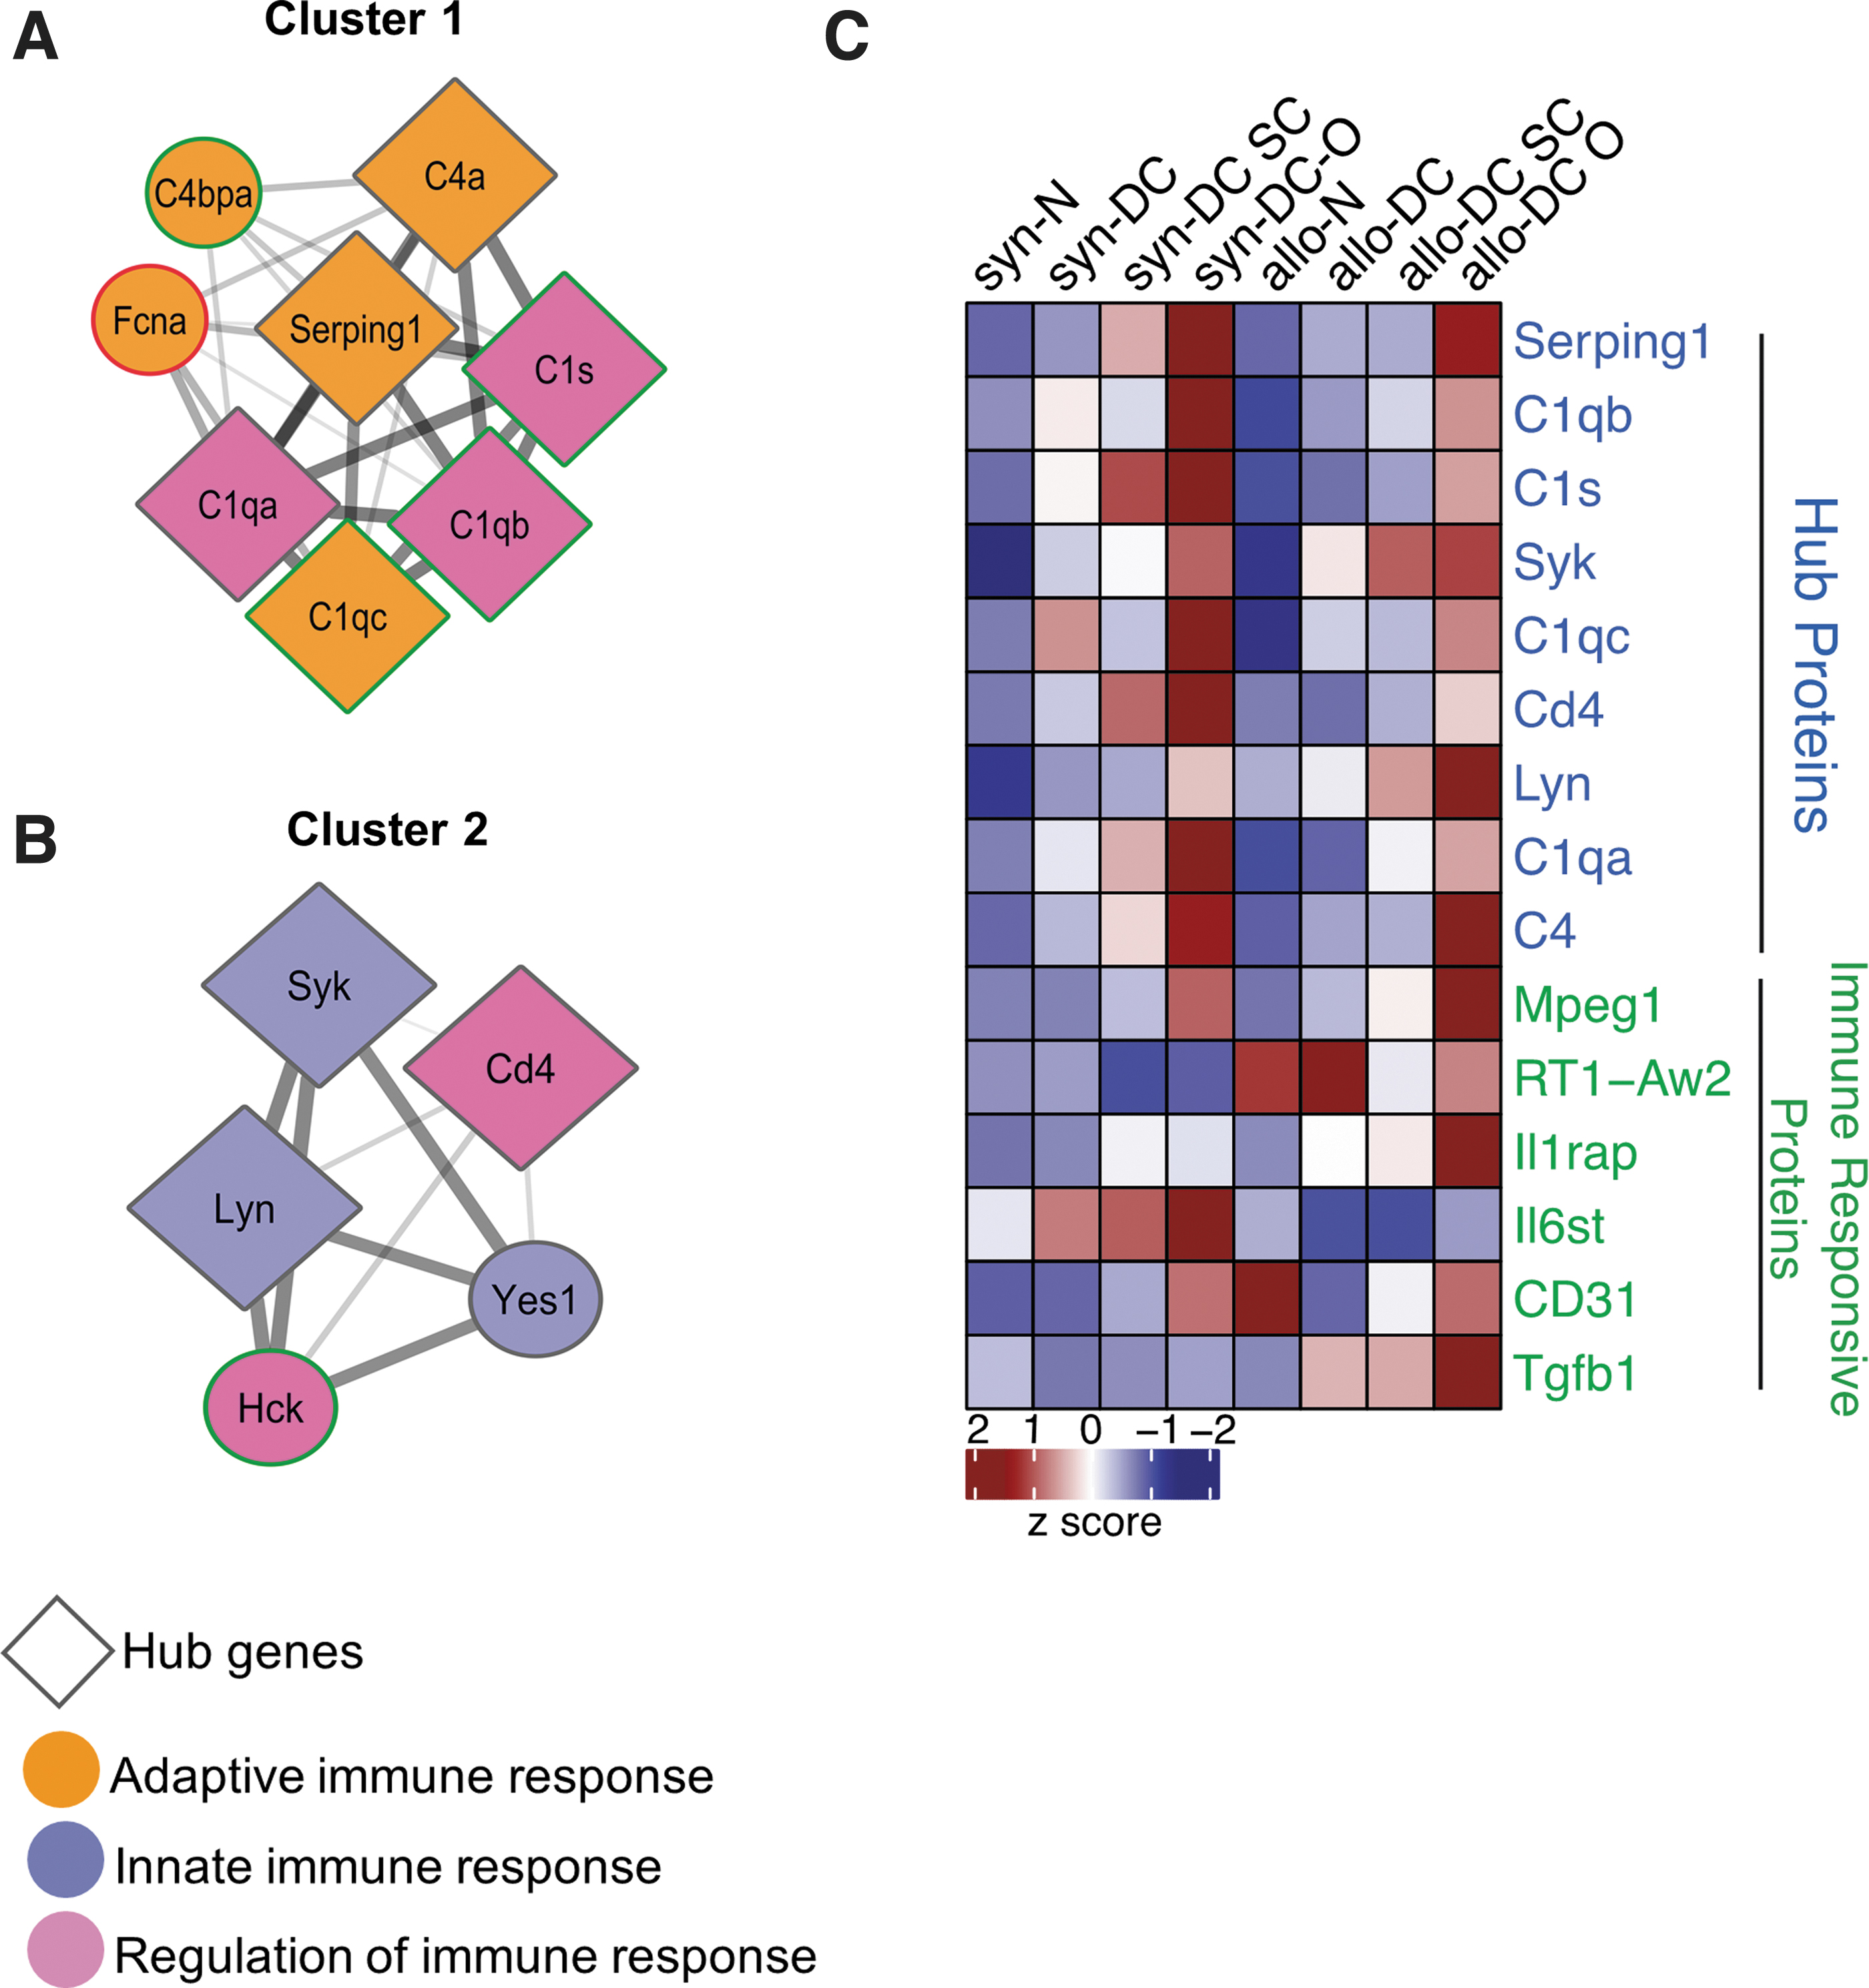
PPI network integration of the immune responsive proteins of the scaffolds and implants. The PPI network was created by quering the proteins enriched for immune function against the STRING database. Network relationships derived from the STRING database were visualized with cytoscape. Proteins were then clustered with MCODE algorithm. Hub proteins were identified using cytohubba app within the cytoscape.
The nine significantly upregulated hub proteins, as revealed by Cytohubba and Network Analyser, were Serping1, C1qb, C1s, Syk, C1qc, CD4, Lyn, C1qa, and C4. The other immune markers identified were Mpeg 1, Rt1-Aw2, Il1rap1, Il6st, Cd31, and Tgfb1. Cluster 1 is enriched with six of the nine hub proteins (Fig. 5A), whereas Cluster 2 has three. In Cluster 1, proteins with adaptive immune response interact with proteins having the function in the regulation of immune response, which, again interact with innate immune responsive proteins in Cluster 2. Out of the 9 significantly expressed HUB proteins, 6 proteins (Serping1, C1qb, C1s, C1qc, C1qa, and C4) were related to the complement system, whereas the rest 3 proteins (Syk, CD4, and Lyn) are involved in B and T cell regulation (Supplementary Figs. S5C, D, and S7).
The expression of immune-related proteins was at a significantly lower level in the syn- and allo-DC SC implants compared with the syn- and allo-DC O implants, except for the protein IL6st (syn-DC SC and allo-DC SC). In the syn-DC O implants-Serping 1, C1s, C1qa, C4, IL6st, and Cd31 and in allo-DC O implants C1qc and Il1rap1 were upregulated, whereas in syn-DC O implants Rt1-Aw2 protein was downregulated (Supplementary Figs. S5C, D, and S7).
Immunohistochemical localization of ECM markers following implantation
Hub proteins from the proteomic analysis included Fibronectin (Fn1), Actin (Actb), and Laminin (Lamb2), which have the potential to regulate the cluster function due to their very dense connection, which correlates also from bioinformatics predictions. Hence, fibronectin, laminin, and alpha-smooth muscle actin (α-SMA) were also further studied by immunohistochemical localization (Fig. 6). In addition, we also stained two important ECM proteins, collagen and elastin, which form an integral component of the ECM (Supplementary Figs. S8 and S9).
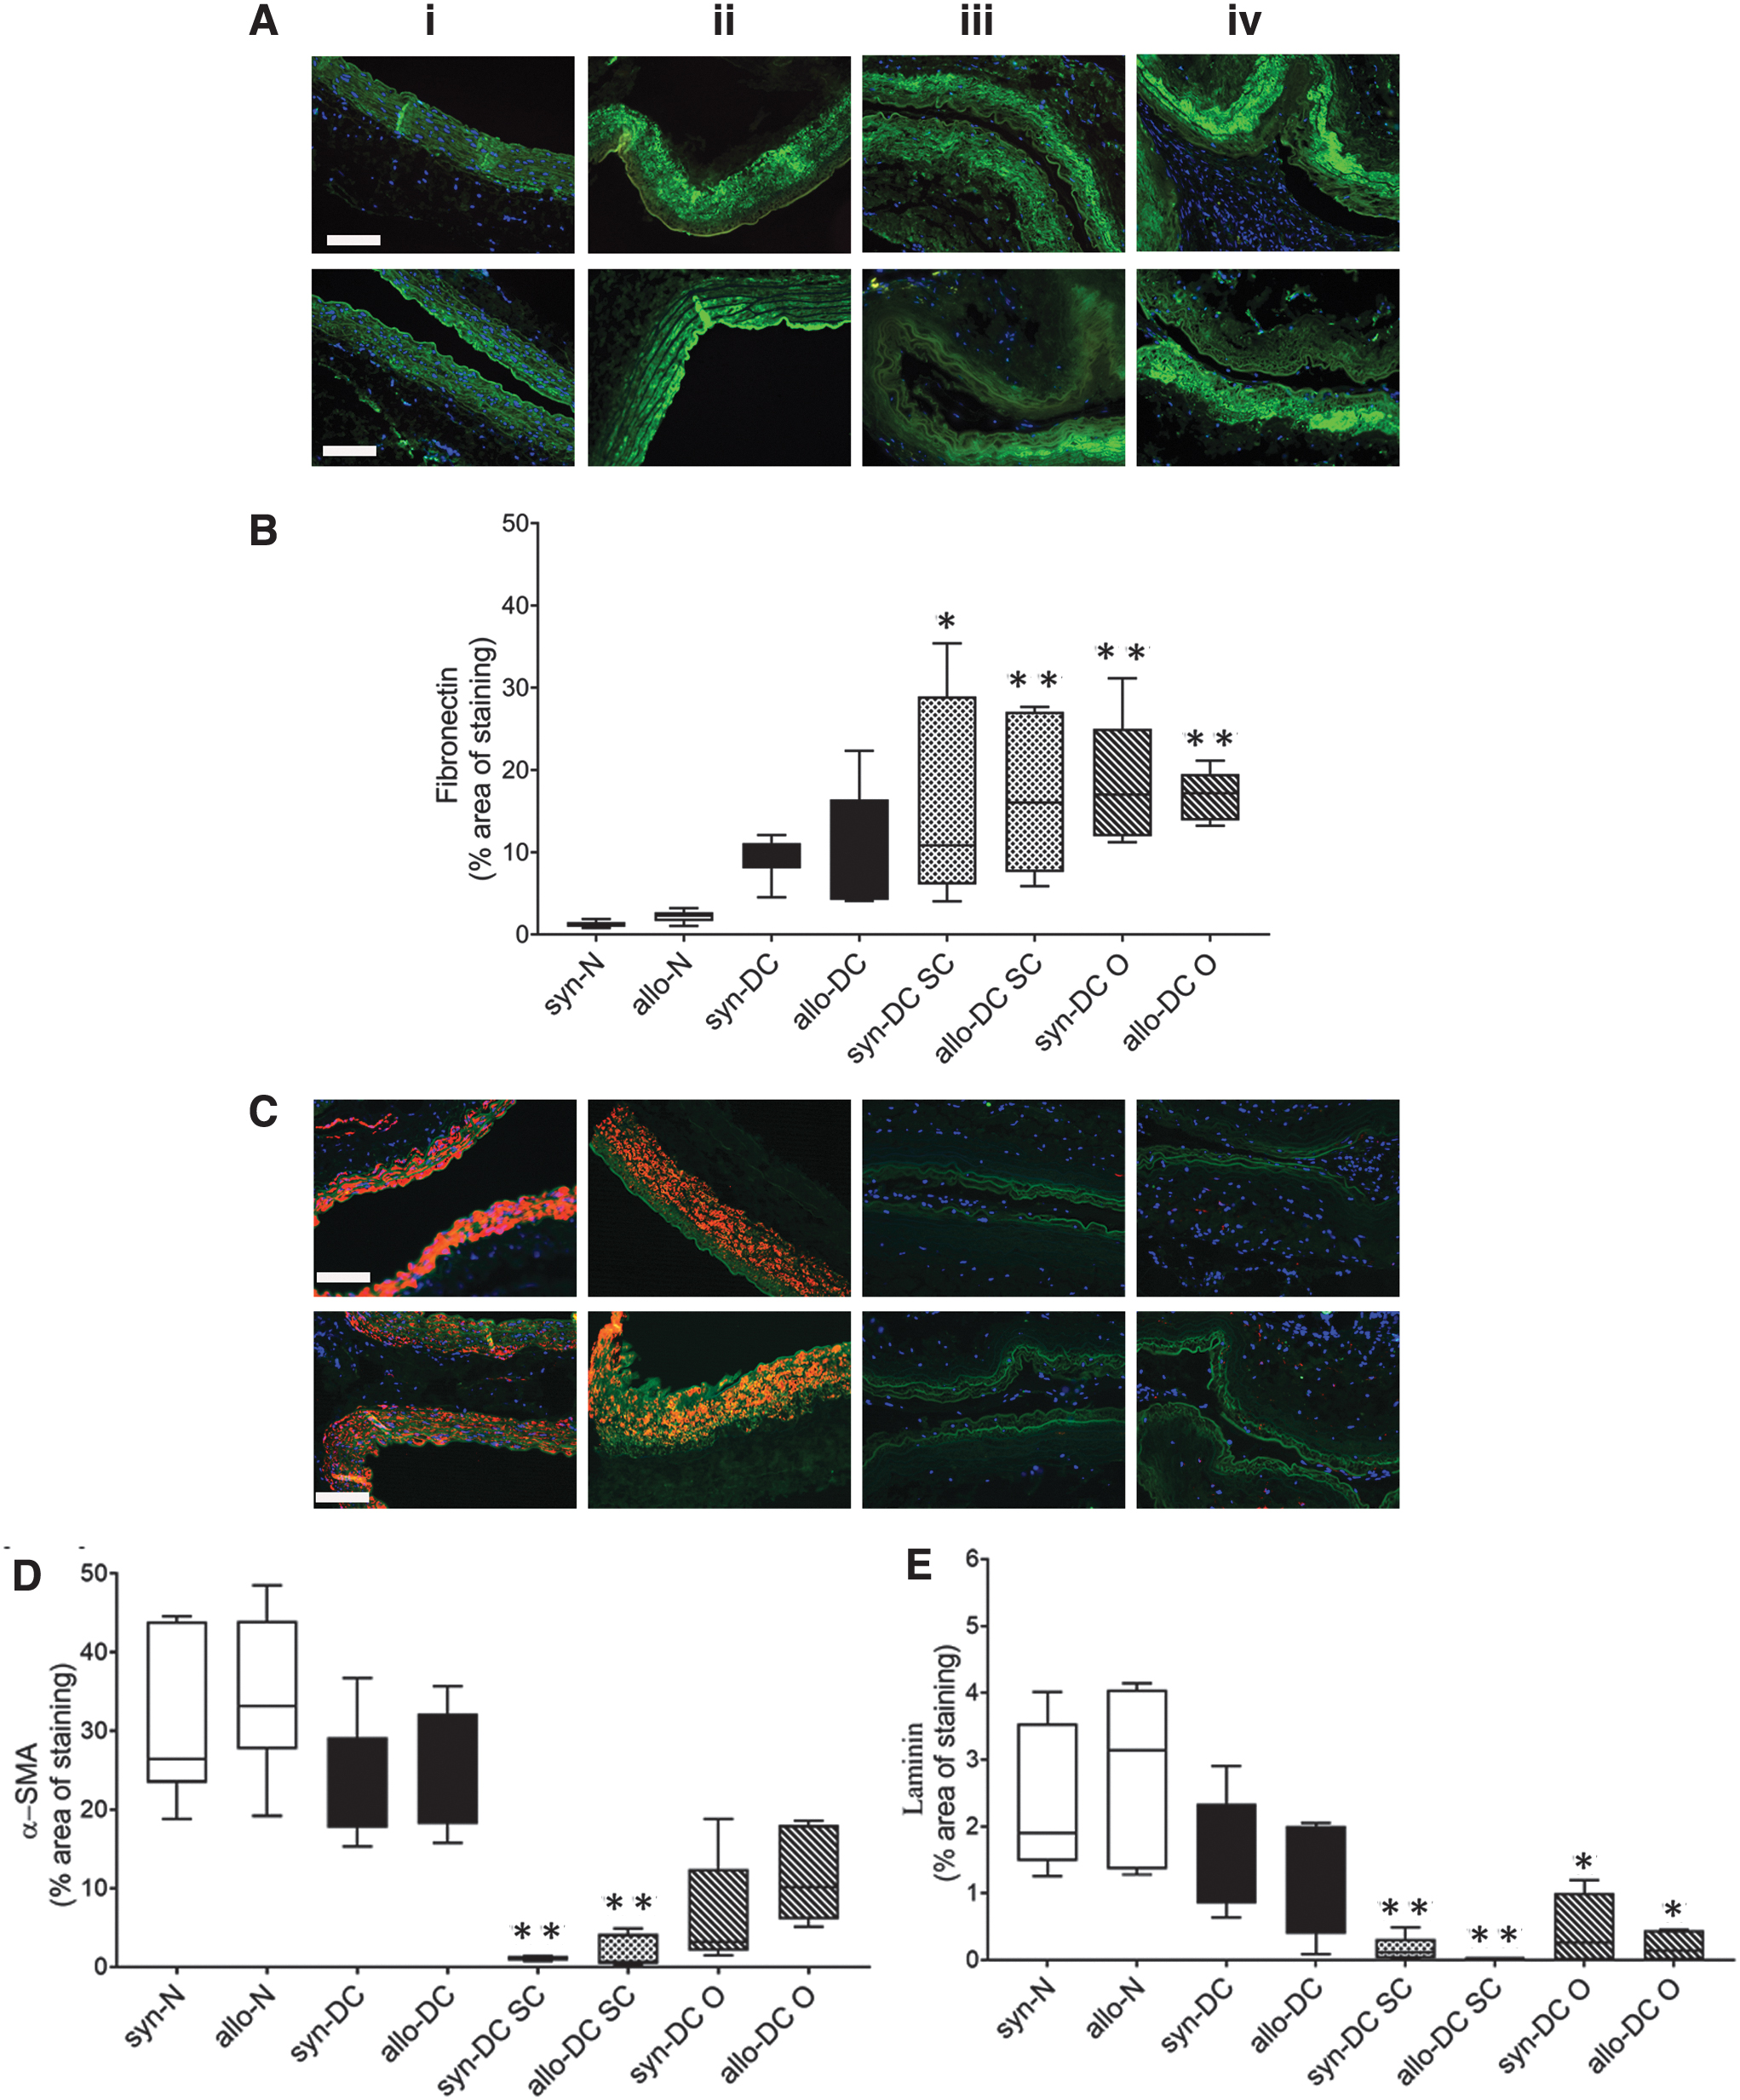
Immunostaining identifying expression of different ECM components of the scaffolds and implants. Implanted scaffolds after 2 months’ time period were analyzed by immunohistochemistry of different ECM components. The upper panel denotes the implants from syn- scaffolds and implants—(i) syn-N, (ii) syn-DC, (iii) syn-DC SC, and (iv) syn-DC O and lower panel from allo- scaffolds and implants—(i) allo-N, (ii) allo-DC, (iii) allo-DC SC, and (iv) allo-DC O.
The syn-DC and allo-DC showed a marginal increase in the fibronectin expression, which increased significantly in the implants postimplantation. Fibronectin expression in the DC SC implants (syn-13.46-folds, *p < 0.05; allo-7.6-folds, **p < 0.01); DC O implants (syn-15.13-folds, **p < 0.01; allo-7.68-folds, **p < 0.01) were significantly upregulated compared with the respective syn-N and allo-N scaffolds (Fig. 6A, B).
The syn-DC and allo-DC showed a marginal decrease in the α-SMA expression. However, the syn-DC SC (27.66-folds, **p < 0.01) and allo-DC SC (19.31-folds, ***p < 0.001) implants showed reduced expression of α-SMA (Fig. 6C, D) compared with the syn-N and allo-N scaffolds. The laminin expression (Fig. 6C, E) of the DC implants showed a significant reduction (syn-DC SC-13.68-folds, **p < 0.01; allo-DC SC-24.15-folds, **p < 0.01, syn-DC O-19.59-folds, *p < 0.05 and allo-DC O-19.65-folds, *p < 0.05) compared with the respective syn-N and allo-N scaffolds.
The expression of collagen was marginally downregulated in the syn-DC and allo-DC scaffolds. However, in all the implants, there was an increase trend of collagen deposition (Supplementary Figs. S8 and S9). Similarly, the elastin expression was marginally downregulated in the syn-DC and allo-DC scaffolds with an increasing trend in the syn-DC O and allo-DC O implants. For both collagen and elastin expression, the up- and downregulation were however not significantly different from the syn-N and allo-N scaffolds.
Genomic and protein expression of inflammatory markers following implantation
Since macrophages have been indicated to play an important role in scaffold/implant acceptance, rejection, or modulation, we further characterized the macrophage population at gene and protein level by digital PCR (Fig. 7) and immunohistochemistry (Figs. 8–10).
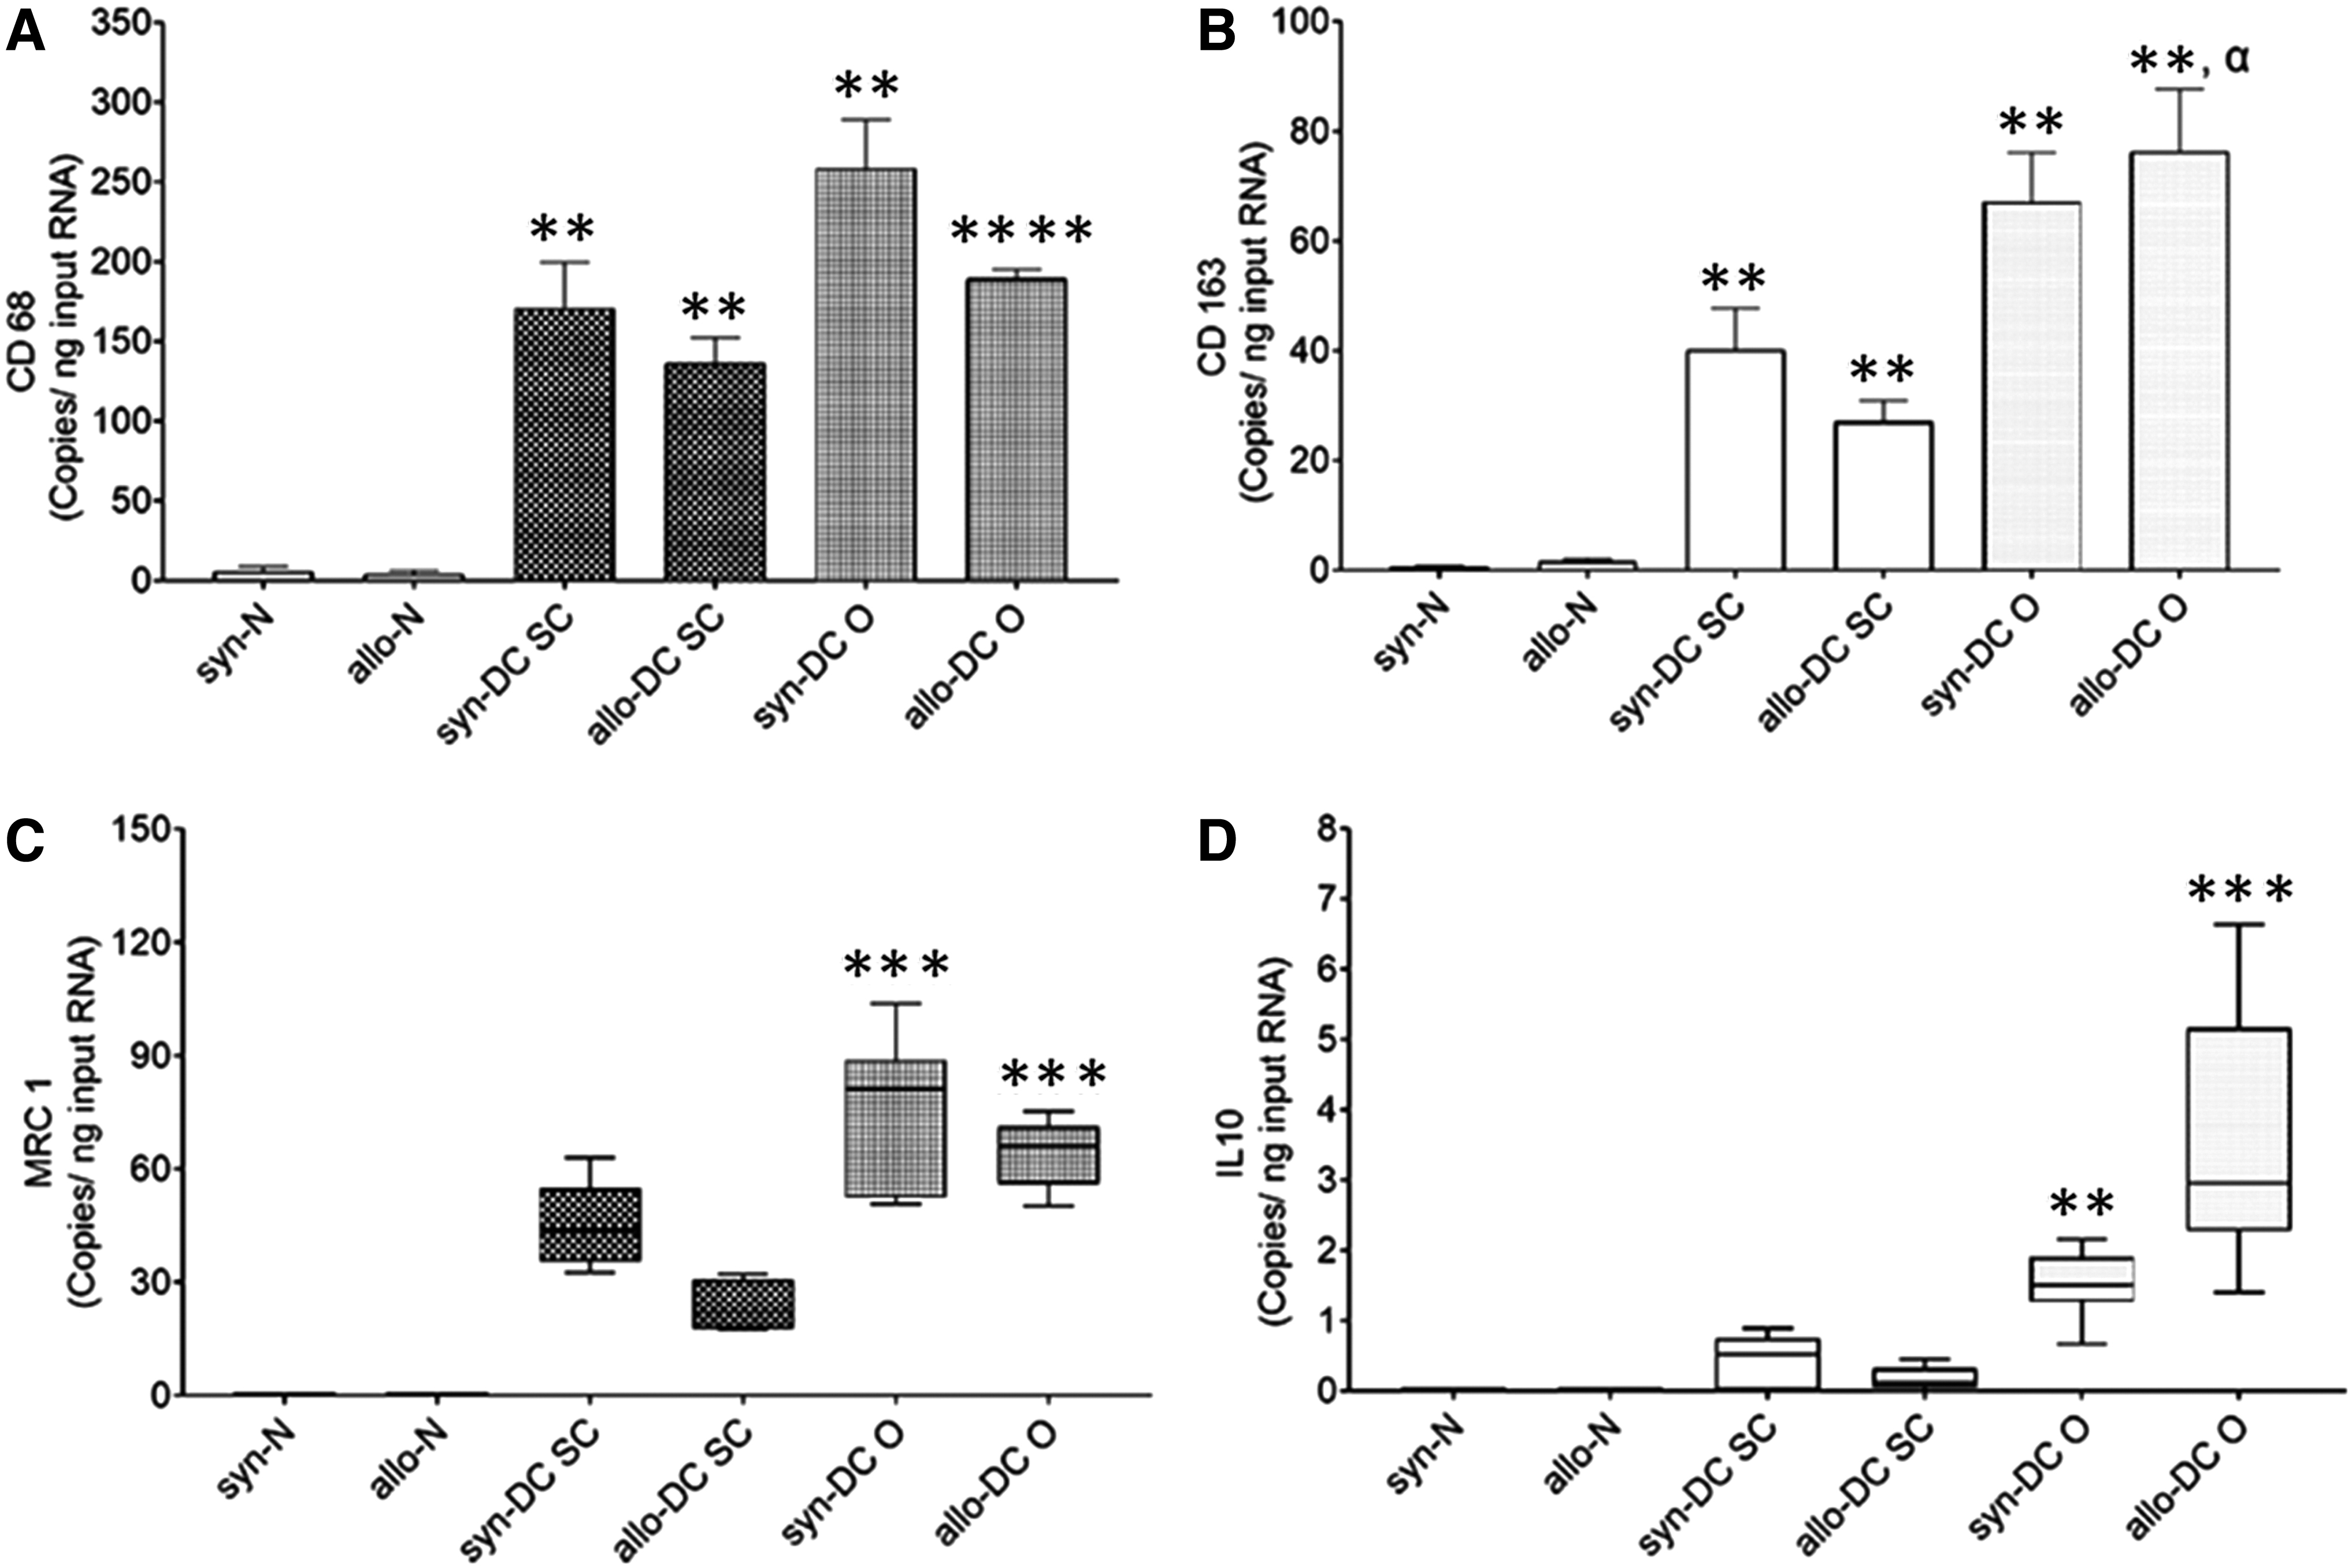
Gene expression analysis of different macrophage markers in scaffolds and implants. Implanted scaffolds after 2 months’ time period were characterized for gene expression of different macrophages (M1 vs. M2 subsets).
The genomic expression pattern of the macrophage markers, CD68, CD163, and macrophage mannose receptor 1 (MRC1), showed significant expression in all the implants (Fig. 7A–D). We could also observe significant expression of the anti-inflammatory cytokine, interleukin 10 (IL-10). The internal reference was β actin gene and the target gene expression was done as outlined in the Supplementary Data S1.
The gene expression level in the syn- and allo-N scaffolds was at a very low level and was expressed in an order CD68>CD163>MRC1≈IL-10. For the CD68 expression, the implants syn-DC SC (28.980-folds, **p < 0.01) and syn-DC O-43.76-folds; *p < 0.01) and allo-DC SC (31.47-folds, **p < 0.01 and allo-DC O (43.73-folds; ****p < 0.0001) implants showed significantly higher expression compared with their respective syn-N and allo-N scaffolds (Fig. 7A). There was however no difference between SC and O implants.
The CD163 gene expression in case of the syn-DC SC implants (57.49-folds, **p < 0.01), allo-DC SC (16.24-folds; **p < 0.01), syn-DC O (95.92-folds, **p < 0.01), and allo-DC O (45.72-folds; **p < 0.01) implants showed significantly higher expression compared with the syn-N and allo-N scaffolds. Also, the allo-DC O implants showed higher expression (*p < 0.05) compared with the allo-DC SC implant (Fig. 7B).
The level of MRC-1 gene expression was very negligible in the syn-N and allo-N scaffolds and was not significantly different from the syn-DC SC and allo-DC SC implants (Fig. 7C). However, the syn-DC O (***p < 0.001) and allo-DC O (***p < 0.001) implants showed higher expression compared with the syn-N and allo-N scaffolds (Fig. 7C).
We also monitored the anti-inflammatory cytokine, IL-10 expression, which was negligible in case of syn-N, allo-N scaffolds, syn-DC SC, and allo-DC SC implants. However, the DC O implants showed a significant increase (syn- **p < 0.01 and allo- ***p < 0.001) compared with the respective N (syn-N and allo-N) scaffolds (Fig. 7D).
Furthermore, targeted multiplexing of two protein targets by immunohistochemistry was used to detect (i) CD68 (pan macrophage) and CD163 (M2 macrophage); (ii) major histocompatibility complex class II (MHC II) (M1 macrophage) and CD163 (M2 macrophage) and (iii) inducible nitric oxide synthase (iNOS) (M1 macrophage) and Arginase 1 (Arg1) (M2 macrophage) in the scaffolds and implants (Figs. 8–10; Supplementary Fig. S10) using validated antibodies and appropriate positive control staining (Supplementary Fig. S11).
The expression of the pan, M1, and M2 macrophage markers was determined by dual staining as described (Materials and Methods section) and quantified as defined in the Supplementary Data S1. For the pan macrophage marker, CD68 the syn-DC and allo-DC implants (≈14- to 23-folds; *p < 0.05—**p < 0.01) showed a significantly increased expression compared with the syn-DC and allo-DC scaffolds (Fig. 8A, B).
The CD163 expression paralleled the CD68 expression although (at a lesser level ≈2- to 3-folds lesser) and was significantly upregulated compared with the syn- and allo-DC scaffolds. However, there was almost identical CD163 expression of different DC implants (≈7.2- to 9.75-folds; *p < 0.05) syn-DC and allo-DC scaffolds (Fig. 8A, C).
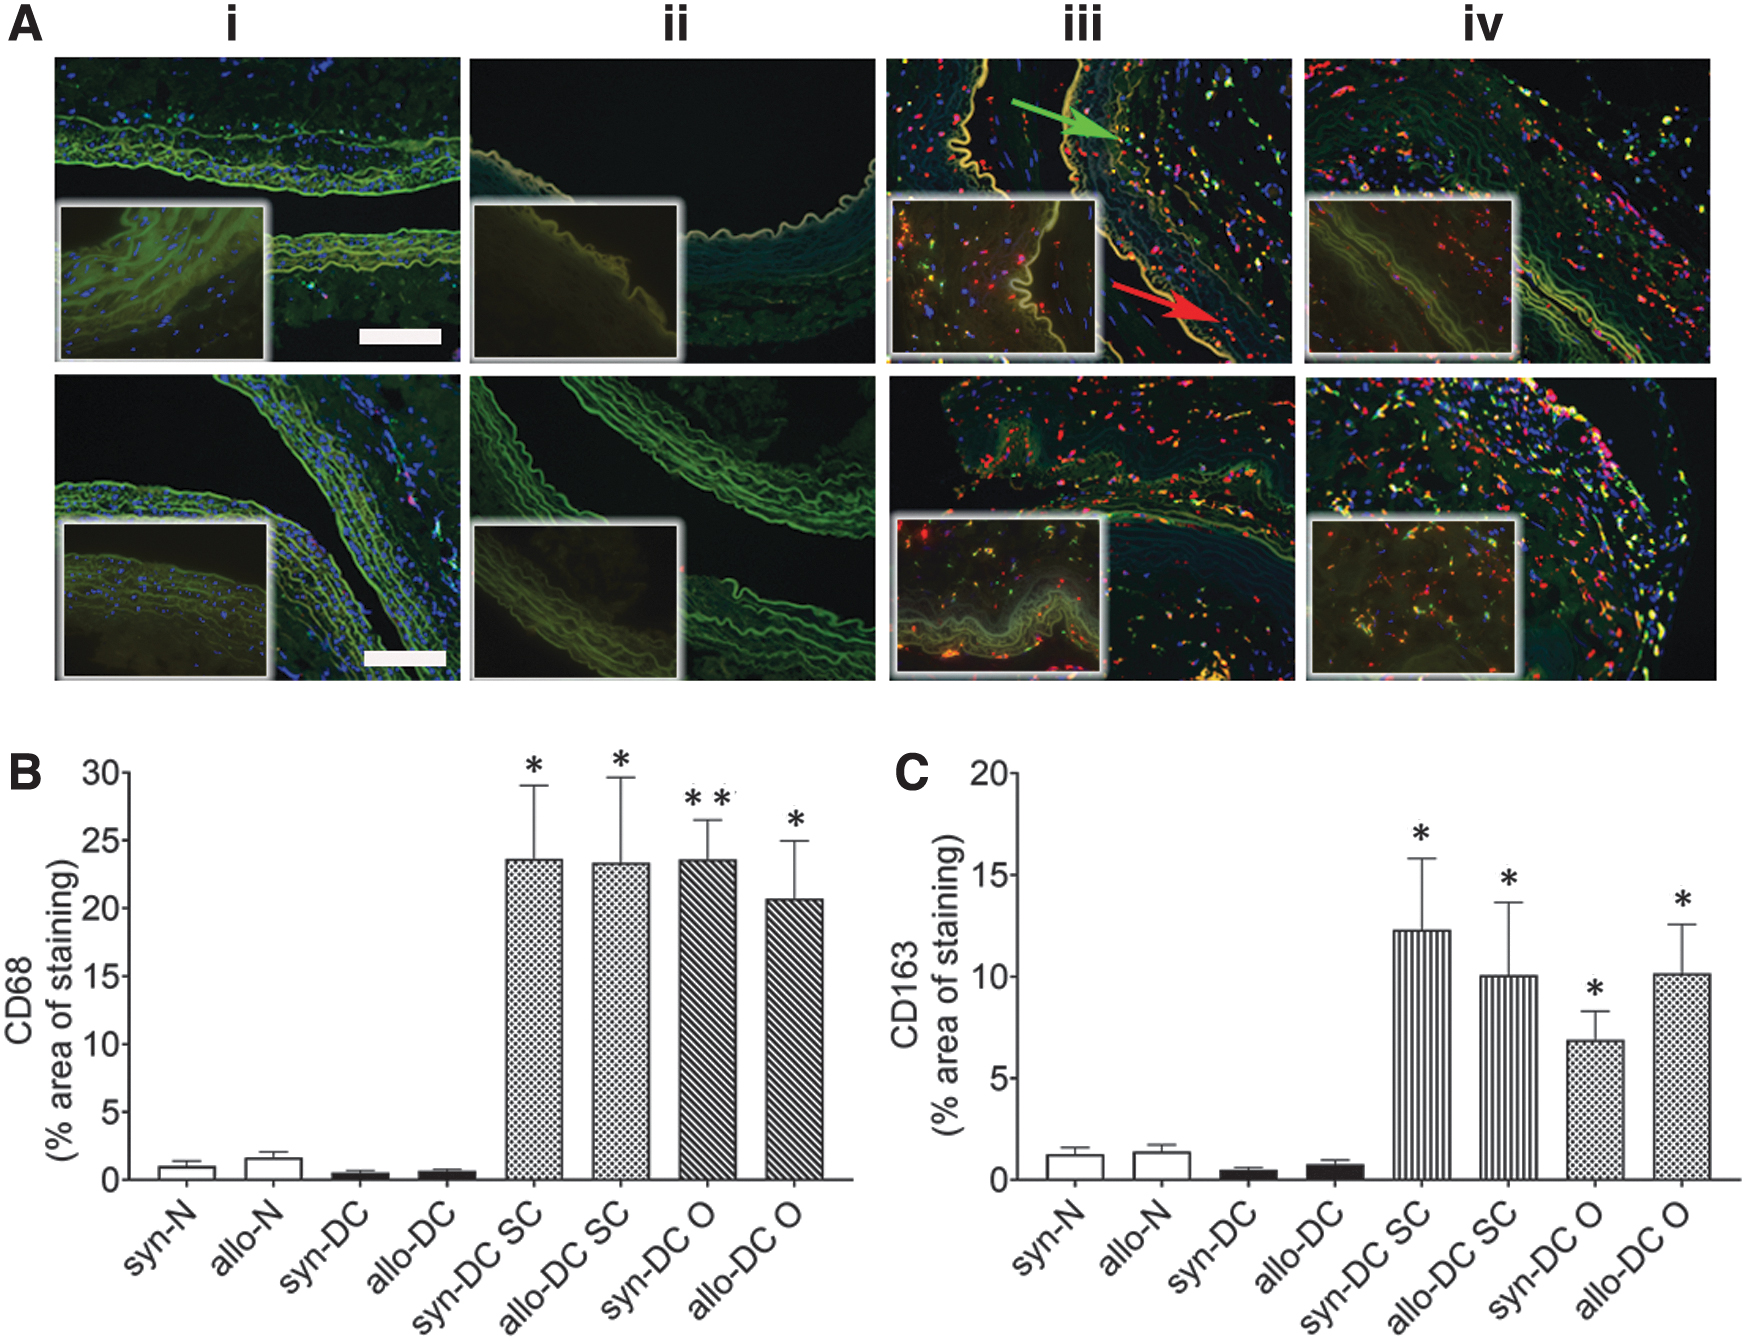
Immunostaining for macrophage markers, CD68 and CD163, in scaffolds and implants. Implants after 2 months’ time period were subjected to measurement of macrophage (CD68 and CD163). The upper panel denotes syn- scaffolds and implants—(i) syn-N, (ii) syn-DC, (iii) syn-DC SC, and (iv) syn-DC O and lower panel from allo- scaffolds and implants—(i) allo-N, (ii) allo-DC, (iii) allo-DC SC, and (iv) allo-DC O. and the lower panel from Brown–Norway rats, respectively. Arrows-red: CD68 and green: CD163.
Subsequently, we also monitored the expression of major histocompatibility antigen, MHC II, as a potential M2 marker in the different implants along with CD163 expression (Fig. 9). We could detect a significant increase of MHC II macrophages in the syn-DC O (8.51-folds, *p < 0.05) and allo-DC O (5.29-folds, *p < 0.05) implants compared with the syn-DC and allo-DC scaffolds (Fig. 9A, C).
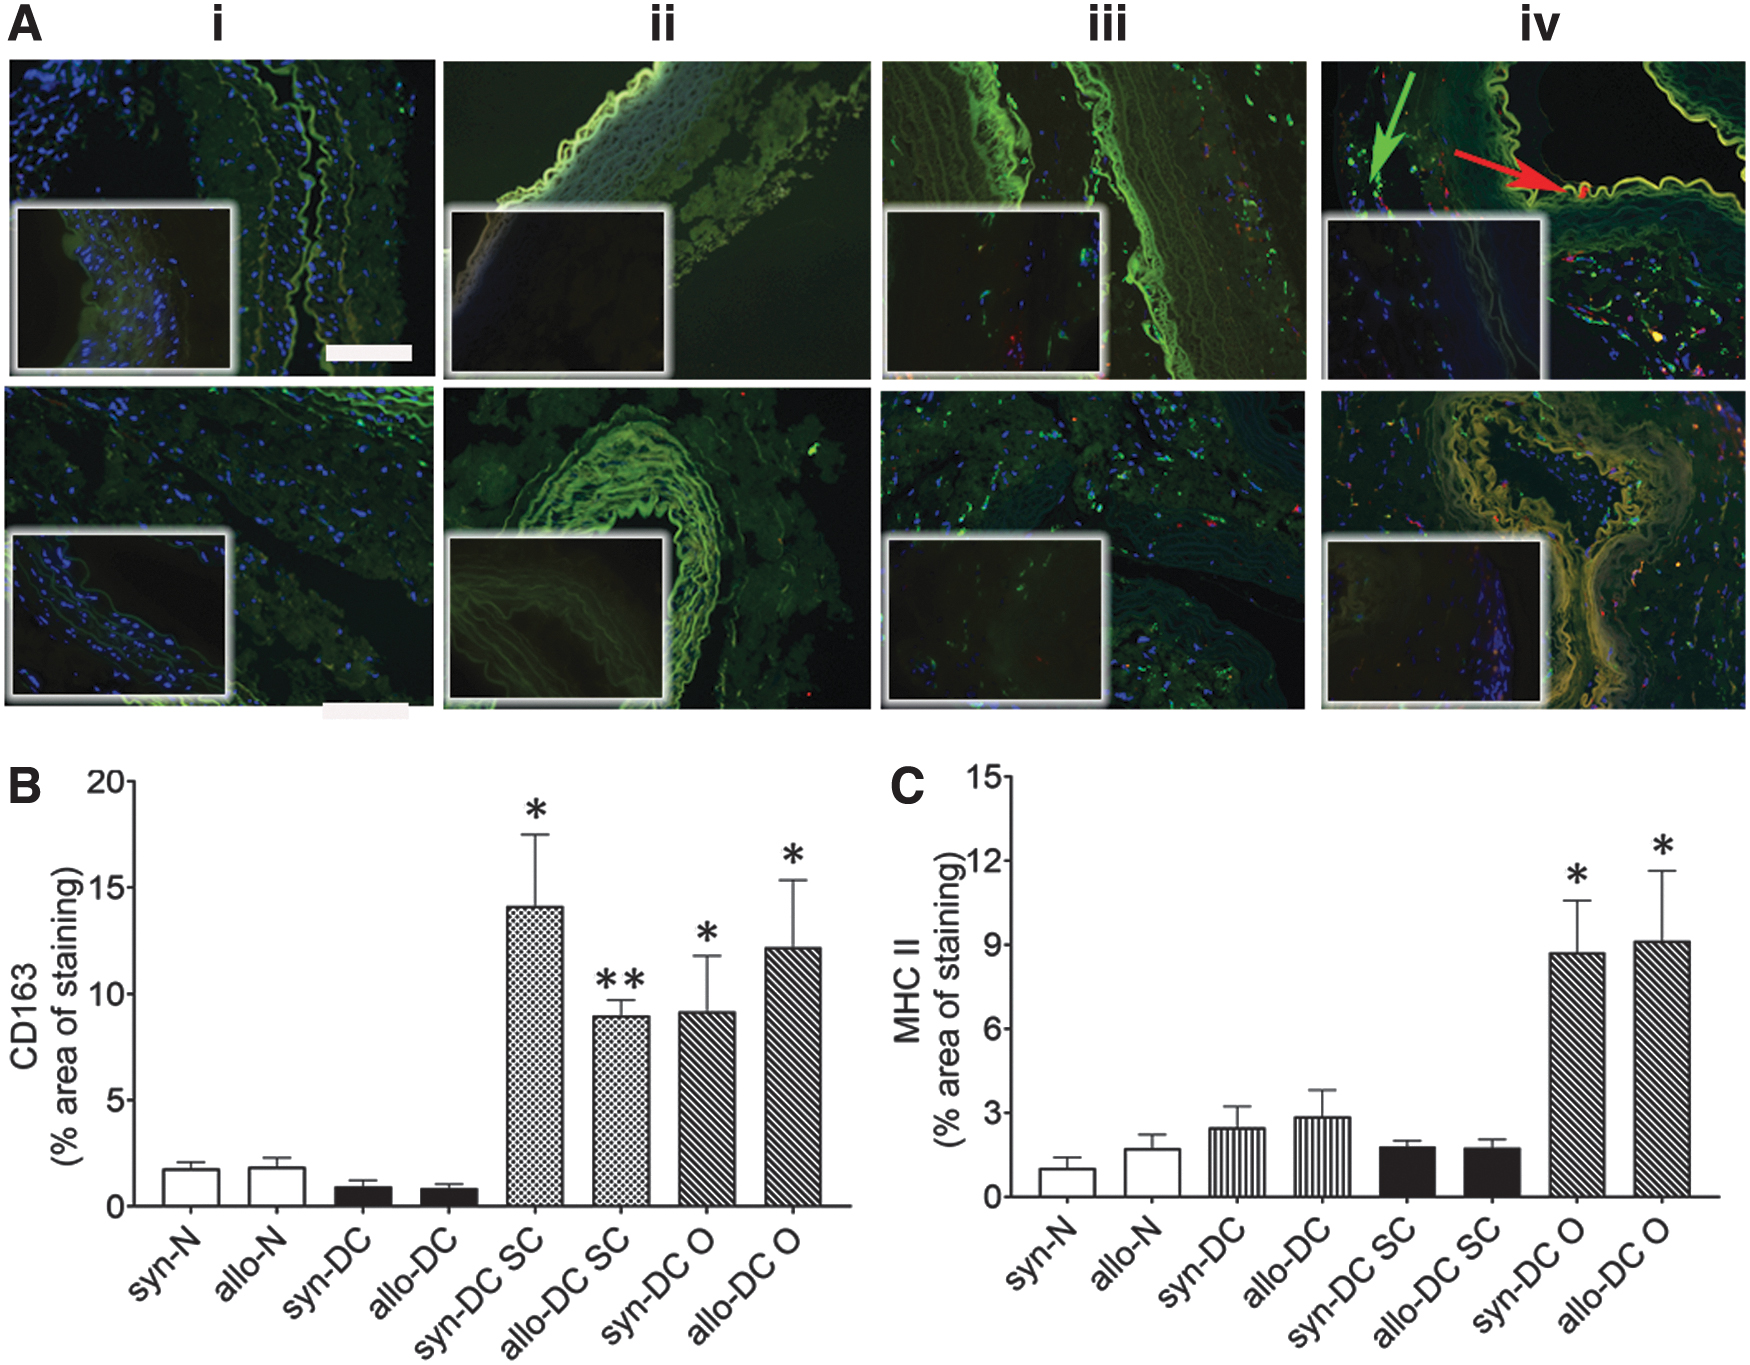
Immunostaining identifying macrophage markers, CD163 and MHC II in scaffolds and implants. Implanted scaffolds were subjected to immunofluorescence assessment for different macrophages (CD163 and MHC II). The upper panel denotes syn- scaffolds and implants—(i) syn-N, (ii) syn-DC, (iii) syn-DC SC, and (iv) syn-DC O and lower panel from allo- scaffolds and implants—(i) allo-N, (ii) allo-DC, (iii) allo-DC SC, and (iv) allo-DC O. Arrows-red: MHC II and green: CD163. (
We also performed immunolabeling for two additional macrophage markers, iNOS (M1 macrophage) and Arg1 (M2 macrophage) (Fig. 10). Significant increase in expression of M2 macrophage, Arg1 (Fig. 10A, B) was found mainly in the syn-DC O (3.06-folds, *p < 0.05) and allo-DC O implants (2.28-folds, *p < 0.05) when compared with the syn-DC and allo-DC scaffolds. The expression of the M1 macrophage, iNOS, was however weak (Fig. 10A–C) and was mainly observed in the allo-DC SC (2.56-folds, *p < 0.05) implants compared with the syn-DC and allo-DC scaffolds.
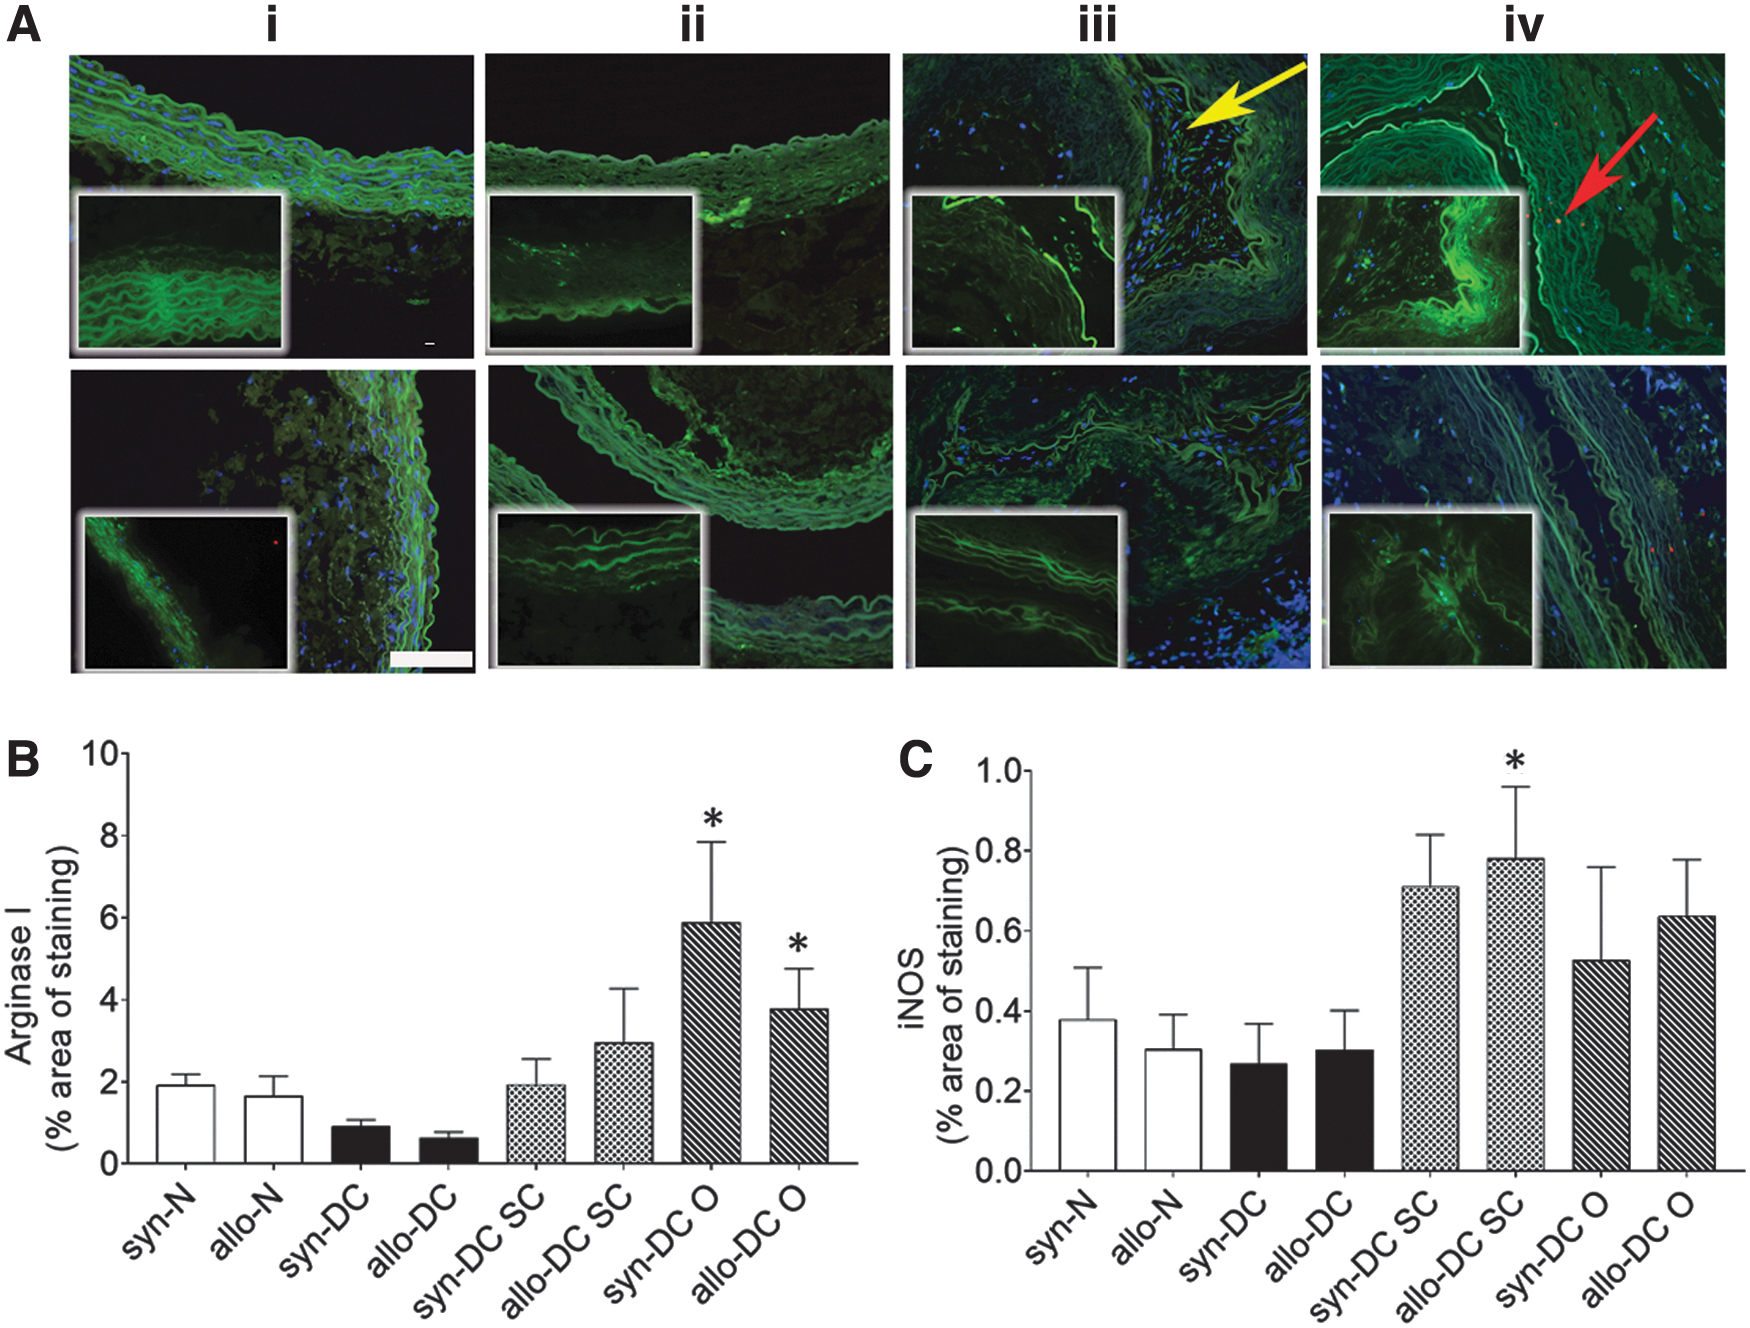
Immunostaining identifying macrophage markers, Arg1 and iNOS, in the control scaffolds and implants. Scaffolds and implants were subjected to immunohistological assessment for different macrophages (Arg1 and iNOS). The upper panel denotes syn- scaffolds and implants—(i) syn-N, (ii) syn-DC, (iii) syn-DC SC, and (iv) syn-DC O and lower panel from allo- scaffolds and implants—(i) allo-N, (ii) allo-DC, (iii) allo-DC SC, and (iv) allo-DC O. Arrows-red: iNOS and green: Arg1.
Histological observations of allo- and syn- implants had earlier revealed mainly lymphocyte infiltrations (Fig. 3; Supplementary Figs. S1 and S2). Subsequently, we also monitored T cell (CD3+, CD4+, and CD8+) infiltration in the implants by immunohistochemistry, which was mainly found to be localized around the implants with only few cells present in the lumen of the implants (Fig. 11).
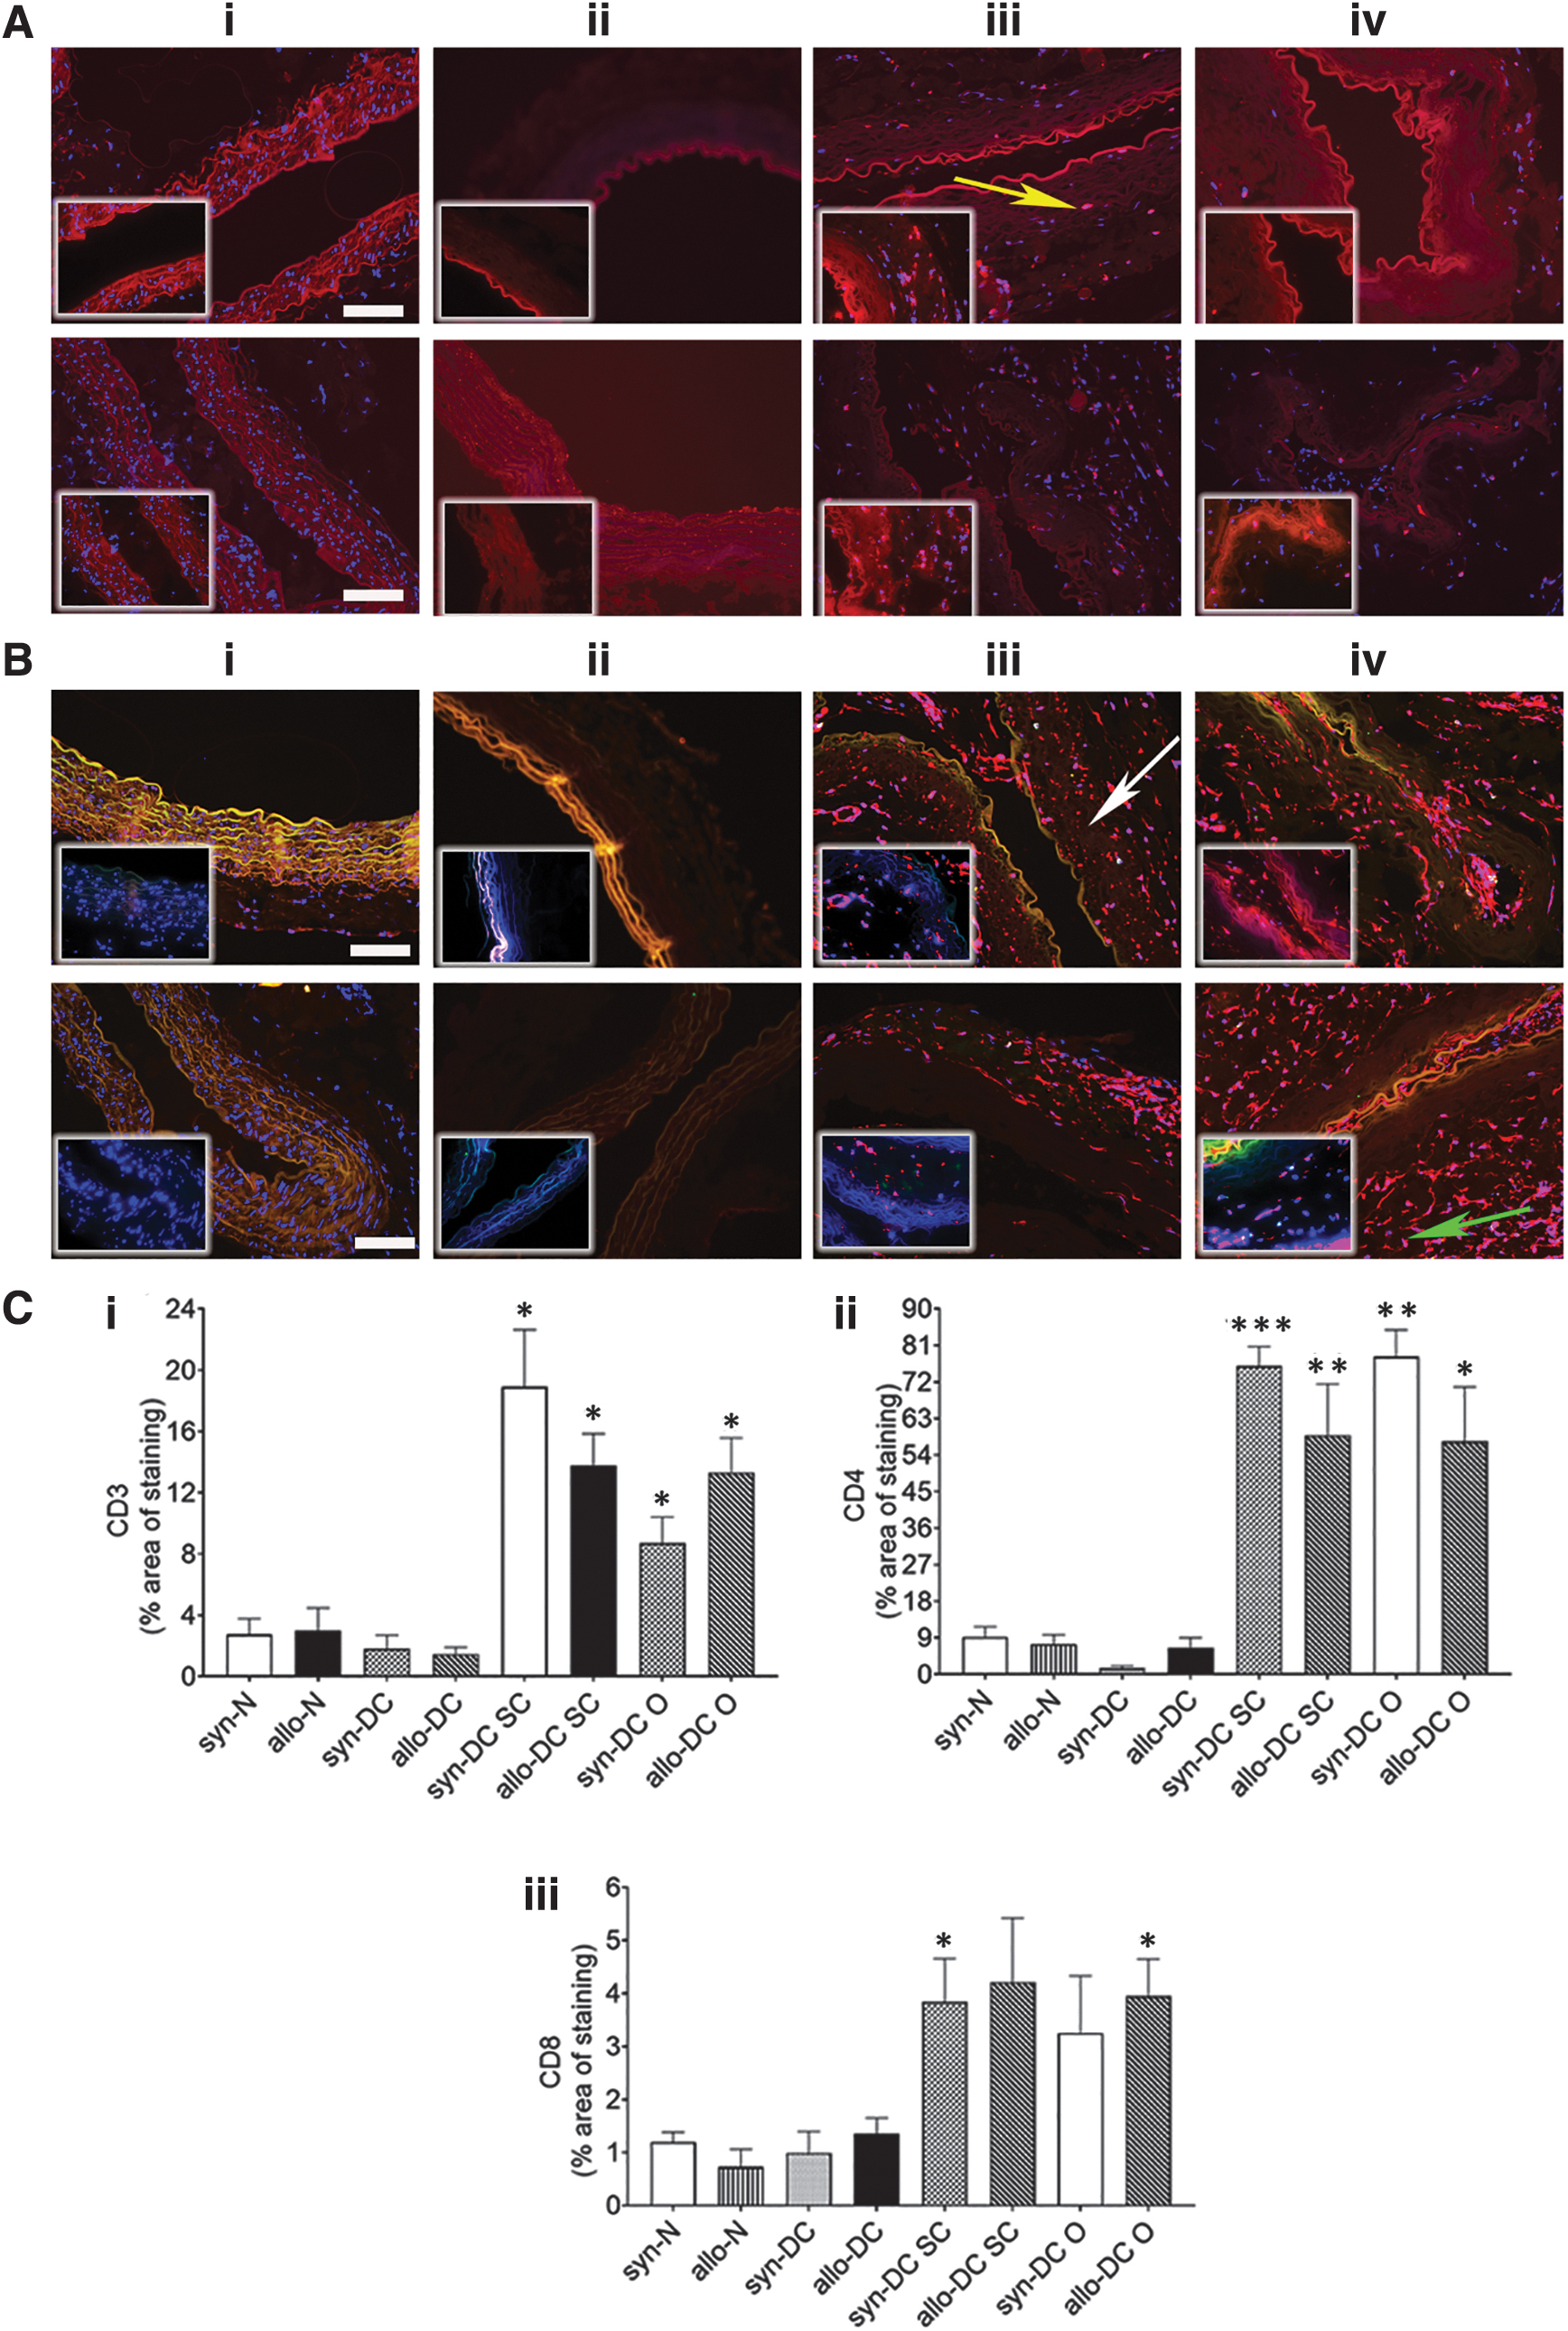
Immunostaining for immune markers, CD3, CD4, and CD8 in the scaffolds and implants. The syn- and allo- implants after 2 months’ time period were harvested from the subcutaneous and omentum site and along with syn- and allo-(N and DC) scaffolds were analyzed by immunofluorescence assessment for immune markers (CD3+, CD4+, and CD8+ cells). The upper panel denotes syn- scaffolds and implants—(i) syn-N, (ii) syn-DC, (iii) syn-DC SC, and (iv) syn-DC O and lower panel from allo- scaffolds and implants—(i) allo-N, (ii) allo-DC, (iii) allo-DC SC, and (iv) allo-DC O. Arrows-yellow: CD3+ve cells, white: CD4+ve cells, and green: CD8+ve cells, respectively. Localization
The expression of the pan T cell marker, CD3+ was significantly increased in the syn-DC and allo-DC implants from the SC and O route compared with the respective syn-DC and allo-DC scaffolds (3.17- to 6.36-folds, *p < 0.05) (Fig. 11A, C-i). Of the T cell markers, CD4+ was the more dominant T cell population (Fig. 11B, C-ii, C-iii). There was varied expression of syn-DC SC (8.24-folds ***p < 0.001), syn-DC O (8.49-folds, **p < 0.01), and allo-DC SC (7.94-folds, **p < 0.01; and allo-DC O (7.74-folds, *p < 0.05) implants compared with the respective syn-DC and allo-DC scaffolds (Fig. 11B, C-ii). CD8+ expression was at a much lesser level only in few groups (syn-DC SC and allo-DC O-3.2- to 4.5-folds, *p < 0.05) compared with the respective syn-DC and allo-DC scaffolds (Fig. 11B, C-iii).
The systemic immune response was also monitored from the serum of the implanted rats compared with the SHAM-treated rats at the end of 2 months. The systemic immune response was identical in all the recipient rats and was also similar to that of the SHAM group (Fig. 12A, B). The expression pattern of cytokines is probably indicative of the absence of antibody-mediated rejection following scaffold implantation.
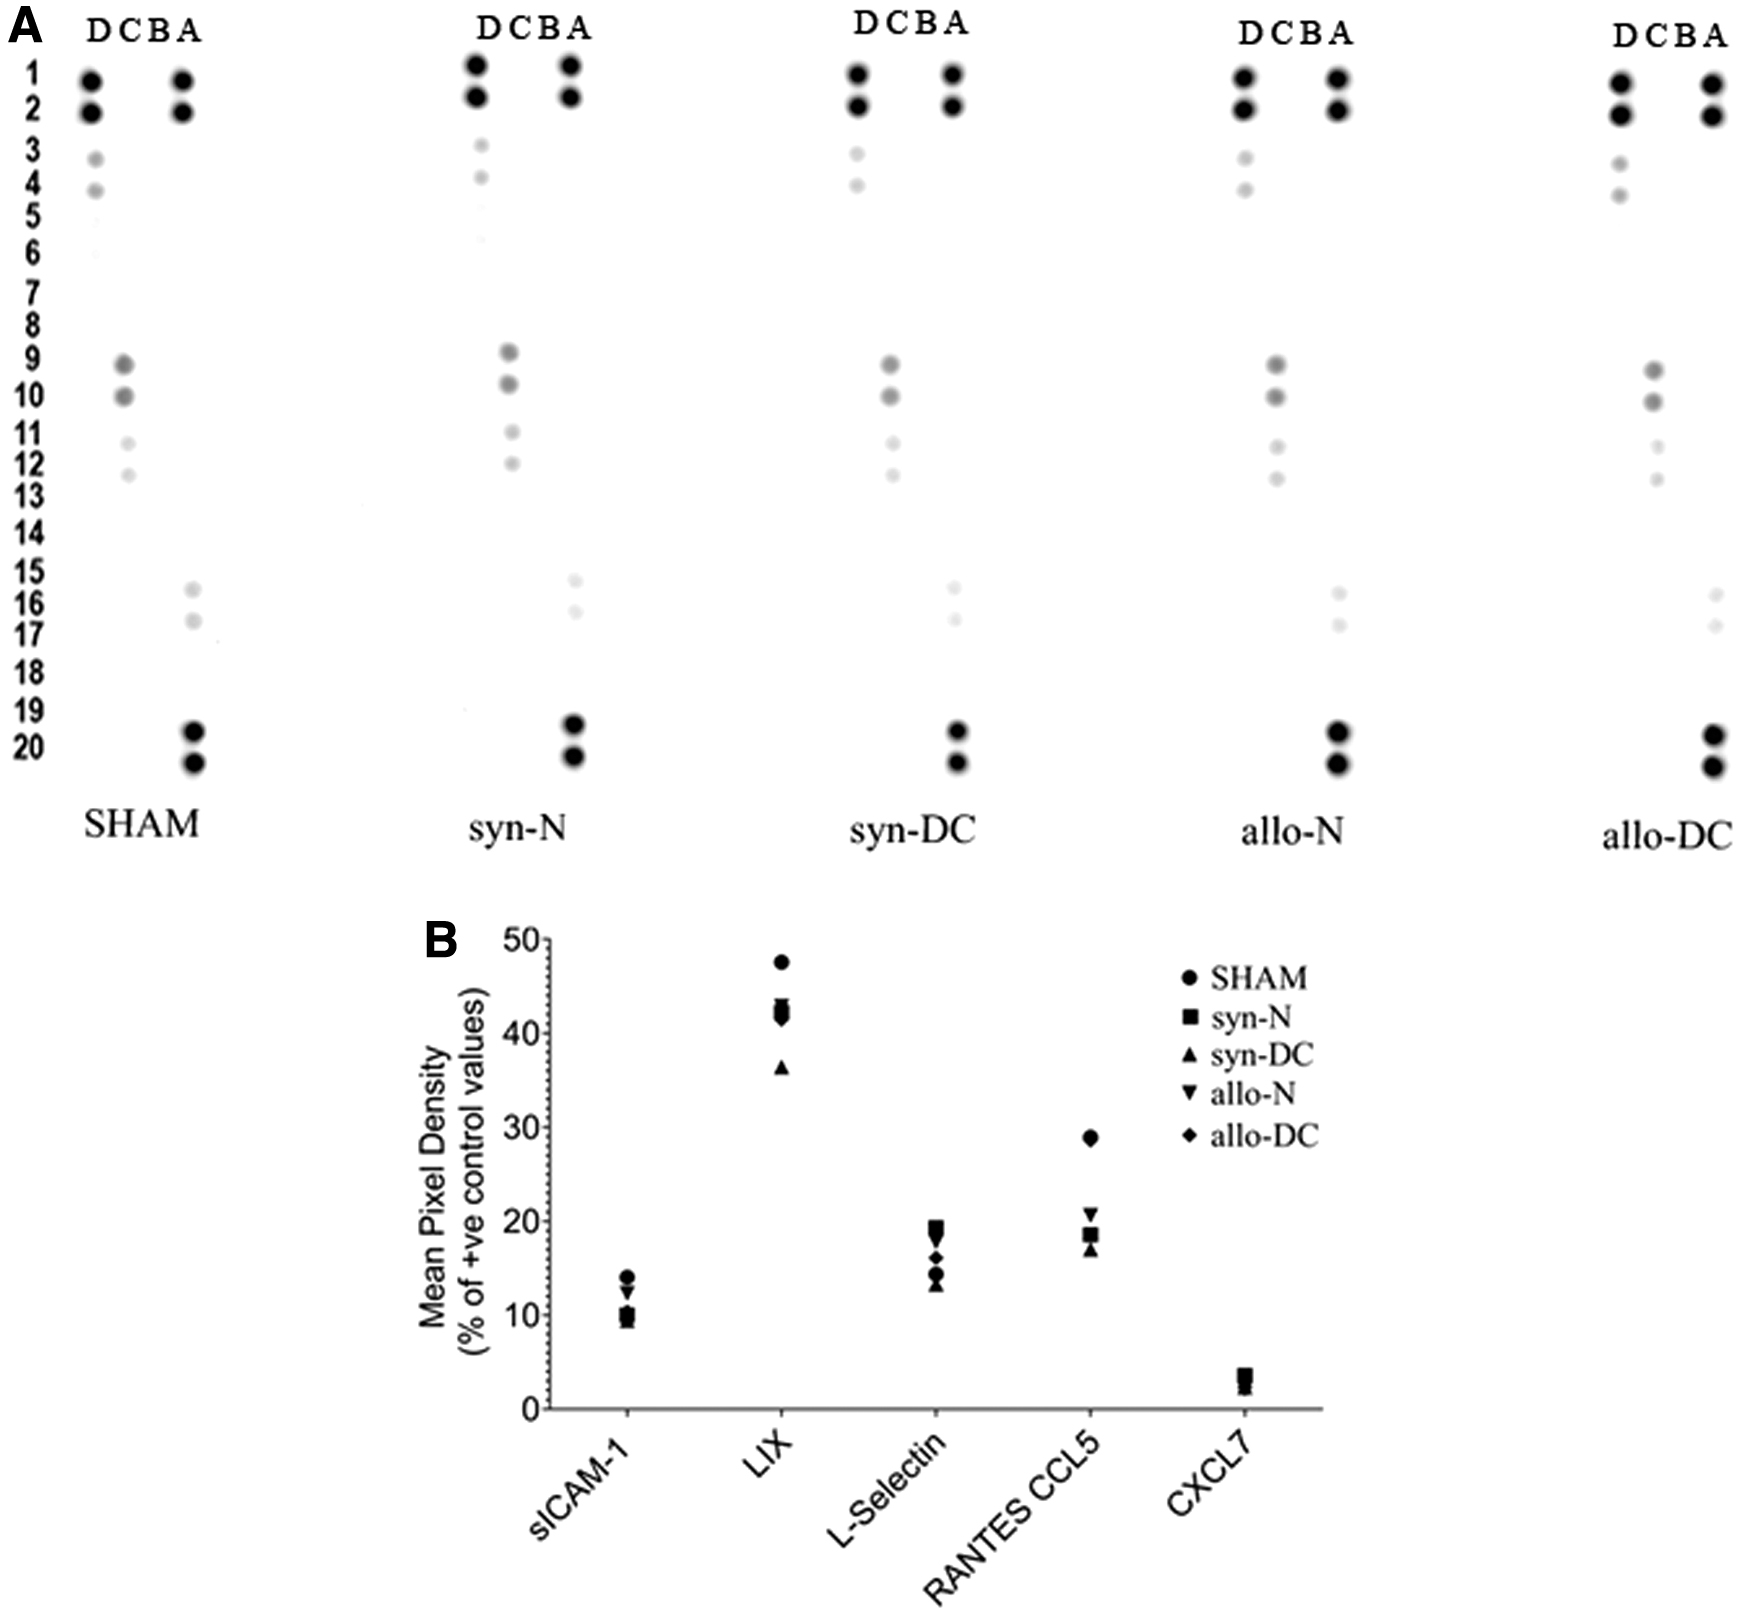
Cytokine and chemokine detection in serum of recipients and SHAM group.
Discussion
The current study characterized DC blood vascular scaffolds after implantation at two different body routes using genetically different donor and recipient rats using genomic and protein detection level. The study of the ECM and immune responses against the implants at different body routes helped us to understand the modulation of the scaffolds after implantation. The genetic basis constituted the syngeneic (Lewis–Lewis) and allogeneic (Brown Norway–Lewis) implantation model used during the study. During the study, we initially prepared scaffolds by chemical DC using an alternate cycle of SDC and Glycerol/ethylenediaminetetraacetic acid (EDTA) mix, 20 which showed some loss of tissue architecture indicative of the potential deleterious effect of chemical DC.26,27
To monitor the fate of syn-DC and allo-DC implants following in vivo implantation, chemically DC (syn-DC and allo-DC) scaffolds were placed as free-floating implants without vascular anastomosis at SC and O routes.
The DC implants (SC and O) behaved uniquely according to the route of implantation as evidenced from the genomics and protein characterization. The O implants irrespective of the genetic background were found, in general, to have a poor outcome compared with the SC implants as assessed from the architecture, fibrosis, and necrosis score. The presence of lymphocytes in the implants suggests the ensuing immune response to be of subchronic or chronic type.
ECM and immune responsive protein dynamics following implantation were monitored by quantitative proteomics and immunohistochemistry. The proteomics findings were evaluated further by protein interaction network, which indicated the involvement of unique ECM protein clusters operating at the extracellular space, involving extracellular fibril organization proteins. The difference in nature of the scaffold and route of implantation was reflected from the hub ECM and immune protein expression with the SC implants showing more uniform expression of ECM compared with the O implants. Similarly, the Fibronectin type III domain-containing protein (Fndc1), which is associated with G protein signaling was also upregulated in general.
The Hub proteins (Apoe, Apob, App, Fn1, Kng1, Sparc, Agt, Actb, Lamb2, Acta2, Ecm1, and Fndc1), which were mostly expressed in case of the DC implants are important ECM components mostly belonging to the class of integral membrane proteins, which react with the surroundings.
The ECM proteins were found to be either at a similar level to that of the N-scaffolds (syn-N and allo-N), such as laminin (Lamb2) and fibronectin 1 (Fn1), or downregulated in case of Actb (Actin Beta) and Acta2 (smooth muscle alpha-actin). To validate our proteomics findings, we used the immunohistochemical tool to monitor the expression pattern of three important ECM proteins, fibronectin, α-SMA, and laminin. The two ECM proteins, α-SMA and Laminin showed a decrease in the expression following implantation, which is in tune with the proteomics findings. However, all the implants showed enhanced expression of fibronectin. Following DC, the ECM epitopes got exposed to the antibodies due to the lack of cells and were probably the reason for the higher expression level compared with the normal implants.
Any additional increase in the ECM protein expression could be attributed to the postimplantation modifications. A marked increase in the expression of ECM components, for example, vascular laminins and fibronectin is a common phenomenon during early syn- and allo- transplantation triggering lymphocyte recruitment at the implantation site. 28
Although not significant, we also found an increasing trend in the deposition of collagen and elastin in the implants. This could be one of the reasons for the association of immune responses with the implants studied. By immunohistochemistry, we found that Alpha actin (Acta2) or α-SMA, which is normally associated with chronic rejection, 29 was not upregulated in any of the implants. The deposition of a fibrous capsule around DC ECM-based scaffolds normally elicits immune responses limiting tissue remodelling and regenerative potential. 6 All the implants showed the absence of a fibrous capsule but evidence of necrosis due to a probable unresolved inflammatory response. The chemical DC process altered the ECM components to a varying degree as seen from the proteomics data, where the synegeneic implants, particularly the syn-SC implants, could preserve more ECM proteins compared with the allogeneic subcutaneous (allo-SC) implants.
The proteomics findings also pointed to the expression of the immune proteins particularly the innate arm of the immune response with overlapping roles with the adaptive immune system.
The immune markers detected were normally associated with complements, macrophages, and immune cell category with hub immune proteins upregulated in almost all the syn- and allo- implants. However, some of the hub proteins were expressed preferentially in O implants compared with the SC implants, for example, Serping1, C1s, C1qc, C1qa, C4, Il1rap1, Il6st, and CD31 suggestive of an ensuing immune response in an omental milieu compared with the SC route. Anti-HLA class I antibodies are primarily implicated in acute rejection, whereas anti-HLA class II antibodies during late rejection. The protein expression of MHC I molecules (RT1-Aw2) and also MHC II in syn- and allo- implants were downregulated. The complement proteins can recognize danger signals generated by foreign particles, for example, intruding pathogens or danger-associated molecular patterns presented by implanted scaffolds. 30
Complement components, for example, Syk, CD4, and Lyn play important roles in adaptive and innate immune response as part of the host defense system. CD4, which is a membrane glycoprotein and a member of the immunoglobulin supergene family acts as a coreceptor in MHC class II-restricted T cell activation by direct and indirect allorecognition. 31 The tissue macrophages are one of the effector cells against injury and scaffold implantation, which could have led to modulation of their own phenotype and surrounding cells. M1 macrophages are characterized by the high expression of MHC II and iNOS apart from the pan macrophage marker, CD68, whereas M1 macrophages are characterized by M2-associated genes, such as Arg1, Mrc1, CD163, and transforming growth factor β1. 32
We focused on the identification of mainly two broad phenotypes of macrophages—M1 (proinflammatory) and M2 (anti-inflammatory), which are reported to regulate a host of inflammatory cytokines following implantation.
With genomic analysis, we detected pan, M1, and M2 macrophage subsets (CD68-pan macrophage, CD163-M2 macrophage, MRC-1-M2 macrophage, and iNOS-M1 macrophage). Interestingly, two M2 macrophage lineage genes (CD163 and MRC1) and the anti-inflammatory cytokine, IL-10, expression was found to be at the highest level in the syn- and allo-DC O implants. Using immunohistochemistry, we could identify infiltrating macrophages’ infiltration predominantly localized at the muscular area with fewer cells toward the lumen. The syn- and allo-DC O implants showed higher macrophage infiltration compared with the syn- and allo-DC SC implants. The pan macrophage marker, CD68 as well as the M2 macrophage, CD163 expression was uniform across all the syn- and allo- implants at all routes.
The expression of the M1 macrophage, MHC II, was more prominent with the syn-DC and allo-DC O implants, whereas for M1 macrophage, iNOS, there was no uniform expression.
The higher expression of MHC II in syn- and allo-DC O implants is possibly not a favorable sign of graft modulation, which is also mirrored earlier in the histopathological changes. The level of expression for the M2 macrophage, Arg1, was also higher in the O implants. Even though M1 macrophages has been associated with all the syn- and allo-DC O implants, the expression of macrophages particularly the M2 subsets, CD163, Arg1, and MRC 1 could possibly indicate the type of immune response at the implantation route, a possible effort in vivo to promote a favorable environment for remodelling of the implanted scaffolds.33,34
To monitor the expression of the T cell-mediated rejection of implanted tissue, the presence of CD4+ and CD8+ lymphocytes were detected along with the pan T cell marker, CD3+ lymphocytes. Earlier, CD4 protein was also detected as a hub protein by proteomics. Moreover, the CD4+/CD8+ ratio is usually increased after solid allogeneic/alloscaffold transplantation and is an important index for evaluating immune rejection.35,36 Our study showed that the CD3+ and CD4+ cells in the syn- and allo- scaffolds expressed at a significantly higher level possibly suggests the involvement of a sterile inflammation at the implantation route, which is produced irrespective of the genetic backgrounds of the implants. The host response at different routes was similar to nonresorbable foreign material characterized by low-grade chronic inflammation, negligible scaffold degradation, and/or necrosis and fibrosis, which was further supported by our histology and immunohistological findings.
The cellular infiltration reveals the nature of the T cell infiltrate, which is mainly CD4+, suggestive of the absence of a rejection process, which could allow for graft or implant survival for a longer time.
The role of CD4+ T-lymphocytes has been reported to improve scaffold outcome after allogeneic implantation. 37 We have seen earlier from gene expression study the increased expression of the anti-inflammatory cytokine, such as IL-10, in syn- and allo-DC O scaffolds probably triggered by macrophages. The presence of macrophage infiltration has been proposed to have a protective mechanism against tissue damage due to potential crosstalk with a subpopulation of T cells, such as regulatory (Tregs).38,39 The presence of CD31 (PECAM-1), which is normally expressed on early and mature vascular endothelial cells and also observed during our proteomic analysis, could be an indication of repopulation with recipient nonimmune cells.
Loss of endothelium as seen during histology-based assessment possibly could lead to higher incidence of thrombus formation on one hand but reduce the antigen presence and adhesion molecule expression on the other, thus, possibly minimizing inflammatory response against the graft 40 as seen during our study. The endothelial lining was removed to a large extent during the histological processing and was absent in the DC scaffolds and the implants. However, endothelial cells also act as route for leukocyte adhesion rendering them a potent immunostimulatory inflammatory components in response to transplanted tissues.
In terms of the systemic immune response, there were no serum markers suggestive of any enhanced systemic inflammatory responses. All the detected immune markers were found to be at the same level as the SHAM-treated rats. We observed immune responses, which did not alter the scaffold architecture particularly in the syn-DC SC and allo-DC SC implants. The SC route possibly allowed to minimize the ensuing immune responses, whereas the O route prompted a more vigorous immune response leading to alteration in the tissue architecture of the scaffold. The chemical DC strategy used by us was aimed to minimize the tissue architecture damage in terms of the ECM or triggering of an adverse immune reaction, which was minimized in the SC implants. The differential responses of tissue scaffolds placed SC 41 and in the O 42 have been earlier reported and point to the role of innate immune cells particularly macrophages in the scaffold.
Biological scaffolds based on ECM have been shown to normally promote a macrophage switch from M1 to M2 cell population deciding the outcome of postimplantation. However, chemical DC can expose the ECM preventing the beneficial M2 response, which leads to scar tissue formation and alteration of the tissue-specific ECM composition.43–45
The importance of the development of a natural biological scaffold stems from the concern of the fast commercialization of tissue-engineered organs, for example, DC tissue for clinical application in humans by Food and Drug administration (FDA) and European Commission (CE) possibly jeopardizing the patient's safety due to quality control and safety of transplantable organs. 46
From our findings, we could conclude that there was the maintenance of the tissue architecture with the absence of a fibrous capsule around the DC implants. However, we did not evaluate the DC implants for further vascular anastomosis but rather used them as a free-floating scaffold to understand and characterize the alteration of the scaffold/ECM and ensuing immune responses following implantation. The short duration of study for 2 months helped us to understand the dynamics of the ECM components as well as the potential immunological trigger, which is probably not possible with a longer duration of study when the implants would have been either destroyed (allo-) or absorbed (syn-). However, a more dynamic time point study using more shorter intervals of sample collection and a possible longer window of observation is a future option that we would like to explore.
Conclusion
The ECM composition of a biological scaffold, as well as immune responses elicited, decide the outcome of either graft survival or rejection. Hence, it is relevant to choose an appropriate DC strategy for both successful cell engraftment and to avoid detrimental postimplant graft responses. During the current study, we aimed to develop a DC strategy that could help us to retain the native tissue architecture as well as minimize the changes to the ECM and immune responses following graft implantation. Using different genetic backgrounds of the donor and recipients and utilizing two different routes of implantation, allowed us to study the differential expression of both ECM and immune response proteins using elaborate gene and protein characterization tools. The study, which did not use any immunosuppressive agents, helped us to identify the potential signs of immunological trigger of the host in its native state.
We could to a modest degree maintain the tissue architecture as well as the ECM components as observed with both the syn-SC and allo-SC implants. The SC route also helped to minimize the host immune responses, which possibly was the reason for the more conserved tissue architecture compared with the syn- and allo- omental implants. However, mostly the immune responses in both the syn- and allo- implants were identical pointing to the involvement of a sterile inflammation irrespective of the genetic backgrounds of the implants.
The findings from the study are expected to promote further research in this direction to improve upon the DC strategy as well as exploit the different tissue milieu to minimize potential immunological triggers following implantation.
Footnotes
Acknowledgments
The authors would like to thank Rafael Camacho, Center for Cellular Imaging, University of Gothenburg for developing the image analysis pipelines; Dr. Anikó Kovács, Pathologist, Sahlgrenska University Hospital, University of Gothenburg for the Histological interpretation; and Dr. Abdulhussain Haamid, University Veterinarian at Sahlgrenska Academy at Gothenburg University for animal welfare and supervision. They acknowledge the Center for Cellular Imaging at the University of Gothenburg and the National Microscopy Infrastructure (VR-RFI 2019-00217) for providing assistance in microscopy. This article was previously submitted as a preprint ![]() .
.
Authors' Contributions
D.B.: Conceptualization, methodology, investigation, writing, and funding acquisition; N.B.N.: Conceptualization, methodology, investigation, and writing; D.A., M.D., S.G., C.S., and E.B.: Methodology, investigation, and writing; U.U.H.: Methodology; and M.O.: methodology, supervision, writing, and funding acquisition.
Data Availability
Disclosure Statement
The authors declare that they have no known competing financial interests or personal relationships that could have appeared to influence the work reported in this article.
Funding Information
The research was financed by the LUA-ALF, Sahlgrenska University Hospital and Sahlgrenska Academy, University of Gothenburg, Sweden, IngaBritt och Arne Lundbergs Forskningsstiftelse grants to Prof. Michael Olausson and Stiftelsen Professor Lars-Erik Gelins Minnesfond grant to Debashish Banerjee. The funders had no role in the study design, data collection, and interpretation, as well as the decision to submit the work for publication.
References
Supplementary Material
Please find the following supplemental material available below.
For Open Access articles published under a Creative Commons License, all supplemental material carries the same license as the article it is associated with.
For non-Open Access articles published, all supplemental material carries a non-exclusive license, and permission requests for re-use of supplemental material or any part of supplemental material shall be sent directly to the copyright owner as specified in the copyright notice associated with the article.