
Abstract
Tissue engineering by self-assembly uses the cells' secretome as a regeneration template and biological factory of trophic factors. Despite the several advantages that have been witnessed in preclinical and clinical settings, the major obstacle for wide acceptance of this technology remains the tardy extracellular matrix formation. In this study, we assessed the influence of macromolecular crowding (MMC)/excluding volume effect, a biophysical phenomenon that accelerates thermodynamic activities and biological processes by several orders of magnitude, in human corneal fibroblast (HCF) culture. Our data indicate that the addition of negatively charged galactose derivative (carrageenan) in HCF culture, even at 0.5% serum, increases by 12-fold tissue-specific matrix deposition, while maintaining physiological cell morphology and protein/gene expression. Gene analysis indicates that a glucose derivative (dextran sulfate) may drive corneal fibroblasts toward a myofibroblast lineage. Collectively, these results indicate that MMC may be suitable not only for clinical translation and commercialization of tissue engineering by self-assembly therapies, but also for the development of in vitro pathophysiology models.
Introduction
T
Tissue engineering by self-assembly technologies have been extensively studied over the years for the development of implantable devices for various clinical targets, including skin, 7 heart, 8 blood vessel, 9 lung, 10 bone, 11 liver, 12 tendon, 13 and cornea. 14 However, the major obstacle for wide acceptance, clinical translation, and commercialization of such technologies remains the prolonged culture time required to develop an implantable device, even in the presence of a scaffold (e.g., 84 days for corneal stromal layer).15,16 Such prolonged ex vivo culture is often associated with phenotypic drift and cell senescence,17,18 which has triggered investigations into engineering more functional in vitro microenvironments to maintain in vitro cell phenotype and function.19–23 Specifically to corneal repair, a number of studies have utilized complex culture systems to maintain corneal fibroblast phenotype, with variable degree of efficacy, but none of them has actually enabled accelerated extracellular matrix (ECM) production.24–31
In this study, we hypothesize that macromolecular crowding (MMC), a biophysical phenomenon that regulates the intra- and extracellular milieu of multicellular organisms and increases thermodynamic activities and biological processes by several orders of magnitude,32–37 will facilitate accelerated tissue-specific ECM deposition of human corneal fibroblasts (HCFs), while maintaining their function in vitro. Although previous studies have demonstrated that the addition of inert macromolecules in the culture media, following the principles of excluding volume effect, increases the relative concentration of procollagen and proteinases, resulting in propeptide cleavage and subsequent accelerated ECM deposition in the culture of skin and lung fibroblasts,38–40 there is no work to date on cells that are particularly susceptible to phenotypic drift, such as corneal fibroblasts.
Materials and Methods
General materials
All tissue culture plastics were purchased from Sarstedt and Nunc. All chemicals, cell culture media, reagents, carrageenan (CR), and dextran sulfate (DxS; 500 kDa) were purchased from Sigma Aldrich, unless otherwise stated. The Live/Dead® cell viability kit and the alamarBlue® cell metabolic activity kit were purchased from BioSource International.
HCF culture
HCFs (P10872; Innoprot) were cultured according to the supplier's protocol. In brief, HCFs were seeded (5000 cells/cm2) on poly(L-lysine)-coated tissue culture flasks with fibroblast culture medium, buffered with HEPES and bicarbonate and 1.0% penicillin/streptomycin. The cells were incubated at 37°C with 5% CO2/95% air in a humidified incubator up to confluency. The medium was replaced with fresh medium after 24 h and changed after every 2–3 days. The cells used in all experiments were of three to six passages.
Macromolecular crowding
HCFs were seeded at 25,000 cells/cm2. The medium was replaced after 24 h with fresh medium containing the optimum concentration of macromolecular crowders (100 μg/mL of DxS or 75 μg/mL of CR; both negatively charged)39,40 with various concentrations of newborn calf serum (NBCS) or human serum (HS), ranging from 0.0% to 10%. 100 μM L-ascorbic acid phosphate supplement was added in the medium to enhance collagen synthesis. The influence of MMC was assessed at 2, 4, and 6 days in culture.
Analysis of collagen deposition/densitometry
The medium and cell layer were digested separately with 150 μL pepsin (porcine gastric mucosa) solution containing phenol red (100 μg/mL pepsin in 0.05 N acetic acid) per well for 2 h at 37°C at continuous shaking (200 rpm) and neutralized with 1 N NaOH. Samples for sodium dodecyl sulfate–polyacrylamide gel electrophoresis (SDS-PAGE) were prepared using appropriate dilution of water and 5× sample buffer. Finally, 15 μL per sample solution per well was loaded on the gel (5% running gel/3% stacking gel) after 5 min heating at 95°C. Mini-PROTEAN Tetra Electrophoresis System (Bio-Rad) was used for the electrophoresis run. Fifty millivolts potential difference was applied for the initial 30 min, followed by 120 mV for the remaining time. The gels were washed gently in ultrapure water and stained using the SilverQuest™ (Invitrogen, Ireland) silver stain kit, according to the manufacturer's instructions. Images of the gels were taken after brief washing with water. To quantify collagen type I, the gel densities (GeneTools software; Syngene) of collagen α1(I) and α2(I) chains were evaluated and compared with the band densities of standard collagen type I (Symatese Biomateriaux).
Matrix metalloproteinase analysis
Gelatin zymography was used to assess matrix metalloproteinase (MMPs) activity. The culture media were collected after each incubation time and mixed with nonreducing SDS sample buffer (125 mM Tris-HCl, pH 6.8, 20% glycerol, 2% SDS, 0.002% bromophenol blue). This was fractionated by SDS-PAGE using 10% gels containing 0.1% gelatin. Gels were washed with two incubations in 2.5% Triton X-100 for 30 min. The gels were then incubated for 18 h at 37°C in a reaction buffer containing 50 mM Tris, pH 7.4, 5 mM CaCl2, 1.0 μM ZnCl2 and finally stained with 0.5% Coomassie G250 brilliant blue for 30 min. Gel images were taken after destaining with 30% ethanol/10% acetic acid. The developed gel bands were compared for relative expression of MMP2. Fresh medium with varying amounts of NBCS or HS were used as control.
Cell morphology
The morphology of HCFs was observed using phase contrast microscopy (Olympus IX81 inverted microscope) at ×100 magnification.
Cell metabolic activity and cytotoxicity
The influence of MMC in cell metabolic activity and viability was evaluated using the alamarBlue and Live/Dead assays. Briefly, 10% alamarBlue reagent was added into the various samples after aspiration of the culture medium and brief washing with PBS. The samples were incubated for 4 h in a humidified chamber at 37°C. After incubation, 100 μL of the alamarBlue reagent from the samples was transferred into a black 96-well plate. Fluorescence of this media was monitored using a microplate reader (Varioskan Flash; Thermo Scientific) at excitation and emission 570 and 600 nm, respectively. The metabolic activity of the samples was calculated using the per cent reduction of dye, according to the supplier's protocol and compared with the control samples having the same medium composition. Cell viability was determined using the Live/Dead viability kit (Invitrogen). Briefly, the samples were incubated with calcium AM and ethidium homodimer solution (2 μM calcein-AM and 4 μM EthD-1) in PBS according to manufacturer's staining protocol for 30 min. Afterward, cell layers were washed with fresh PBS, for the removal of excess dye, and fluorescence images were taken using an Olympus IX81 inverted fluorescence microscope using FITC and Texas red filter for live and dead cells, respectively. Three images per sample were taken for live and dead cells.
Gene expression analysis
The total RNA was extracted using a modified TRIzol isolation method. Briefly, cell layers were washed with PBS, after removing the medium, and TriReagent® (Invitrogen) was added and incubated for 5 min. The cell layer was mechanically disrupted using gentle pipetting. The phase separation was done using chloroform and the total RNA contained in the aqueous phase was purified using the RNeasy® mini kit column (Qiagen), as per supplier's protocol. Three extractions were pooled at the end of the RNeasy protocol. Total RNA purity and quantity were evaluated using an ultraviolet spectrometer (NanoDrop ND-1000 Spectrophotometer; Thermo Scientific). Reverse transcription of extracted mRNA was performed using the MJ Research PTC-200 DNA Engine system (Promega RT System), as per the manufacturer's protocol. The prepared cDNA was evaluated using the SYBR® Green master mix (Qiagen) StepOnePlus™ Real-Time PCR System (Applied Bioscience). Each gene transcription was normalized to the transcription of housekeeping human 18S gene and 2−ΔΔCt method was used to analyze the relative gene expression of target gene at various time points. The primers used for collagens, fibronectin, CD34, CHST6, and alpha smooth muscle actin (α-SMA) are given in Supplementary Table S1 (Supplementary Data are available online at
Immunocytochemistry
For immunocytochemistry (ICC) staining, cells seeded in four-well chambered Lab-Tek™ II slide and MMC treatment was carried out after 24 h of cell seeding with fresh medium having crowder at concentration as above. After incubation at various time points, the cell layer was fixed for 30 min with 3% formaldehyde (freshly prepared from paraformaldehyde [PFA]; Sigma) after PBS washing. The samples were washed three times in PBS. Three percentage BSA for 30 min incubation at room temperature (RT) was used to avoid nonspecific binding. Cell layers were then incubated with primary antibodies for 90 min at RT after dilution with PBS. The following primary antibodies were used: rabbit collagen type I, III, IV, V, and VI (1:200; Abcam); and mouse anti-fibronectin (1:200; Sigma Aldrich). Mouse anti-actin, α-smooth muscle antibody (1:400 dilution), CD34 antibody (1:50 dilution), and keratocan antibody (1:50 dilution) were also used. For the detection of CD34, cold methanol fixing (cold methanol at −20°C for 5 min) was used after PFA fixation. The samples were incubated with secondary antibody for 30 min at RT after primary antibody incubation. The secondary antibodies used were Alexa Fluor® 488, chicken anti-rabbit or donkey anti-mouse against rabbit or mouse antibodies at the 1:400 dilutions (Invitrogen). The antibody incubation was followed by three brief washes with PBS. For nuclear staining, 4′,6-diamidino-2-phenylindole (DAPI) was used at 1:4000 dilution (Invitrogen) after postfixation with 3% PFA. Finally, the coverslips were mounted on glass slides with VectaShield (Vector Laboratories) for direct observation. Images were taken using an Olympus IX81 inverted fluorescence microscope (Japan) with 10× objective. The fluorescence density of the images was assessed using the Scope-Pro Plus software (MediaCybernetics).
Cell sheet production
Thermal responsive polymer technologies were utilized to produce intact cell sheets. Briefly, 65% N-isopropylacrylamide (NIPAAM)/35% N-tert-butylacrylamide (NTBA) copolymer [p(NIPAAM-co-NTBA)] was dissolved in absolute ethanol at 40 μg/mL and left for continuous shaking overnight. This polymer solution was mixed with poly(L-lysine) (100 μg/mL) at 1:1 V/V ratio and kept under stirring overnight. One hundred microliters of the mixed solution was poured and spread evenly onto Petri dishes, followed by incubation in an ethanol-soaked desiccator overnight. The Petri dishes were further dried in a 600 mBar vacuum oven at 40°C for 3–4 h. HCFs were seeded at 50,000 cells/cm2 after UV sterilization of the Petri dishes for 2 h. MMC treatment was carried out after 24 h of cell seeding with fresh medium and 0.5% HS. The culture dishes were kept in a humidified incubator at 37°C and after 4 days of incubation, the intact cell sheets were detached from the Petri dishes that were kept on a temperature-controlled plate at reduced temperature (10°C) for the transition of polymer to hydrophilic state.
Cell sheet morphology (transparency) analysis
The morphology of HCFs cell sheets was evaluated using phase contrast microscopy at magnification ×40 (Olympus IX81 inverted microscope).
Cell sheet light transmission analysis
After the crowding treatment, the cell layers were washed with PBS and 100 μL PBS was added in each sample well. A well with PBS only was used as control/blank. To maintain the zero absorbance and 100% absorbance value, the unused wells and black dye were used; this black dye showed ∼100% absorbance, that is, nearly nil transmittance, whereas the absorbance value in air (unused wells) was taken as 100% transmittance as a reference. The optical density of the samples was measured using a spectrophotometer (Varioskan Flash; Thermo Scientific) in visible light range (380–780 nm) wavelength with a resolution of 5 nm and the percentage transmission was calculated using this formula:
Cell sheet atomic force microscopy analysis
HCFs were seeded in four-well Lab-Tek II chamber slides at 25,000 cells/cm2 and after 24 h of seeding MMC treatment done as given above. After 4 days of crowding treatment, cell layers were washed with PBS and fixed with 4% PFA at RT for 15 min. The samples were dehydrated using serial dehydration with 30%, 50%, 70%, 90%, and 100% ethanol after washing with three short PBS washes. Atomic force microscopy (AFM, MFP-3D; Asylum Research) was performed using rectangular Si cantilevers (SSS-NCH; Nanosensors) at nominal resonance frequency of 330 kHz and a spring constant of 42 N/m. AFM images were recorded using amplitude modulation mode in an ambient environment after drying out the samples using nitrogen gas.
Cell sheet Masson's trichrome staining
At the end of culture time, samples were fixed in Bouin's solution for 1 h at 56°C, after fixation with PFA for 15 min. Samples were incubated in Weigert's iron hematoxylin staining for 10 min, after Bouin's incubation and rinsing with running tap water. Then, the samples were placed under running tap water for 10 min and later were washed briefly with distilled water. Samples were stained in Biebrich Scarlet-Acid Fuchsin Solution for 12–15 min and washed again using the distilled water. The samples were differentiated using phosphomolybdic–phosphotungstic acid solution for 15 min. Subsequently, samples were transferred directly to Aniline Blue solution for 10 min. Samples were then exposed to 1% acetic acid solution for 5 min, after brief rinsing with distilled water. The dehydration of the samples was performed quickly using 95% ethanol, absolute ethanol (this step wipes off Biebrich Scarlet-Acid Fuchsin staining) and cleared in xylene after short washing with distilled water. Finally, the images of the stained samples were taken using the IX81 microscope (Olympus) at 100× magnification, after mounting with resinous mounting medium.
Cell sheet Picrosirius red staining
PFA fixed cell sheets were stained with Weigert's hematoxylin for 8 min after several PBS washings and stained with 0.2% phosphomolybdic acid hydrate, after rinsing in tap water. The cell sheets were stained with Picrosirius red for 1 h, followed by washing in acidified water. Dehydration was carried out using a series of ethanol washes (70%, 80%, 90%, and 100%). The final dehydration step was carried out with xylene for 5 min and the slides were mounted using DPX. Finally the images were captured with an Olympus IX-81 inverted microscope.
Statistical analysis
All results are presented as mean±standard deviation. MINITAB™ (version 16; Minitab, Inc.) was used for statistical analysis. Two-sample t-test for pairwise comparisons and ANOVA for multiple comparisons were performed, after confirming that (1) the normal distribution of the samples (Anderson–Darling normality test); and (2) variances of the population were equal to one another (Bartlett's and Levene's tests for homogenicity of variance). If any of the above assumptions were violated, nonparametric statistics were used with Mann–Whitney test for two-samples and Kruskal–Wallis test for multiple comparisons. Each experiment was carried out in biological triplicates. Statistical significance was accepted for p-value <0.05.
Results
Identification of optimal culture period and % NBCS for maximum ECM deposition
SDS-PAGE and supplementary densitometric analysis (Supplementary Figs. S1 and S2, respectively) revealed that in the absence of crowding molecules collagen remained in the media, while in the presence of crowding molecules collagen was deposited in the cell layer. At day 4, CR induced the highest collagen deposition, independently of the NBCS concentration (p<0.001; Supplementary Figs. S1 and S2). The enhanced MMP activity, as a function of increased NBCS concentration (Supplementary Fig. S3), resulted in no significant difference in collagen deposition between the different NBCS concentrations (p>0.05), at a given time point (Supplementary Figs. S1 and S2). Collagen deposition was significantly increased from day 2 to 4 and plateaued from day 4 to 6 for a given NBCS concentration for noncrowded and crowded groups (Supplementary Figs. S1 and S2), as a function of MMP activity (Supplementary Fig. S3). Phase contrast microscopy revealed that HCFs maintained their spindle morphology for all NBCS concentrations, time points, and crowding molecules (Supplementary Fig. S4). No significant difference (p>0.05) in cell metabolic activity (Supplementary Fig. S5A) and cell viability (Supplementary Fig. S5B) was observed, as a function of crowding molecule, NBCS concentration, and time in culture.
Influence of serum origin in ECM deposition
SDS-PAGE (Supplementary Fig. S6) and supplementary densitometric analysis (Fig. 1A) revealed significantly higher collagen deposition in the presence of HS (p<0.001) at all time points, independently of the crowder used, which was attributed to the enhanced MMP activity in the presence of NBCS (Fig. 1B). The highest collagen deposition was detected after 4 days in culture, in the presence of CR (p<0.001; Fig. 1A). Complementary ICC analysis further corroborated the enhanced collagen and fibronectin deposition in the presence of crowders (Fig. 1C). Phase contrast microscopy revealed that HCFs maintained their spindle morphology at all time points, independently of the crowder used or serum origin (Supplementary Fig. S7). No significant difference (p>0.05) in cell metabolic activity (Supplementary Fig. S8A) and cell viability (Supplementary Fig. S8B) was observed between NBCS and HS, independently of the crowder used and time in culture.
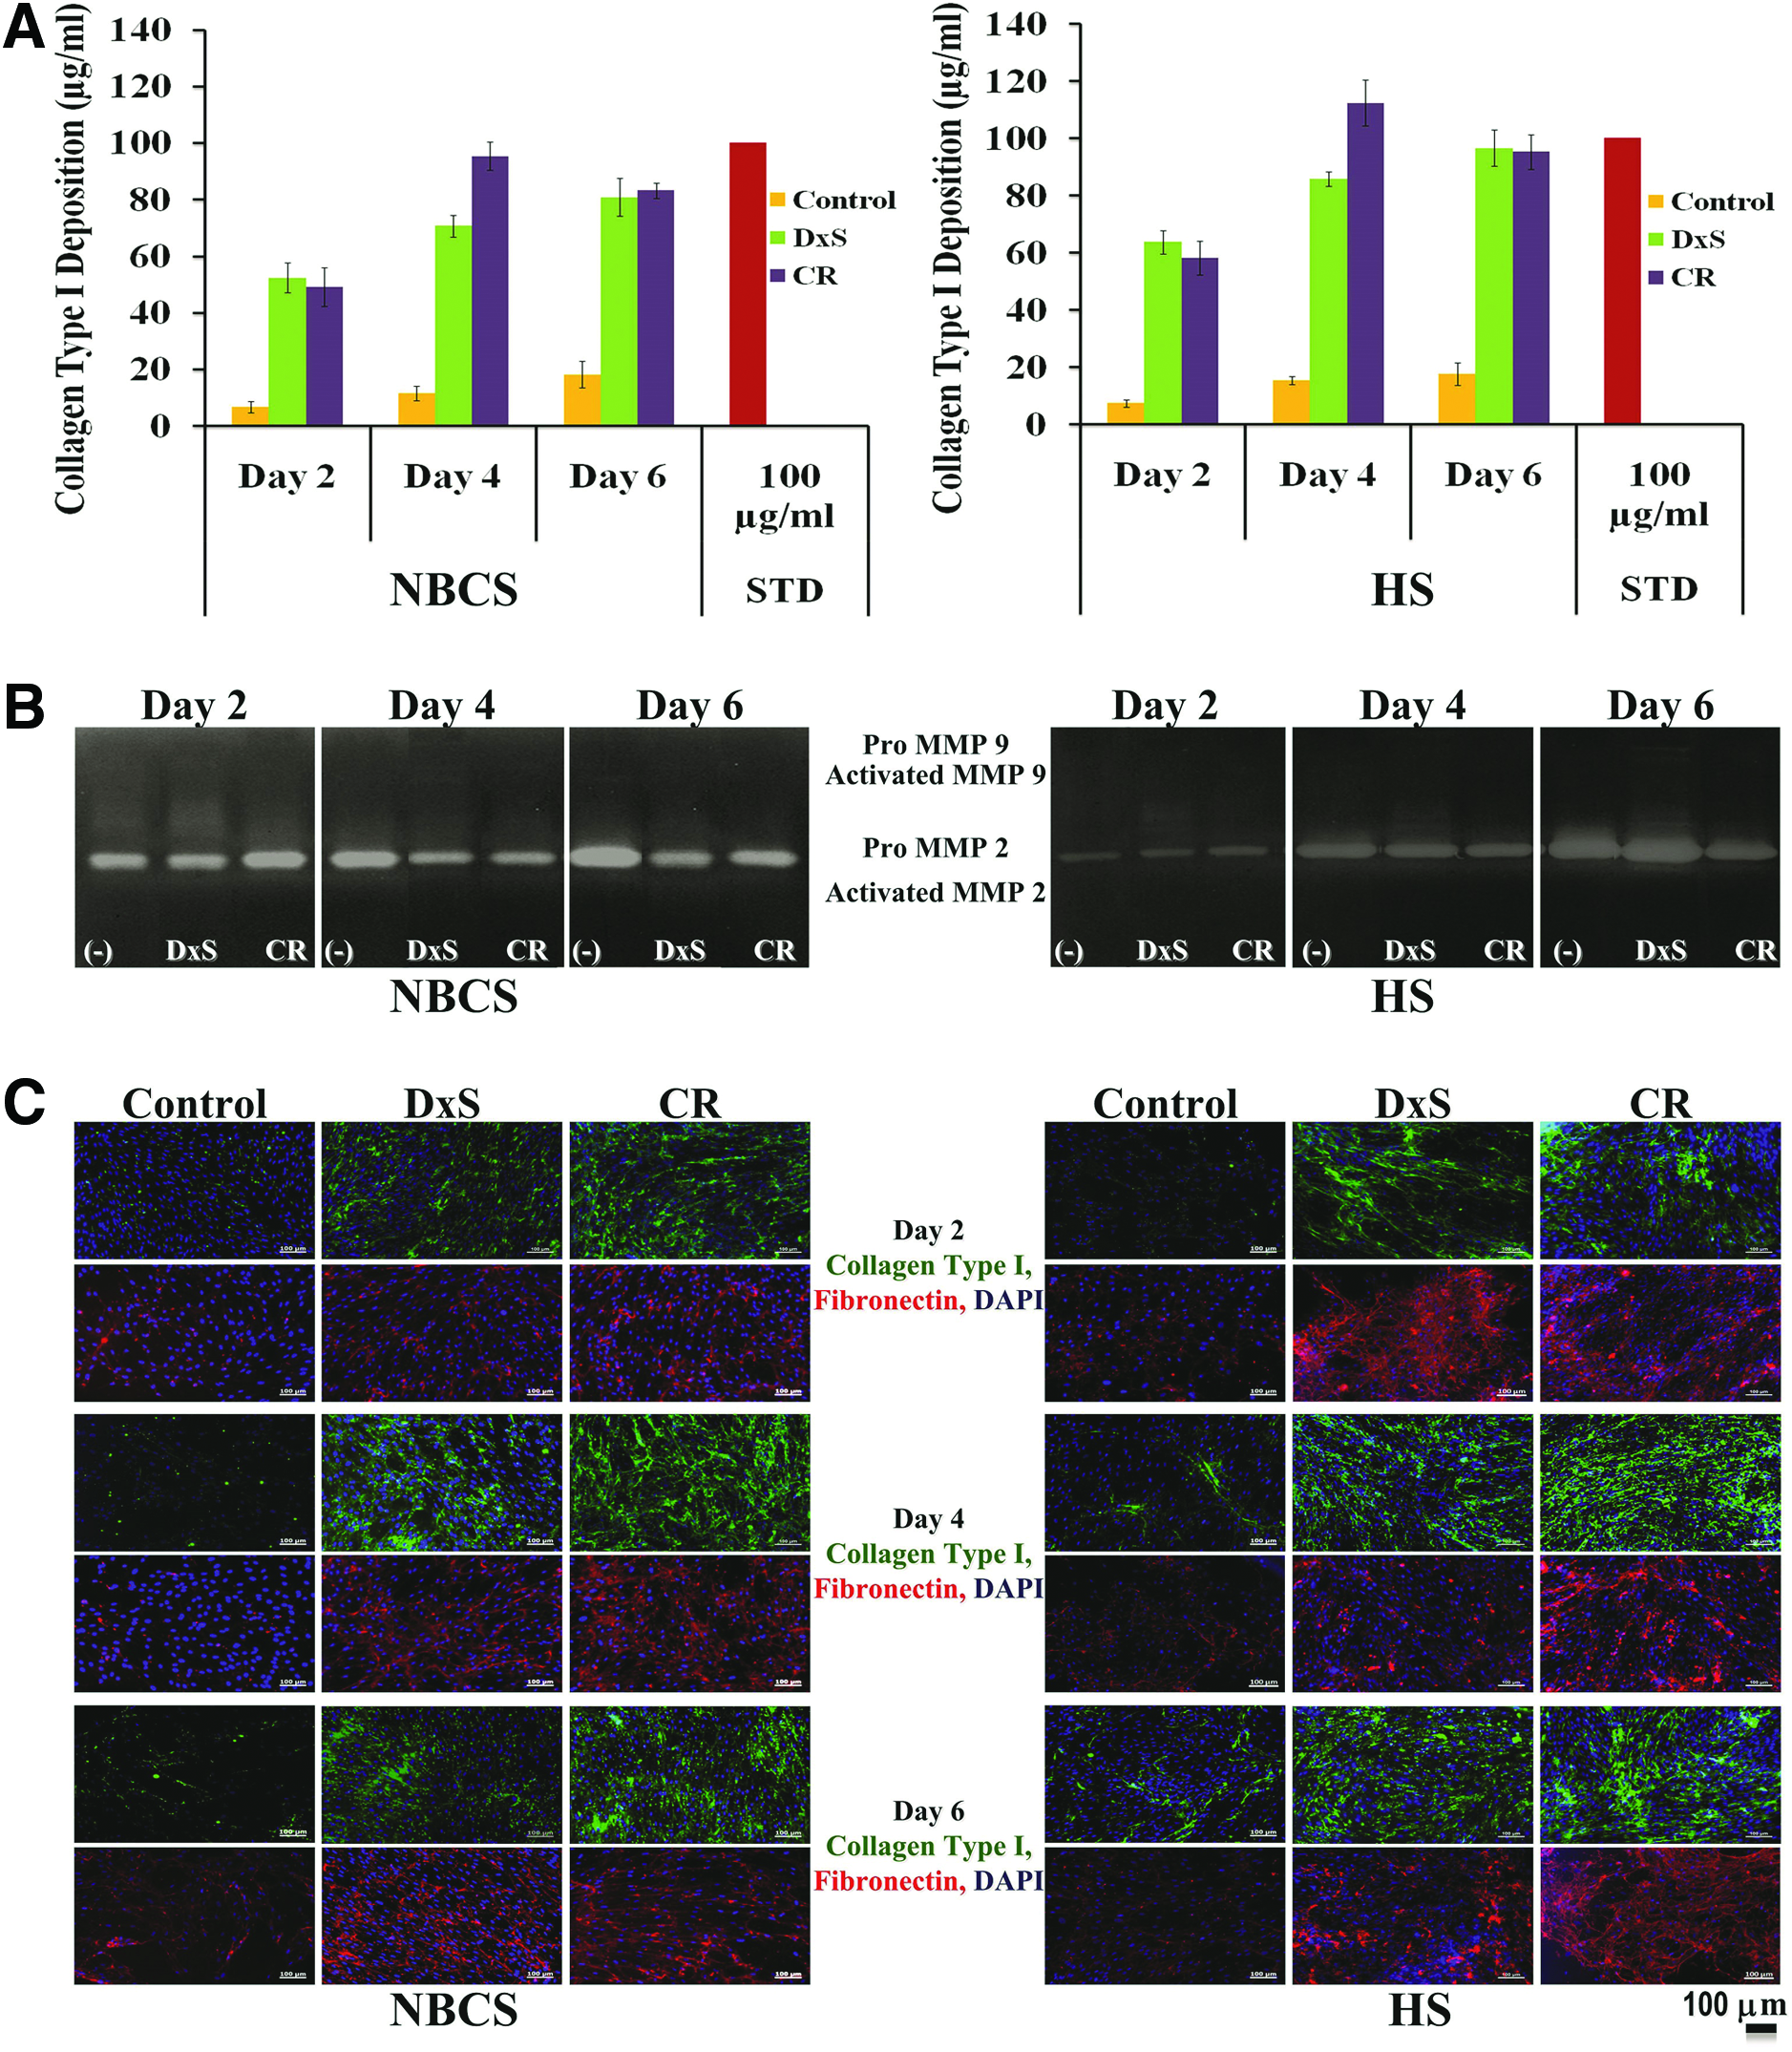
Macromolecular crowding (MMC) accelerates extracellular matrix (ECM) deposition in human corneal fibroblasts (HCFs) culture in the presence of newborn calf serum (NBCS) and human serum (HS). Densitometric analysis of sodium dodecyl sulfate–polyacrylamide gel electrophoresis (SDS-PAGE) confirmed the high collagen type I deposition in the cell layer as early as 2 days in culture, with the highest deposition after 4 days in culture in the presence of HS
Evaluation of MMC on gene expression of HCFs
Gene expression analysis (Fig. 2) indicated that DxS significantly upregulated the expression of collagen type I, collagen type V, CD34, and α-SMA and significantly downregulated collagen type VI at all time points (p<0.001). Using CR, no significant difference in gene expression profile was detected at day 6 (longest time point; p>0.05; Fig. 2).
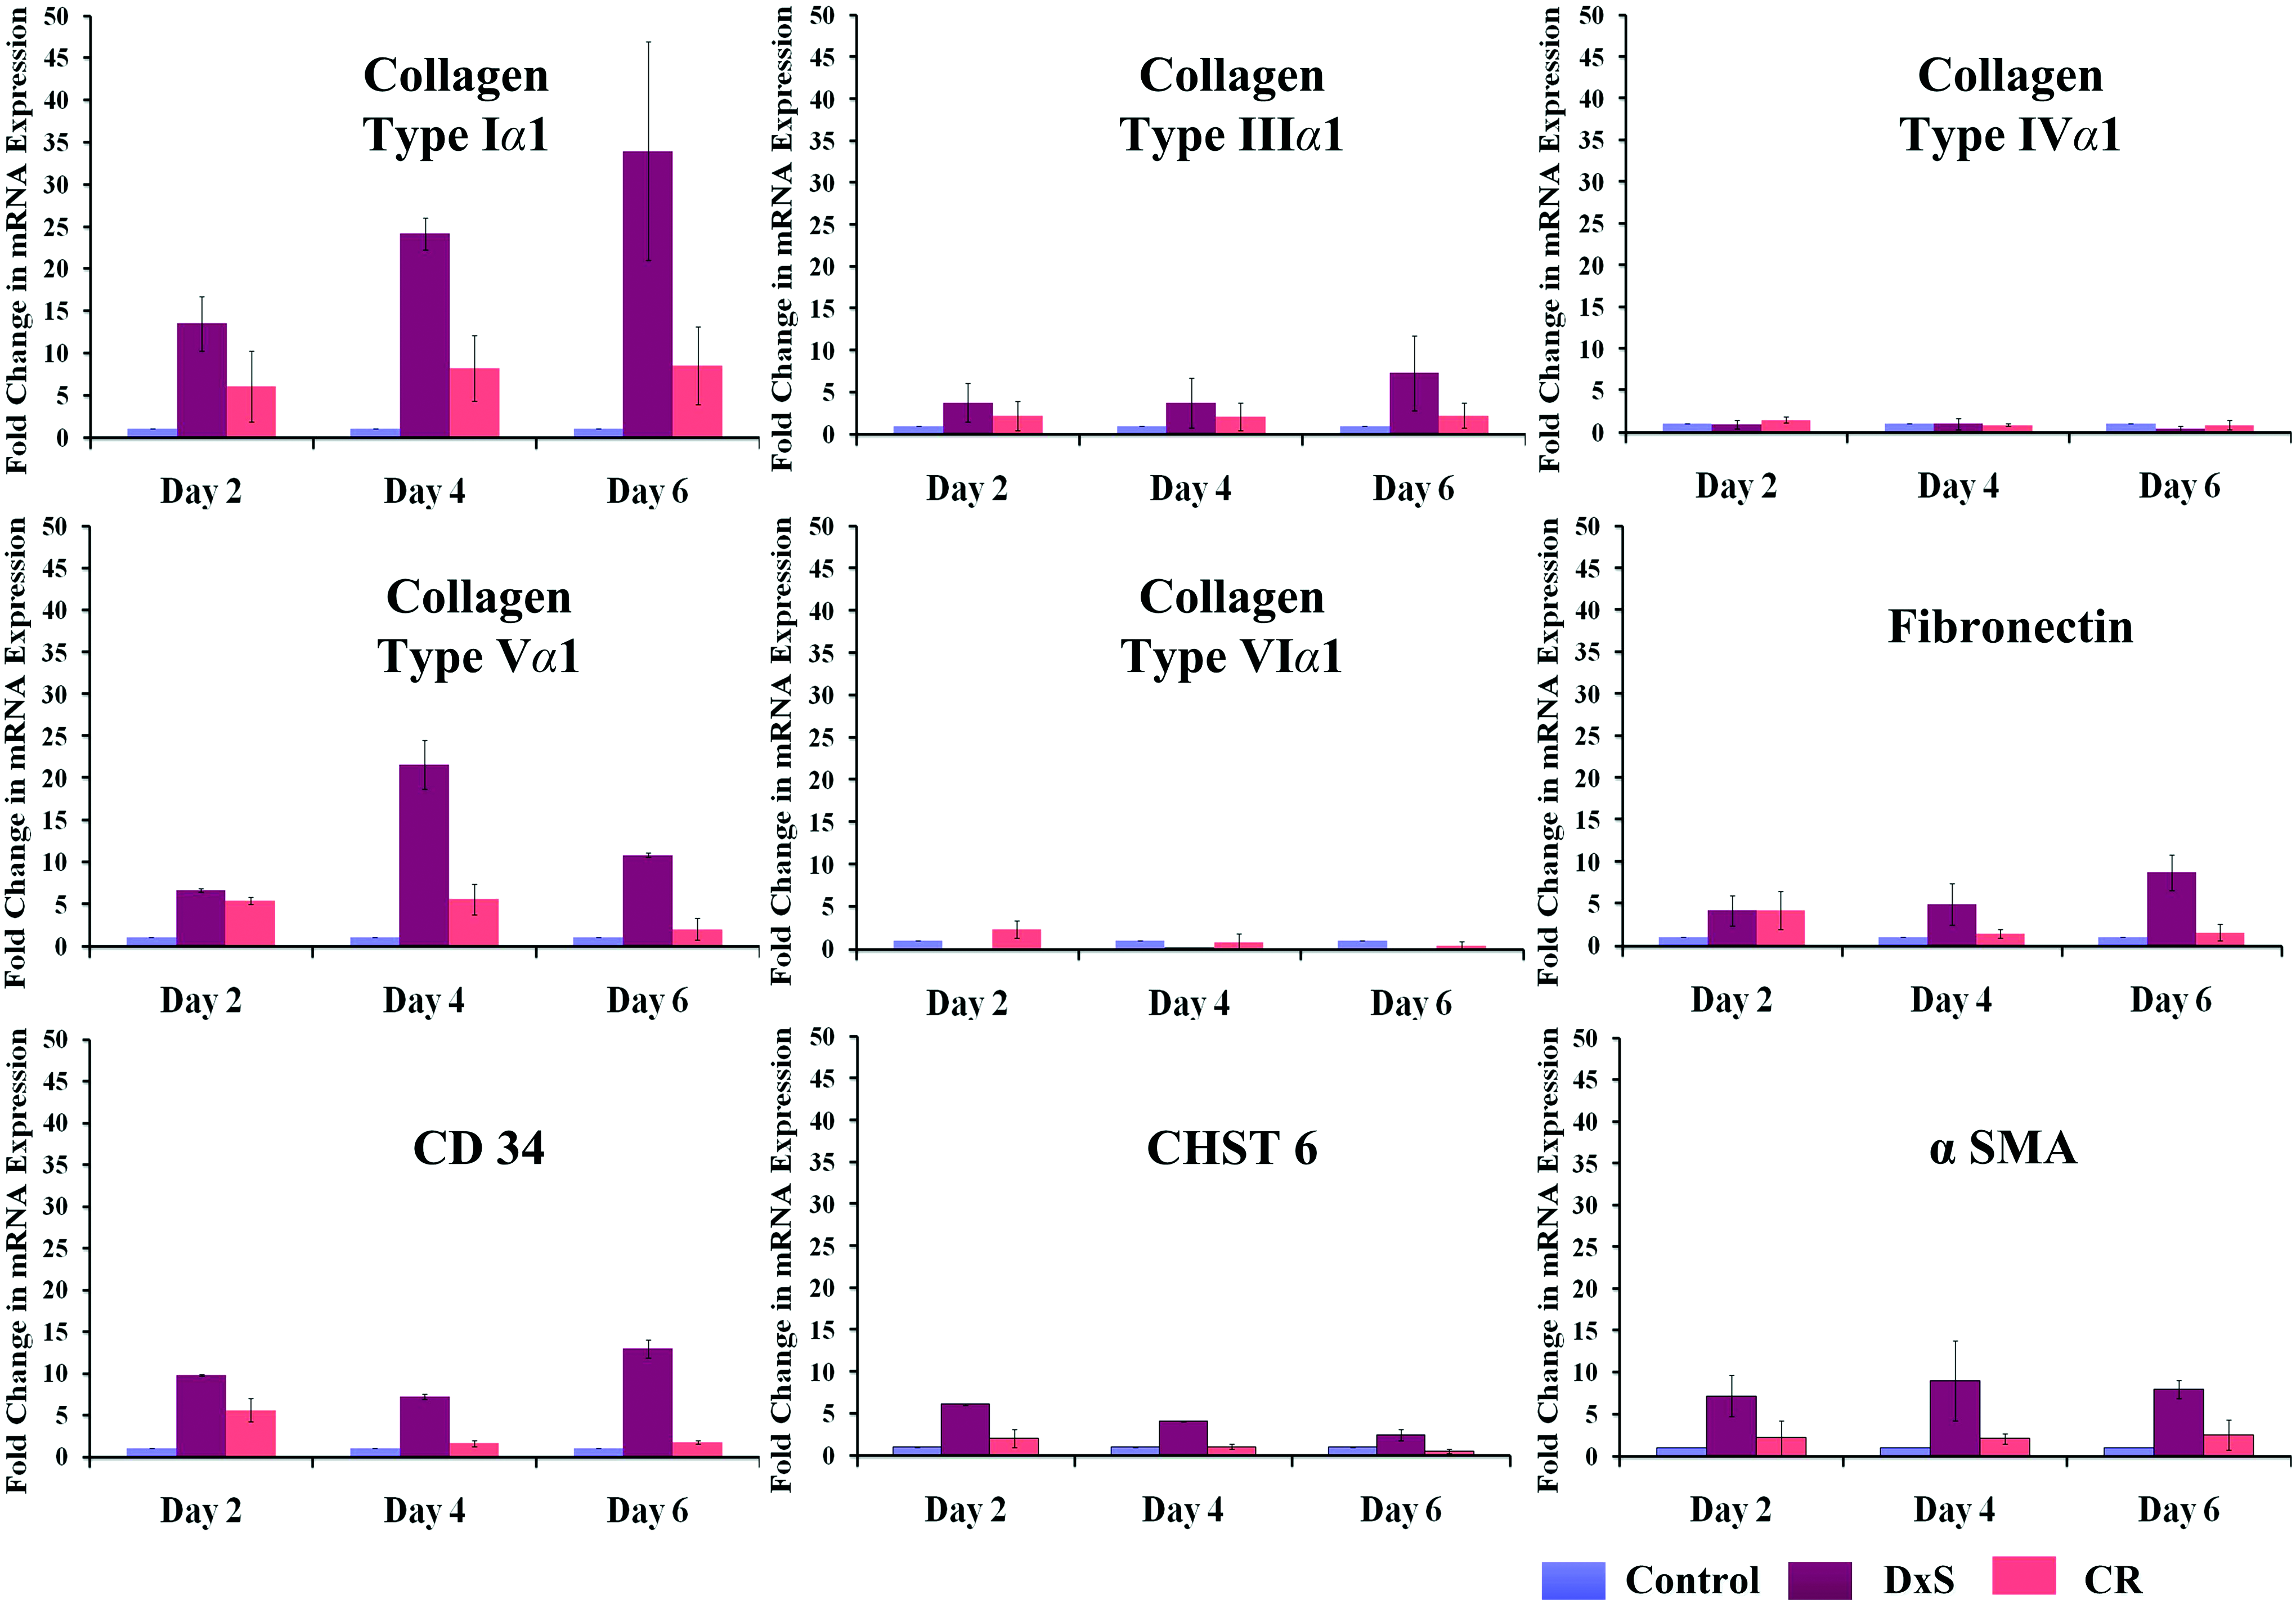
Macromolecular crowders preferentially affect gene expression profile of ECM proteins and cell markers. Real-time polymerase chain reaction analysis demonstrated that CR did not affect the gene expression profile of molecules assessed at day 6, whereas DxS significantly increased gene expression of collagen type I, collagen type V, CD34, and α-SMA at all time points tested. α-SMA, alpha smooth muscle actin. Color images available online at
Evaluation of MMC on protein deposition of HCFs
ICC analysis (Fig. 3) and complementary densitometric analysis (Supplementary Fig. S9) demonstrated enhanced deposition of collagenous proteins (types I, III, IV, V, and VI) and glycoproteins (fibronectin) under MMC conditions, with no difference in α-SMA expression. Independently of the crowder used and the time in culture, HCFs were negative for keratocan and CD34 (Supplementary Fig. S10).
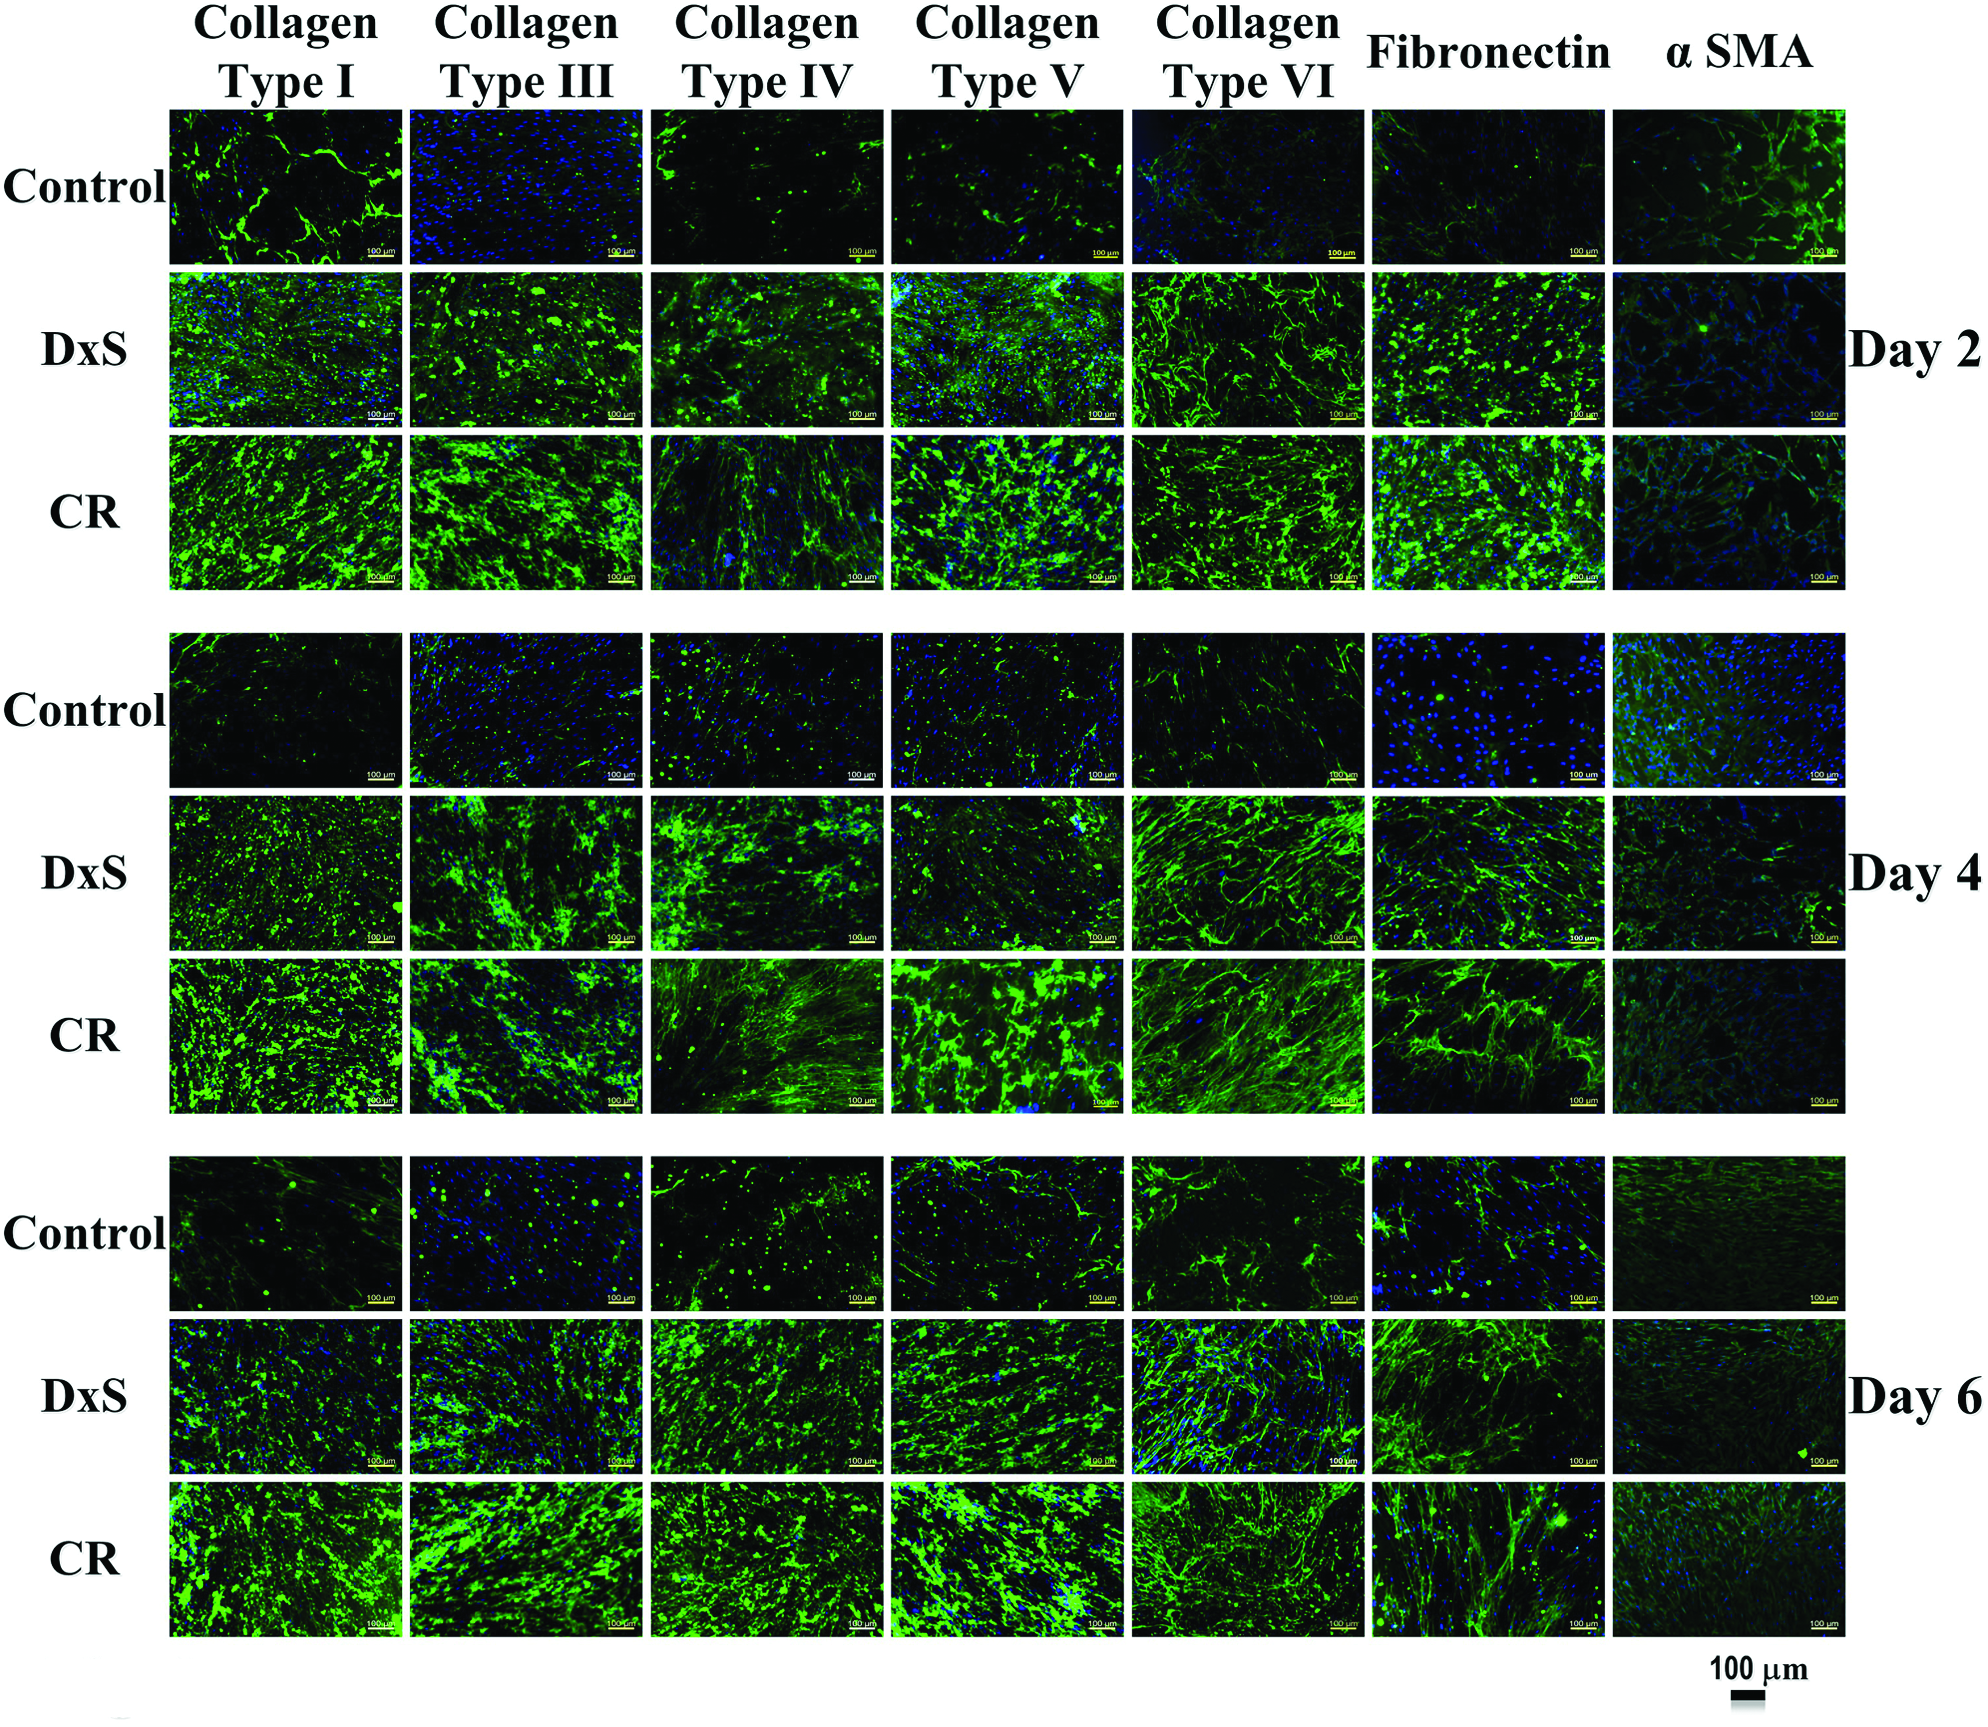
MMC enhanced ECM deposition in the cell layer of HCFs. ICC analysis further confirmed the enhanced deposition of tissue-specific ECM in the presence of macromolecular crowders, whereas myofibroblast transdifferentiation markers (α-SMA) were not expressed. Color images available online at
ECM-rich HCFs sheets production and characterization
The abundant ECM deposition prohibited detachment of intact HCF sheets (Fig. 4A) from commercially available N-isopropylacrylamide (pNIPAAM)-coated dishes, although cell attachment and growth was not affected. Coated dishes with an N-isopropylacrylamide copolymer [65% pNIPAAM/35% N-tert-butylacrylamide (NTBA); p(NIPAAM-co-NTBA)] allowed attachment and growth of HCFs in the absence (Fig. 4B) and presence (Fig. 4C) of CR. Time-lapse microscopy showed a slower detachment rate of the MMC HCFs sheets rather than their noncrowded counterparts, due to the abundant ECM deposition induced under MMC conditions (Fig. 4D and Supplementary Fig. S11). Complete detachment of HCFs sheets was accomplished within 45 min at 10°C; MMC-produced HCFs sheets did not shrink and maintained their structure, due the abundant deposited ECM (Fig. 4E). Histological analysis using Masson's trichrome staining (Fig. 5A) and Picrosirius red (Fig. 5B) and ICC analysis for collagen type I (Fig. 5C) and collagen type VI (Fig. 5D) further corroborated the enhanced ECM deposition HCFs living substitutes under MMC conditions. No significant difference (p>0.05) in transparency between PBS buffer, control surface, non-MMC, and MMC HCFs living substitutes was detected (Fig. 5E). AFM analysis revealed the presence of ECM in the intercellular regions of the HCFs living substitutes produced under MMC conditions (Fig. 5F).

HCFs sheet production. The ample ECM deposition prohibited detachment of intact cell sheets from commercially available N-isopropylacrylamide (pNIPAAM)-coated dishes

HCFs sheet characterization. Histological analysis with Masson's trichrome
Discussion
Cell-based therapies encompass removal of cells from their optimal in vivo setting and expansion in vitro to attain sufficient numbers and to subsequently develop a tissue substitute. However, cell growth, in the still primitive in vitro microenvironment, is often associated with phenotypic drift and cell senescence. It is, therefore, imperative to develop more functional in vitro microenvironments to enable clinical translation and commercialization of cell-based therapies. In this study, we assessed the bifacet potential of MMC in tissue engineering and regenerative medicine: first to enable the accelerated production of tissue-specific ECM-rich living substitutes by promoting the supramolecular assembly of cellular secretome in higher order tissue-like modules; and second to allow in vitro propagation of cells, while maintaining their native functions.
SDS-PAGE, densitometry, and ICC analysis demonstrated that MMC significantly enhanced ECM deposition, with over 10- to 12-fold increase after 4 days in culture in the presence of CR and 0.5% NBCS and 0.5% HS, respectively. This is in accordance to previous studies that demonstrated that negatively charged macromolecules (e.g., DxS and CR) accelerate tissue-specific ECM deposition, recognizing CR as the most effective crowder, due to its inherent polydispersity that achieves more effective volume occupancy/exclusion and thus higher ECM deposition. 40
The constant or not increased ECM deposition as a function of serum concentration, serum origin, and time in culture was attributed to the enhanced proteolytic activity that resulted in the degradation of deposited ECM, independently of the crowding molecule used. Although it would have been expected that α2 macroglobulin, a known MMP inhibitor present in sera, to suppress the MMP activity, previous studies have demonstrated an increased MMP activity in both animal and HS as a function of increased serum concentration, 40 which appears to overwhelm α2 macroglobulin activity. This finding is of significant importance as: (1) high serum concentration increases development costs; (2) prolonged exposure to serum results in phenotypic drift of corneal cells in culture27,41; and (3) the use of HS, as opposed to animal sera, avoids potential interspecies transmission of disease and severe immune reactions, supporting further its use for the development of clinically relevant cell therapies.42–50
Subsequent gene analysis for ECM proteins and cell markers revealed that CR did not affect the gene expression profile of HCFs at day 6, whereas significant upregulation in collagen type I, collagen type V, CD34, and α-SMA was observed in the presence of DxS. This observation, with respect to DxS, can be attributed in two, rather contradictory, theories. The first theory is that DxS promotes physiological tissue formation, given that collagen type V is a regulatory fibril-forming collagen that is colocalized with collagen type I in human cornea and plays a pivotal role in fibril and ECM assembly during tissue development and growth, whereas dysfunctional regulation results in loss of transparency.51–53 This theory is also supported by the observed upregulation of CD34, downregulation of which is associated with a myofibroblast differentiation, corneal pathophysiology, and scarring.26,54,55 The second theory is that DxS promoted transdifferentiation to a myofibroblast phenotype, as evidenced by upregulation of α-SMA and collagen type I.56–58 Moreover, DxS has been used previously as a means to create an in vitro scar model, 59 which further enhances this notion. In any case, SDS-PAGE demonstrated that in the presence of CR, collagen type V was deposited, which indicates that CR supports a more physiological tissue formation.
ICC analysis demonstrated that HCFs were negative for α-SMA, CD34, and keratocan. This is not surprising, given that the expression of these markers rapidly declines in low-density cultures, 60 after exposure to serum61–63 and as a function of time in culture.64–67 Nonetheless, this is of significant importance as CR may be further investigated for regenerative purposes, while DxS may be used for drug discovery purposes, further enhancing the multifaceted potential of MMC.
The abundant deposition of ECM, in the presence of CR, prohibited detachment of intact HCFs sheets using commercially available pNIPAAM dishes. However, a fully characterized p(NIPAAM-co-NTBA) copolymer68–71 afforded complete detachment of dense, cohesive, and structurally aligned corneal stromal tissue modules within 4 days in culture with intact cell–cell and cell–ECM junctions and high % transmittance, similar to native corneal stromal and previously produced scaffold and scaffold-free equivalents.72–75 This enhanced deposited ECM as a result of MMC overcomes the need of high cell populations, often not available and multilayer cell sheets that due to poor nutrient transport and waste accumulation result in cell necrosis in the central layers. 76
In summary, MMC resulted in fast (4 days) and enhanced (10- to 12-fold) tissue-specific ECM deposition in HCFs culture, as opposed to traditional methods that require months in culture. Morphological and protein analysis confirmed corneal stromal-like architecture and composition. Gene analysis indicated that different crowding molecules preferentially drive HCFs phenotype in culture with tremendous potential in regenerative medicine and drug discovery. Overall, MMC provides an alternative approach in the field of cell-based therapies with considerable clinical implications.
Footnotes
Acknowledgments
The authors thank Dr. Oliver Carroll and Dr. Estelle Collin for technical support. The authors also thank Mr. Maciej Doczyk (
Disclosure Statement
The authors declare no competing financial interests.
References
Supplementary Material
Please find the following supplemental material available below.
For Open Access articles published under a Creative Commons License, all supplemental material carries the same license as the article it is associated with.
For non-Open Access articles published, all supplemental material carries a non-exclusive license, and permission requests for re-use of supplemental material or any part of supplemental material shall be sent directly to the copyright owner as specified in the copyright notice associated with the article.