
Abstract
Mesenchymal stromal cells (MSCs) have particular properties that allow their use as therapeutic strategies for several cell-based applications. Historically, bone marrow (BM)-MSCs are isolated by culture adherence since specific cell surface markers are yet to be developed. This original work aimed to identify and characterize isolating expanded BM-MSCs based on their aldehyde dehydrogenase (ALDH) activity known to be a hallmark of stem cells and relevant for their isolation. We thus isolated by fluorescence-activated cell sorting technology two functionally different populations of BM-MSCs depending on their ALDH activity (ALDH+ and ALDH−). Transcriptome analysis and profiling clearly demonstrated that both populations of BM-MSCs present distinct pattern of genes related to the main properties of MSCs (proliferation, response to hypoxia, angiogenesis, phenotype, stemness, multilineage, hematopoiesis, immunomodulation) in an ALDH activity dependent manner. Both BM-MSC populations look to significantly differ in terms of biological responses and functionalities. More functional analyses are needed to understand and characterize the properties of these ALDH populations. Collectively, our results highlight ALDH activity as a potential feature for isolating and segregating functional and/or competent subset of BM-MSC populations, which may account for better and more efficient therapeutic issue.
Introduction
M
For clinical applications, a single marker-based selection to isolate and enrich MSCs after one run would be of great interest as it would participate in the preservation of cell viability, time saving, ensuring reproducibility, and avoiding contamination. The identification of a primitive brain-derived neural stem cell population was previously achieved based on their aldehyde dehydrogenase (ALDH) activity. 11 ALDH is a vast family of detoxifying enzymes and, thus, is involved in important physiological processes of stem cells. 12 Several tissues were reported to be enriched with stem and progenitor cell populations showing high ALDH activity. 13
Currently, ALDEFLUOR, a fluorescent substrate likely to be metabolized by different ALDH isoforms, allows to detect ALDH activity.14,15 Dolle et al. set up a liver progenitor cell (LPC) isolation procedure based on ALDH activity. Thus, a subset of LPCs displaying high ALDH activity was successfully isolated by fluorescence-activated cell sorting (FACS).
16
In this work, the main objective was to identify and isolate using FACS technology different MSC populations based on their ALDH activity. We then performed a characterization of these cells based on the expression of several genes (Supplementary Table S1; Supplementary Data are available online at
Materials and Methods
Isolation, culture, and expansion of bone marrow MSCs
This study was approved by the local ethics committee (Institut Jules Bordet, Belgium). Bone marrow (BM) was harvested from the sternum or iliac crest of healthy volunteers (n = 6) after written informed consent, and MSCs were isolated by classical adhesion method as previously described. 8 Characteristics of the donors are summarized in Supplementary Table S2. In all experiments, MSCs were evaluated at passage two and immunophenotypically characterized according to the ISCT criteria. To evaluate their trilineage potential, MSCs were cultured in specific induction medium to confirm their adipogenic, osteogenic, and chondrogenic differentiations.
Fluorescence activated cell sorting analysis
Cell sorting was conducted using a FACSAria (BD Biosciences, San Jose, CA) as it has been described earlier (see Dolle et al. 16 ). More details can be found in Supplementary Data.
ALDH activity: ALDH-positive and -negative cell population detection and sorting
Fluorescent ALDH substrate (BODIPY®—aminoacetaldehyde [BAAA]/ALDEFLUOR®) can be used to detect and sort ALDH+ cells according to the following principle (Supplementary Fig. S1). As nonpolar fluorescent compound, BAAA diffuses into all intact viable cells. The BAAA is composed of two parts: the BODIPY molecule which contains the fluorescence and the aminoacetaldehyde which is the substrate for ALDH1A1. Cells expressing high levels of ALDH metabolize BAAA into BAA—which is retained intracellularly, and subsequently fluoresce (see Dolle et al.16,17 for further information). The cell population detection and sorting by FACS (the assay buffer used for analysis contains an efflux inhibitor) are detailed in Supplementary Data.
mRNA extraction and gene profiling by quantitative PCR
Total RNA from each cell culture was extracted using the RNeasy® Micro Kit (Qiagen), according to the manufacturer's instructions. Additional details are provided in Supplementary Data.
Statistical analysis
Data are presented as mean ± standard error of the mean. Comparison between sorted fractions was evaluated with the student paired t test (two tailed). GraphPad Prism version 5.00 for windows (GraphPad Software,
Results
Characterization of BM-MSCs
MSCs were characterized according to the ISCT criteria: during the culture, MSCs must be plastic adherent, show a special phenotype, and demonstrate multilineage potential. In culture, these cells displayed a fibroblast-like shape and exhibited a high adherence to plastic. Flow cytometry demonstrated that they were positive (>95%) for CD73, CD90, and CD105 but negative (<5%) for CD14, CD19, CD34, CD45, and HLA-DR. According to ISCT guidelines, MSCs should exhibit this trilineage potential. Cells were thus cultured in specific induction medium to confirm their adipogenic, osteogenic, and chondrogenic lineage differentiation capacities.
Under these conditions, MSCs give rise to adipocytes, osteoblasts, and chondrocytes, respectively, confirmed using lineage-specific cell staining methods. Lipid vacuole formation, mineralization (calcium deposits), and extracellular matrix production (proteoglycan synthesis) corresponding to each lineage commitment were demonstrated by Oil Red O, Alizarin Red S, and Alcian blue (Sigma-Aldrich) staining, respectively.
Optimization of ALDH activity in BM-MSCs
BM-MSCs were sorted based on their ALDH activity by FACS using the ALDEFLUOR Kit. Before any experiment, set up to determine the optimal substrate volume (Supplementary Fig. S2A) and incubating time (Supplementary Fig. S2B) was performed: 0, 10, 20, 30, 40, 50, and 60 min of incubation and a volume of 0, 5, 15, 20, 25, 30, and 40 μL of diethylaminobenzaldehyde (DEAB). As shown, optimal results were obtained with 50 min of incubation and a substrate concentration of 30 μL since it gives the highest ALDH+ population with a low percentage of ALDH+ cells in the presence of DEAB.
Sorting and isolation of BM-MSCs based on ALDH activity
Using these optimal parameters, two populations with high and low ALDH enzymatic activity were thus isolated (ALDH+ and ALDH−). ALDH activity was significantly different in these two populations: 0.56 ± 0.08 arbitrary unit (AU) for the ALDH− and 11.31 ± 0.99 AU for the ALDH+ population, p < 0.0001 (Fig. 1A, B). We obtained a repartition of 13.62% ± 4.37% for ALDH+ and 55.7% ± 4.45% for ALDH− cells.
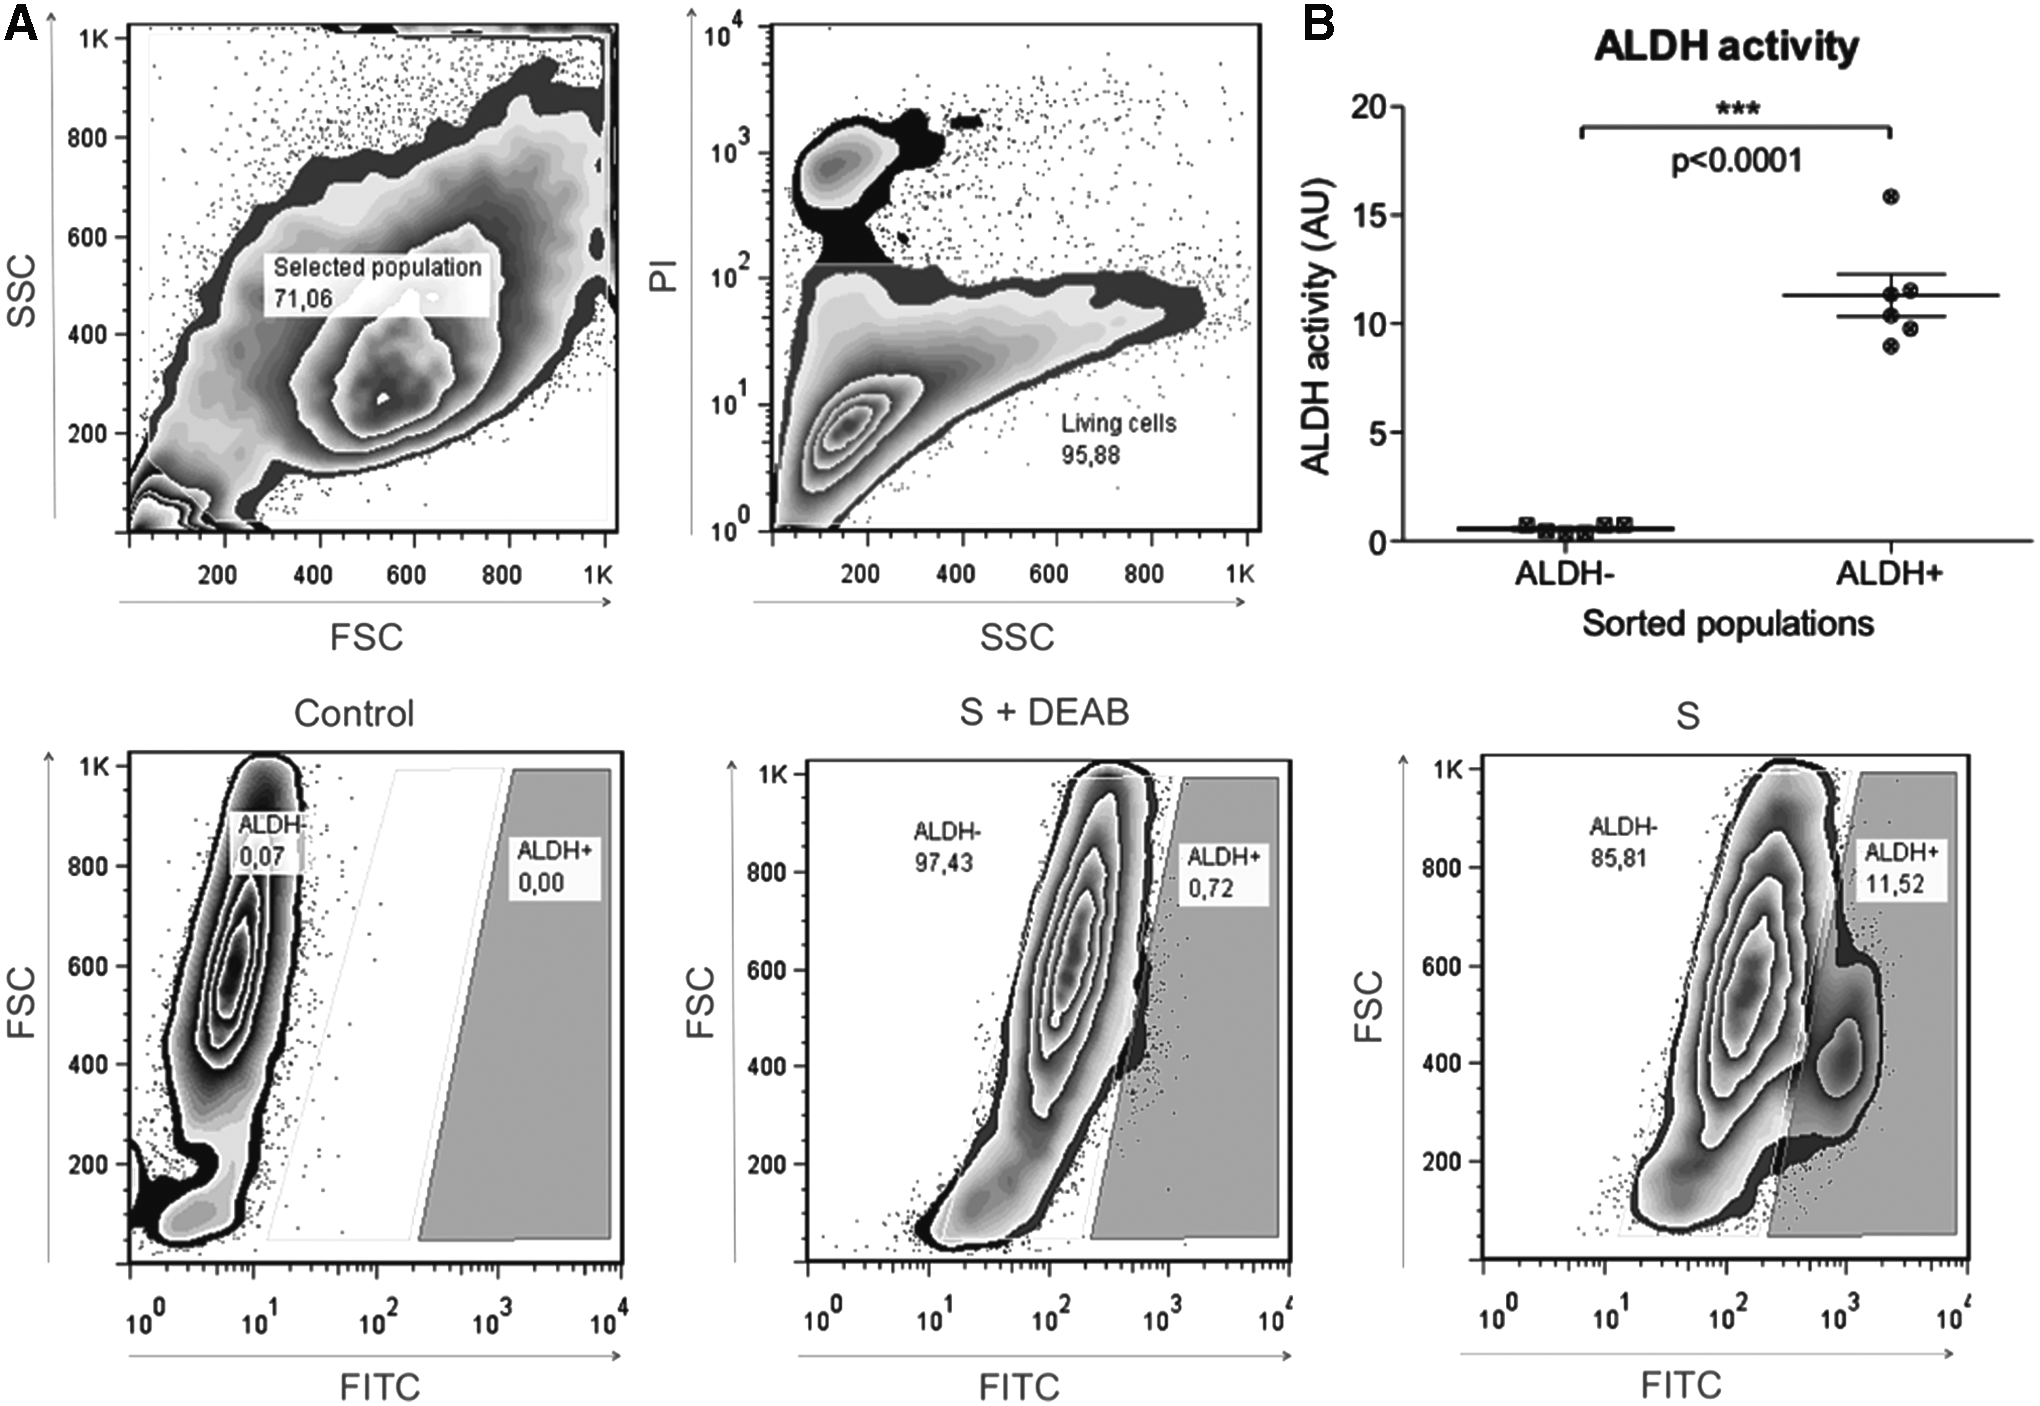
Identification and sorting of BM-MSCs based on ALDH activity.
Gene expression profiling of ALDH+ and ALDH− populations of BM-MSCs
All the next results are summarized in the Supplementary Table S3. The primers used in this work are available in Supplementary Table S4.
Stemness
Nanog; Octamer-binding transcription factor 4 (Oct4); Rex1
The selection according to ALDH activity made possible to isolate an ALDH+ population with a significant higher expression of Oct4 gene (123.8 ± 3.3) compared to the ALDH− population (73.52 ± 2.87, p = 0.003) (Fig. 2). The expression of Nanog did not significantly differ from the ALDH+ and ALDH− (188.9 ± 23.7 and 219.9 ± 11.3, respectively, p = 0.3). The ALDH+ population expressed Rex1 at a significant higher level than the ALDH− population (p = 0.0381). Altogether, the analysis of gene expression related to the stemness property shows that the ALDH+ population is more likely to express pluripotent genes than ALDH− population.
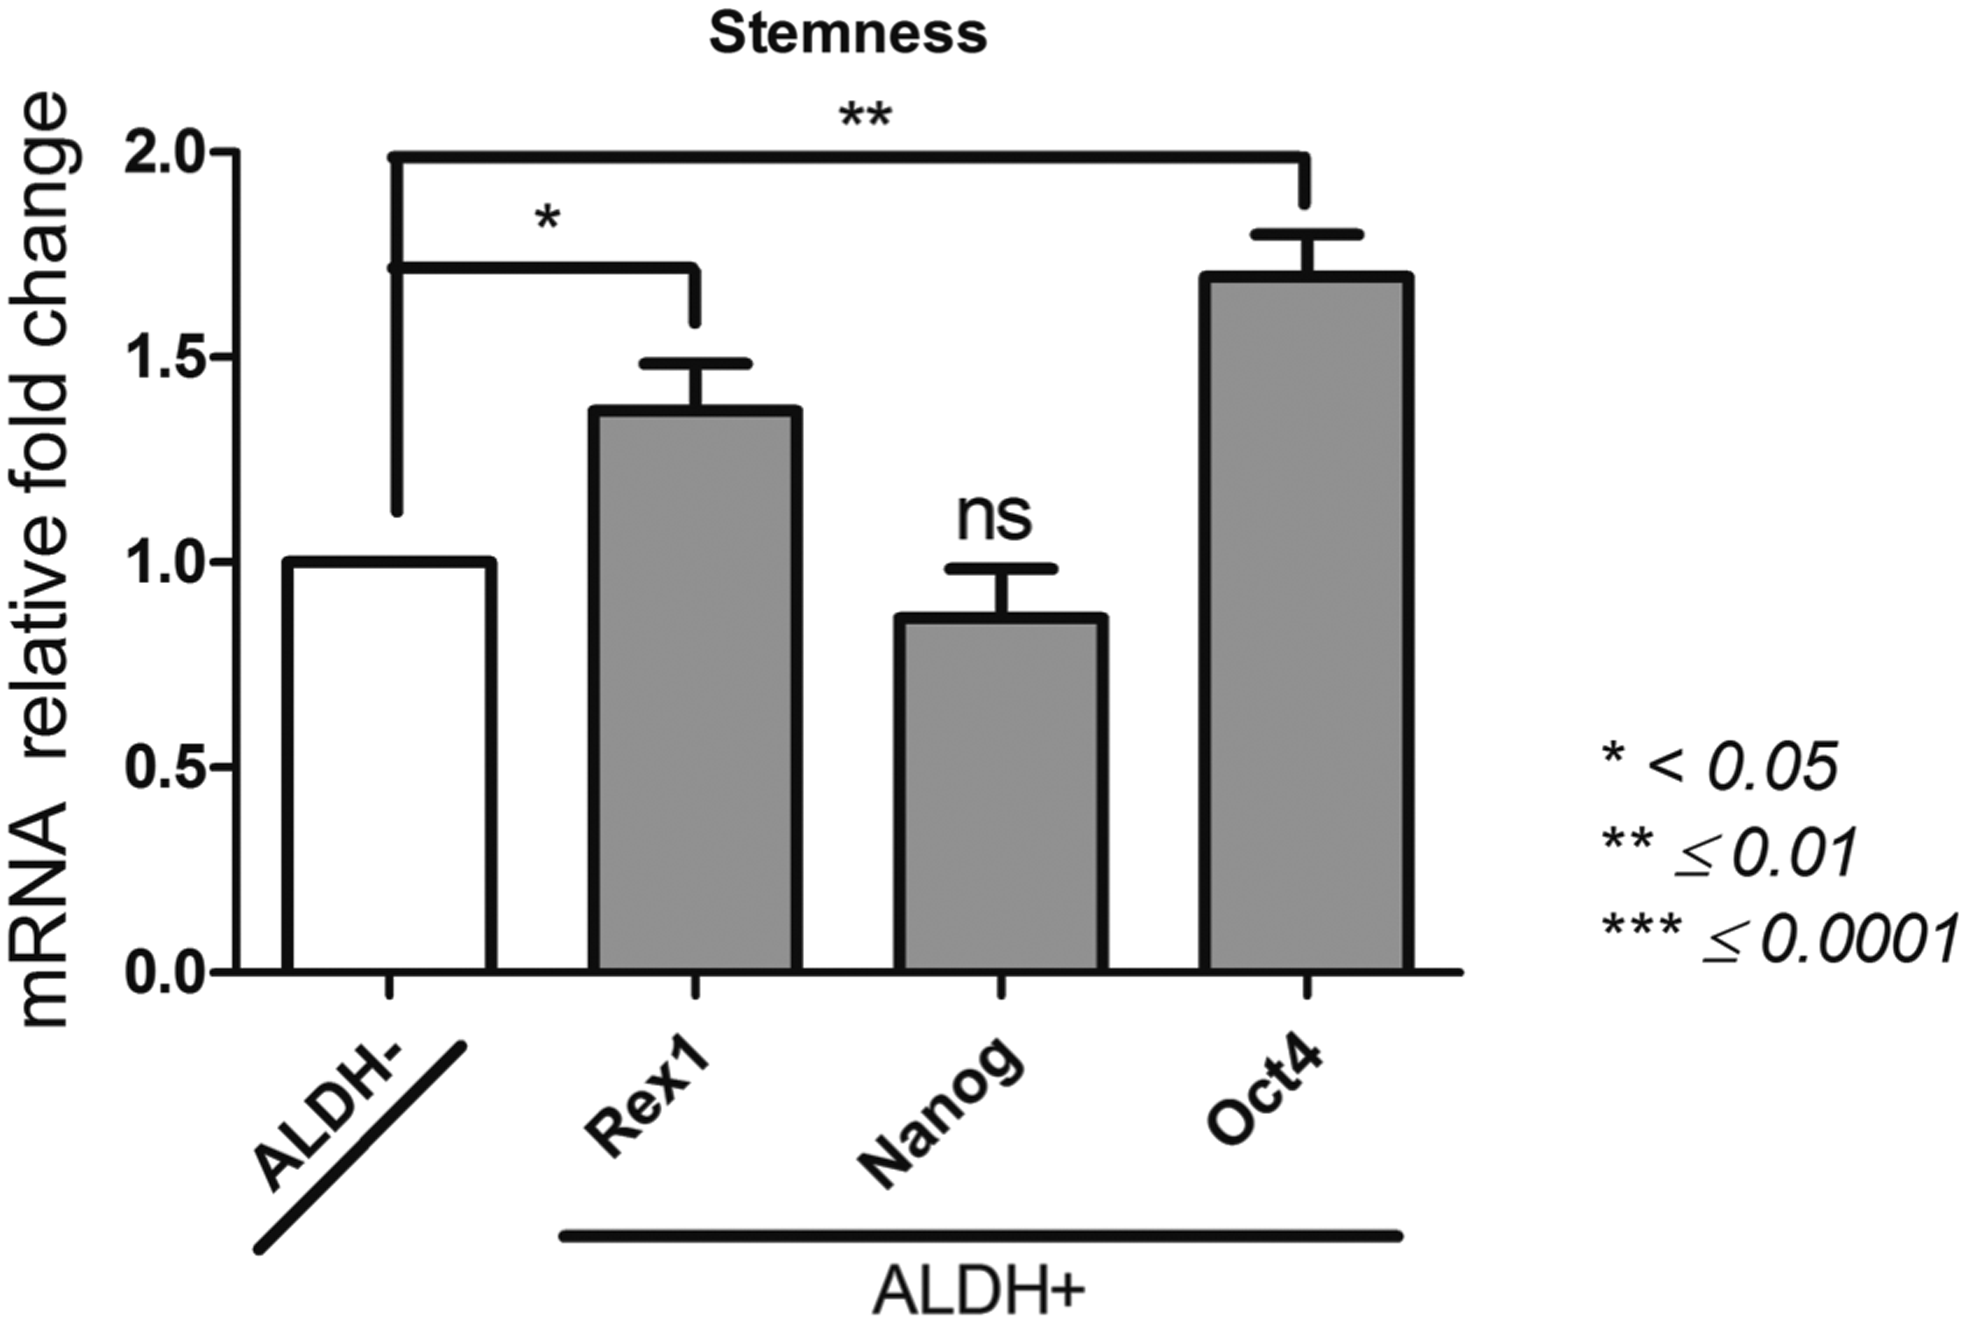
Stemness profile of ALDH+ and ALDH− BM-MSCs. After sorting ALDH+ and ALDH− BM-MSCs by FACS technique, we determined by qPCR their expression of Oct4, Nanog, and Rex1 as description of their stemness. Data concerning ALDH+ cells are presented as fold change of mRNA gene expression relative to GAPDH expression compared to the ALDH− cells. *p < 0.05, **p ≤ 0.01, and ***p ≤ 0.0001. FACS, fluorescence-activated cell sorting; ns, non significant; qPCR, quantitative PCR.
Proliferation/cell cycle
Cyclin A (CCNA), CCNB, CCNE; CDK1, CDK2, Fos proto-oncogene (FosB); p21; p53; p16; retinoblastoma protein (pRB); cell division cycle 25A (CDC25A); signal transducer and activator of transcription (STAT1) (Fig. 3)
Two proliferation/cell cycle gene expression profiles could be seen. The expression of CDK2, FosB, p21, p53, and pRB is significantly higher in ALDH+ population than the ALDH− counterpart, but no significant difference was seen between ALDH+ and ALDH− populations for CCNA, p16, STAT1, and CDK1 genes. For CCNE, CCNB, and CDC25A, the selection of the ALDH+ population correlated with a lower expression of these genes compared to ALDH− population.
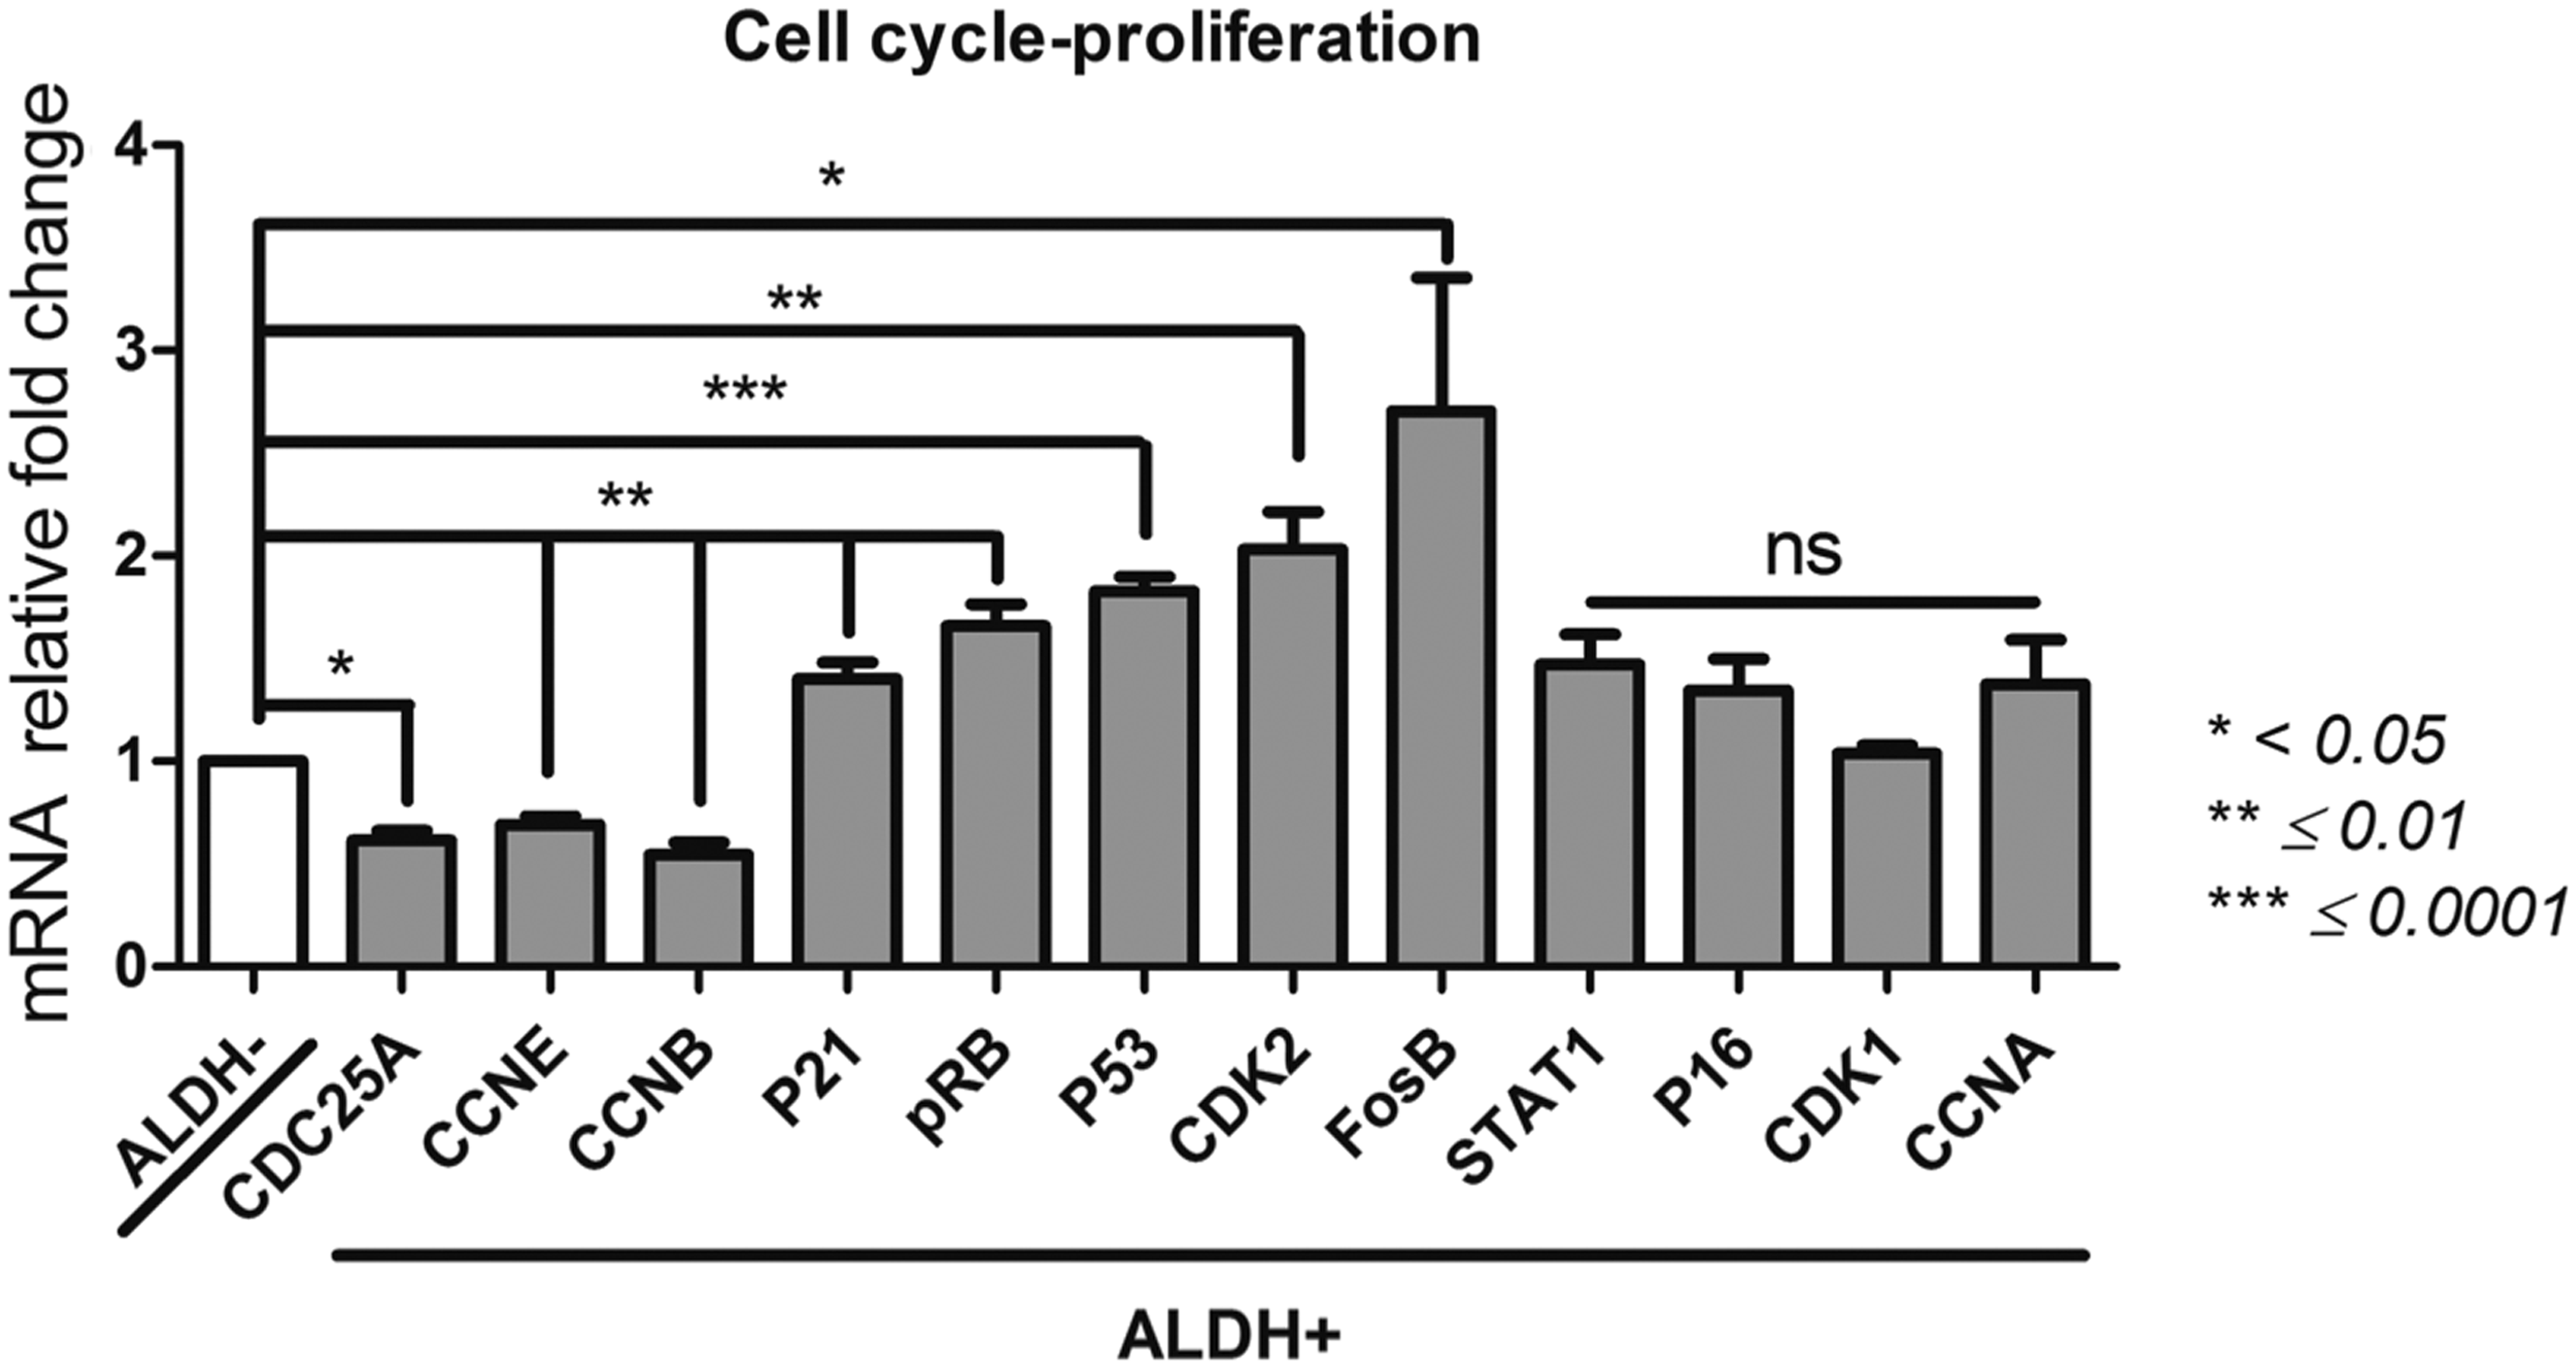
Proliferation and cell cycle profile of ALDH+ and ALDH− BM-MSCs. After sorting ALDH+ and ALDH− BM-MSCs by FACS technique, we evaluated by qPCR their expression of FosB, CDK1, CDK2, Cyclin A, Cyclin B, Cyclin E, p16, p21, p53, pRB, and STAT1 as indication of their proliferation and cell cycle. Data concerning ALDH+ cells are presented as fold change of mRNA gene expression relative to GAPDH expression compared to the ALDH− cells. *p < 0.05, **p ≤ 0.01, and ***p ≤ 0.0001.
Thus, the proliferation/cell cycle gene expression profile significantly differs between ALDH+ and subsets of BM-MSCs and may thus indicate distinct quiescent and proliferative status.
Hypoxia response faculty (Fig. 4)
Hypoxia-inducible factor (HIF)-1α; HIF-2α; solute carrier family 2 member 1 (Glut1)
Interestingly, the ALDH activity selection made possible to isolate an ALDH+ population with a significant high level of Glut1 expression (166,154 ± 9760) compared to ALDH− population (97,788 ± 2867, p = 0.01). Similarly, ALDH+ population showed an increased level of HIF-1α (2866 ± 243) in a significant manner compared to ALDH− (723 ± 10, p = 0.004) subset. HIF-2α level of expression was significantly elevated in the ALDH+ cells (21,143 ± 1788) than in the ALDH− cells (10,501 ± 299, p = 0.0141). The faculty of BM-MSCs to respond to hypoxia based on their gene expression pattern is linked to the ALDH activity as indicated by the differences of relevant gene expression between ALDH+ and ALDH− populations.
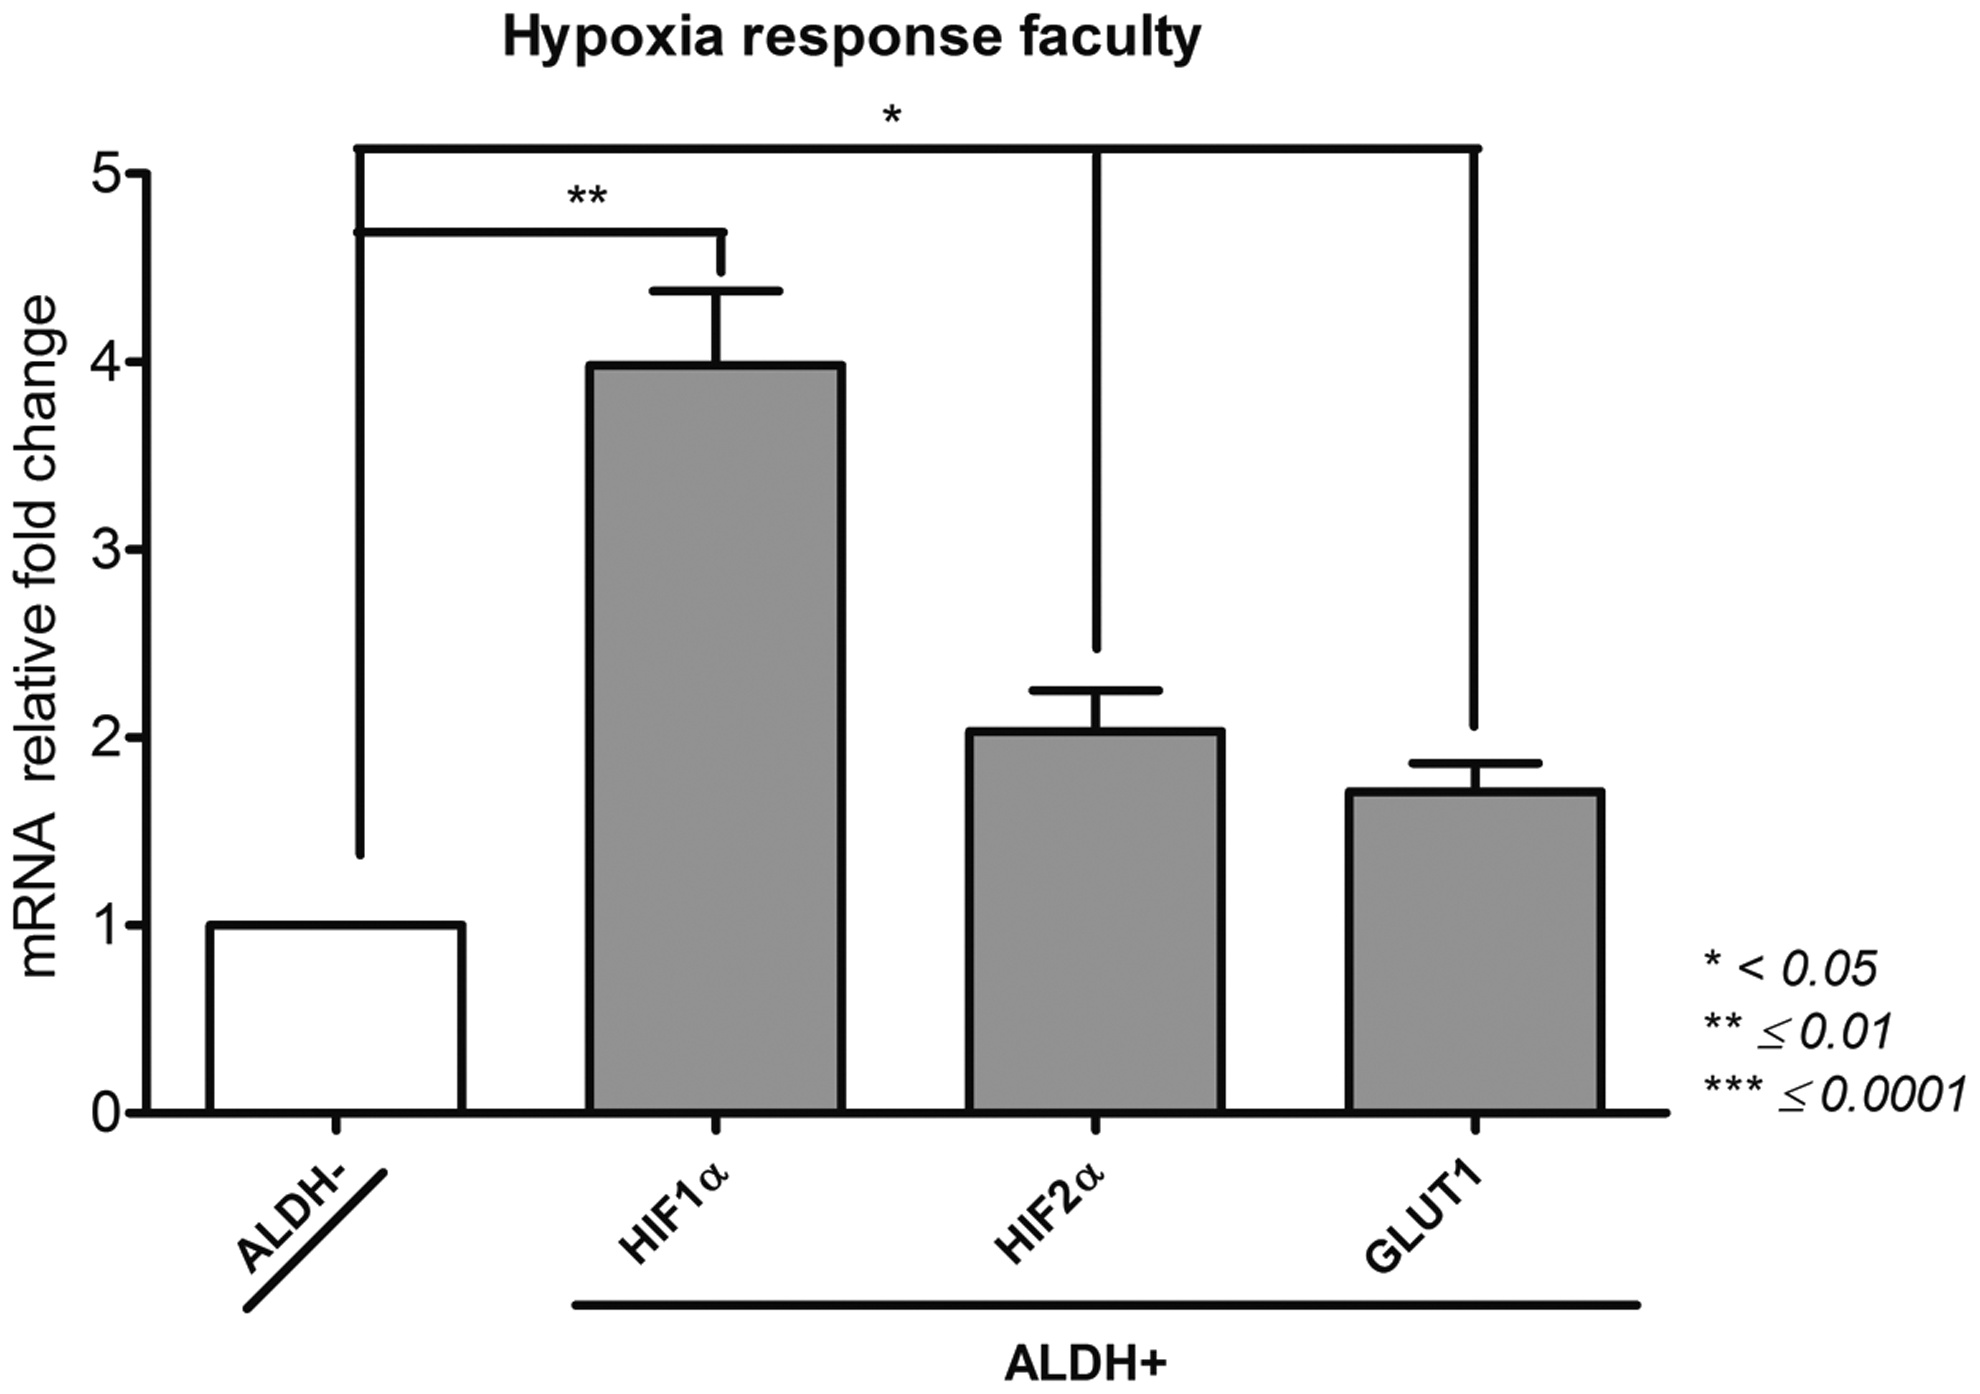
Hypoxia response faculty of ALDH+ and ALDH− BM-MSCs. After sorting ALDH+ and ALDH− BM-MSCs by FACS technique, we investigated by qPCR their expression of HIF-1α, HIF-2α, and Glut1 as proof of their hypoxia response faculty. Data concerning ALDH+ cells are presented as fold change of mRNA gene expression relative to GAPDH expression compared to the ALDH− cells. *p < 0.05, **p ≤ 0.01, and ***p ≤ 0.0001.
Phenotype (Fig. 5)
Melanoma cell adhesion molecule CD146 (MCAM); CD200; vascular cell adhesion molecule 1 CD106 (VCAM-1); intercellular adhesion molecule 1 CD54 (ICAM-1); CD58 (LFA-3)
Interestingly, the ALDH activity selection allows to isolate an ALDH+ population with a significantly high level of CD106 expression (150,621 ± 7404) compared to ALDH− population (51,181 ± 1167, p = 0.0007). Similarly, ALDH+ population expressed a higher level of CD200 (6.54 ± 0.79) in a significant manner compared to ALDH− population (0.44 ± 0.09, p = 0.0057).
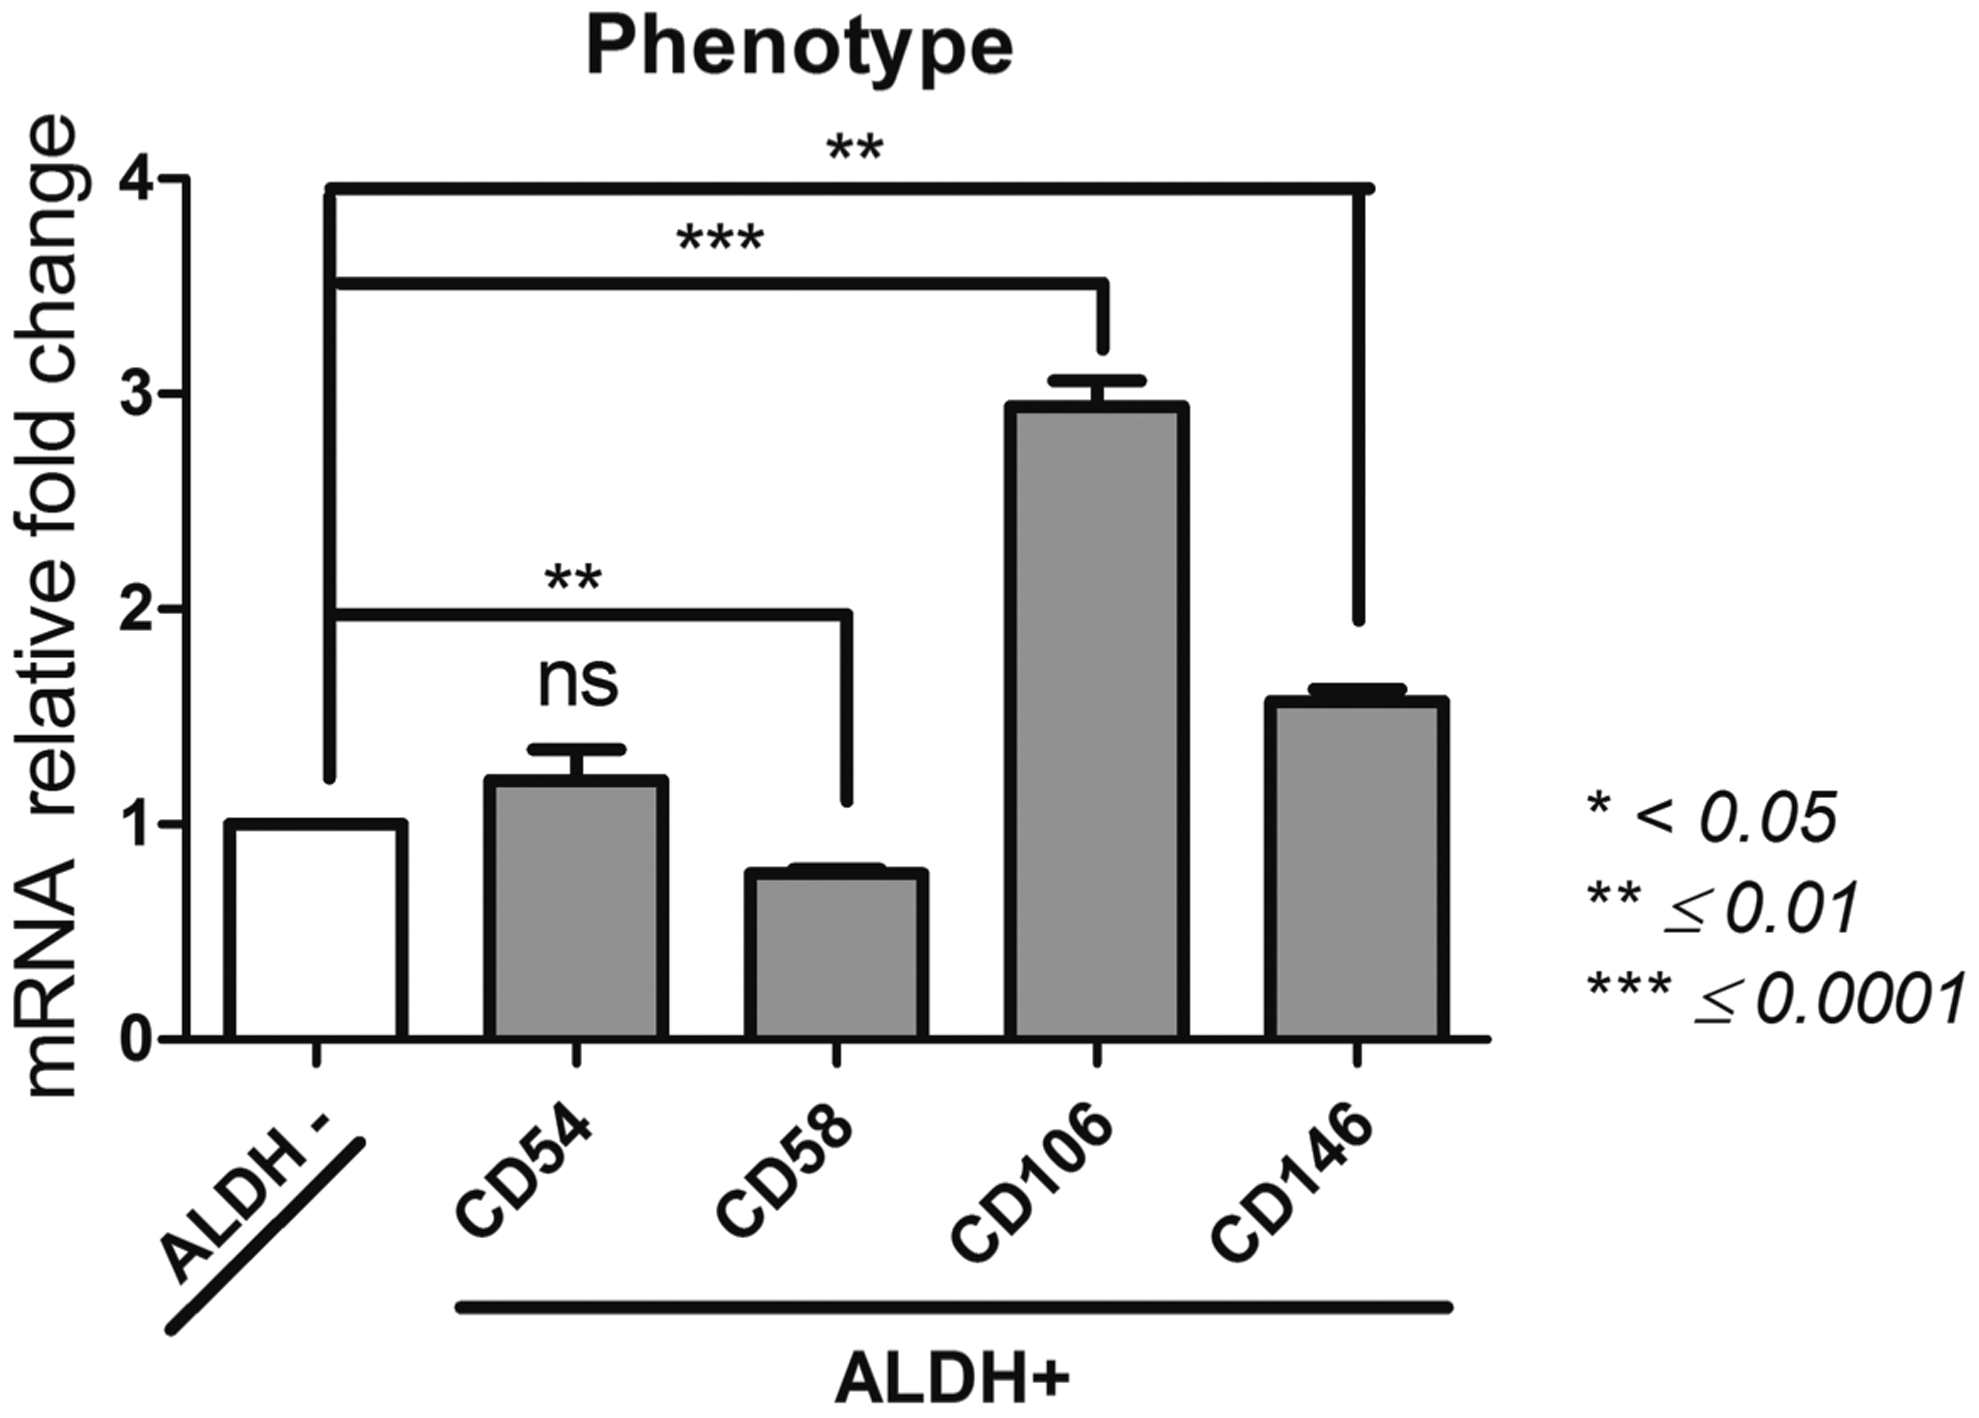
Phenotype of ALDH+ and ALDH− BM-MSCs. After sorting ALDH+ and ALDH− BM-MSCs by FACS technique, we assessed by qPCR their expression of CD146, CD200, CD106, CD54, and CD58 as characterization of their phenotype. Data concerning ALDH+ cells are presented as fold change of mRNA gene expression relative to GAPDH expression compared to the ALDH− cells. *p < 0.05, **p ≤ 0.01, and ***p ≤ 0.0001.
A significant difference between CD146 expression level between the ALDH+ population (1253 ± 40) and the ALDH− population (800 ± 19, p = 0.0018) was noted. No significant change for CD54 expression could be observed between the ALDH+ and ALDH− population (p = 0.2). Concerning CD58, ALDH− population showed a significantly higher expression compared to the ALDH+ population (32,649 ± 995 and 25,086 ± 353, respectively, p = 0.0035). Based on ALDH activity, BM-MSC populations present distinct phenotypes that may have great consequences for their immunological fate.
Angiogenic potential (Fig. 6)
Angiopoietin (ANG)1, ANG2, Fms related tyrosine kinase 1 (FLT1); vascular endothelial growth factor (VEGF)
The levels of expression for ANG1, ANG2, and FLT1 were significantly the highest for the ALDH+ cell population (1742 ± 74, 188 ± 4, 82 ± 3, respectively). The level of VEGF expression was similar between both cell subsets. Based on this gene profiling, the angiogenic potential of both populations of BM-MSCs is clearly different and associated with their ALDH activity.
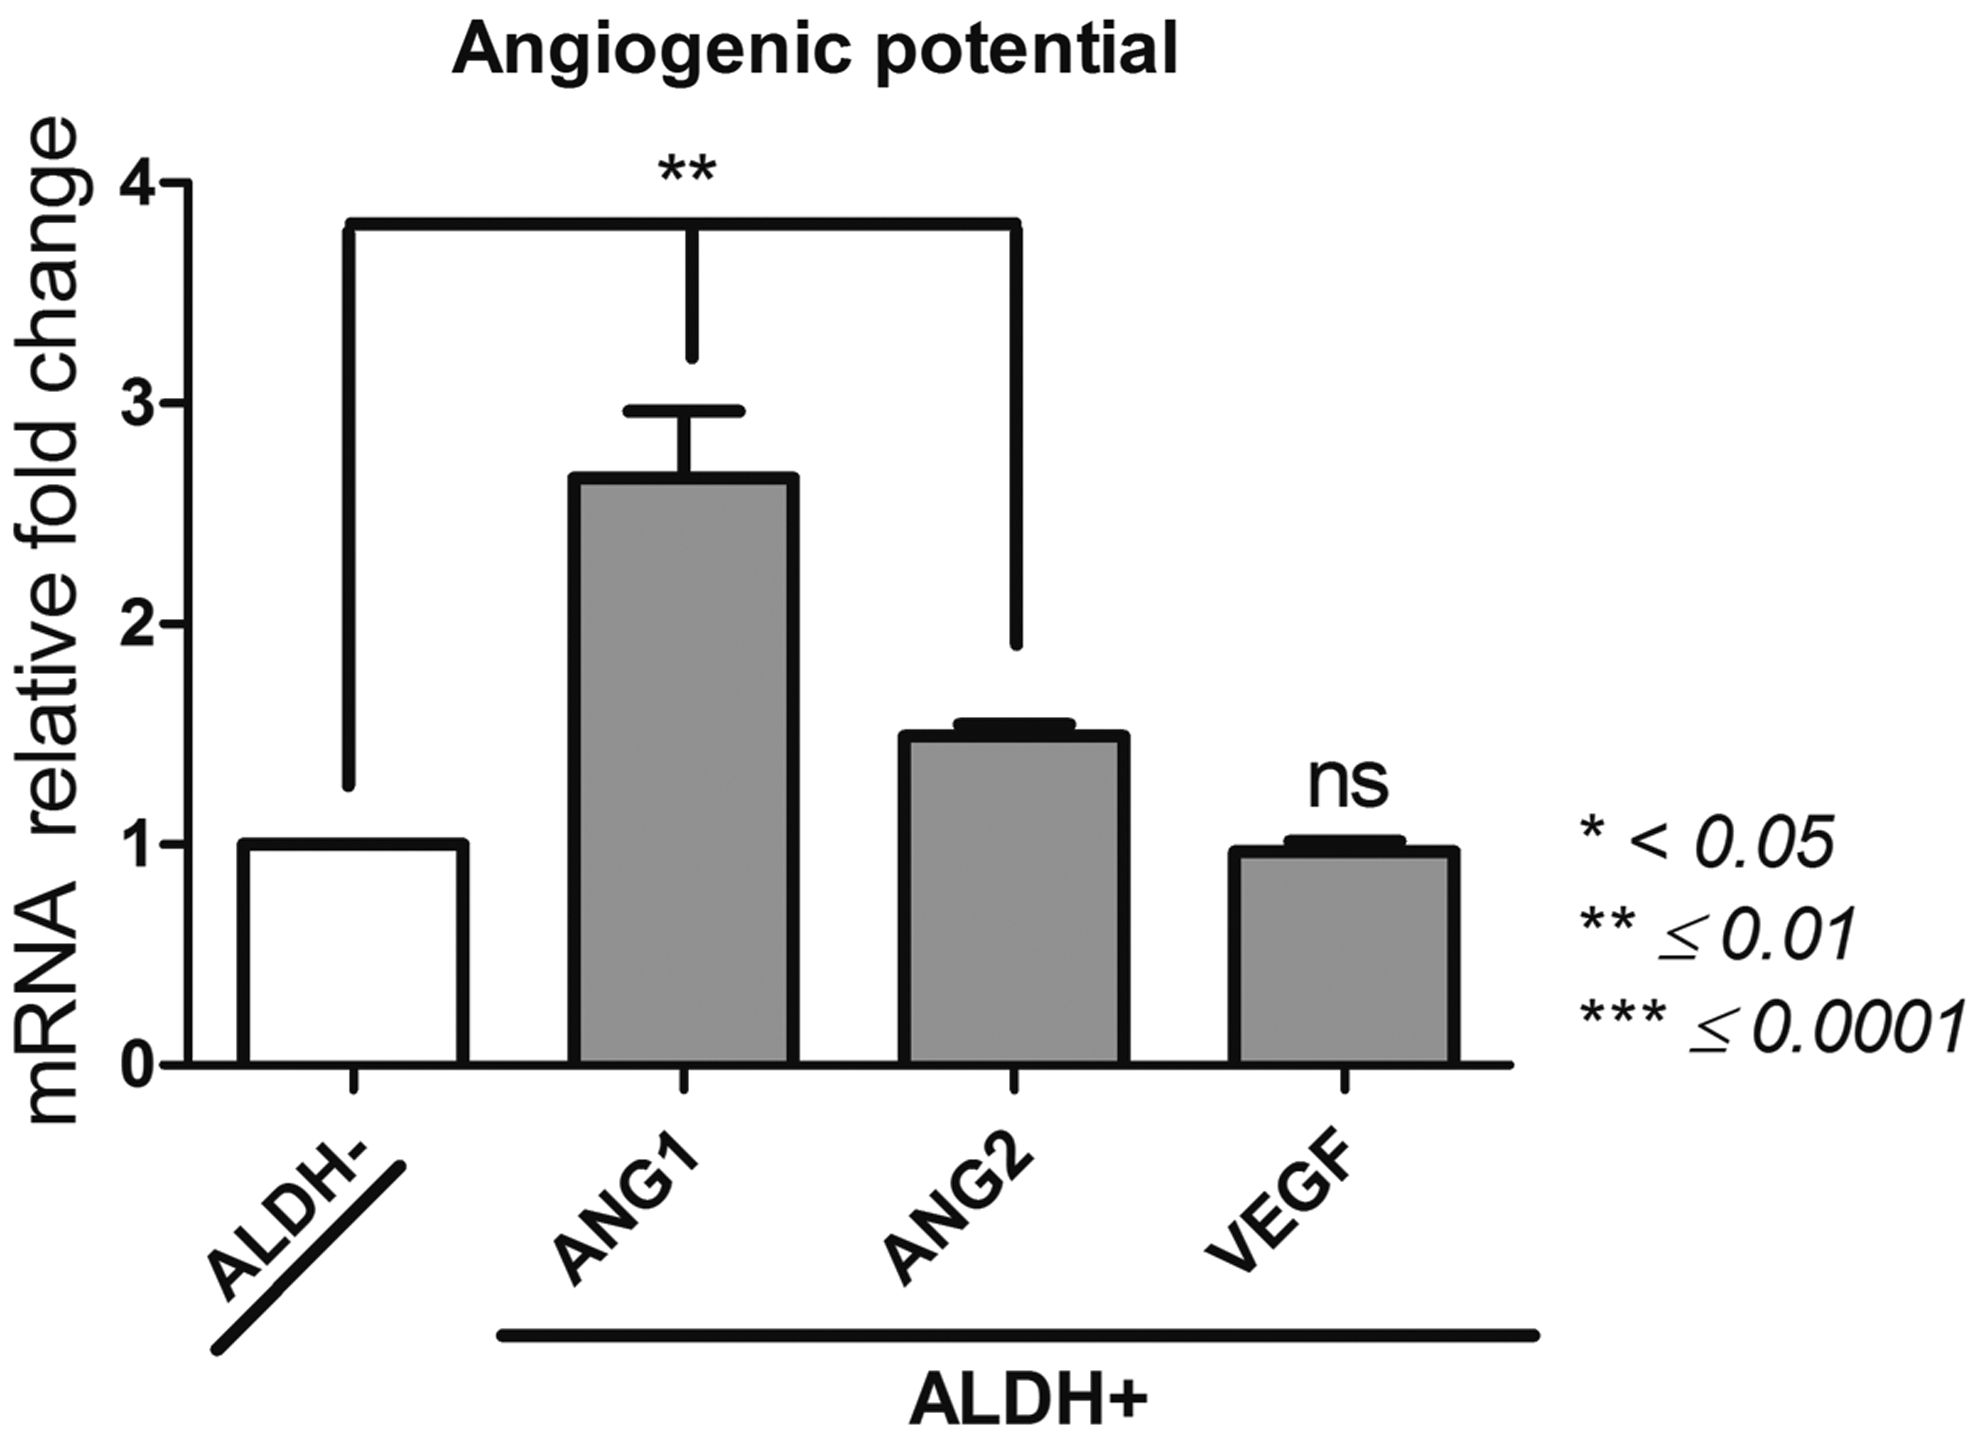
Angiogenic potential of ALDH+ and ALDH− BM-MSCs. After sorting ALDH+ and ALDH− BM-MSCs by FACS technique, we studied by qPCR their expression of ANG1, ANG2, FLT1, and VEGF, as evidence of their angiogenic potential. Data concerning ALDH+ cells are presented as fold change of mRNA gene expression relative to GAPDH expression compared to the ALDH− cells. *p < 0.05, **p ≤ 0.01, and ***p ≤ 0.0001.
Hematopoietic supporting capacity (Fig. 7)
Matrix metalloproteinase 2 (MMP2); stromal derived factor 1 (SDF1); Kit ligand (SCF); interleukin-6 (IL-6); IL-8
The selection of the ALDH+ and ALDH− populations made possible to isolate cell populations displaying different levels of MMP2 with a greater gene expression for the ALDH+ subset. The levels of MMP2 was 1.5 ± 0.1 × 10⁶ for ALDH+ cells versus 1.2 ± 0.06 × 10⁶ for ALDH− subset (p = 0.0109). Nevertheless, concerning IL-6 gene expression, the ALDH+ population showed the lowest rate (40,399 ± 996) versus 53,441 ± 1209 for the ALDH− population (p = 0.0016). In contrast, the levels of IL-8, SCF, and SDF1 were similar between ALDH+ and ALDH− populations. Significant differences within the hematopoietic supporting capacity of BM-MSCs are noted and look to be dependent on ALDH activity.
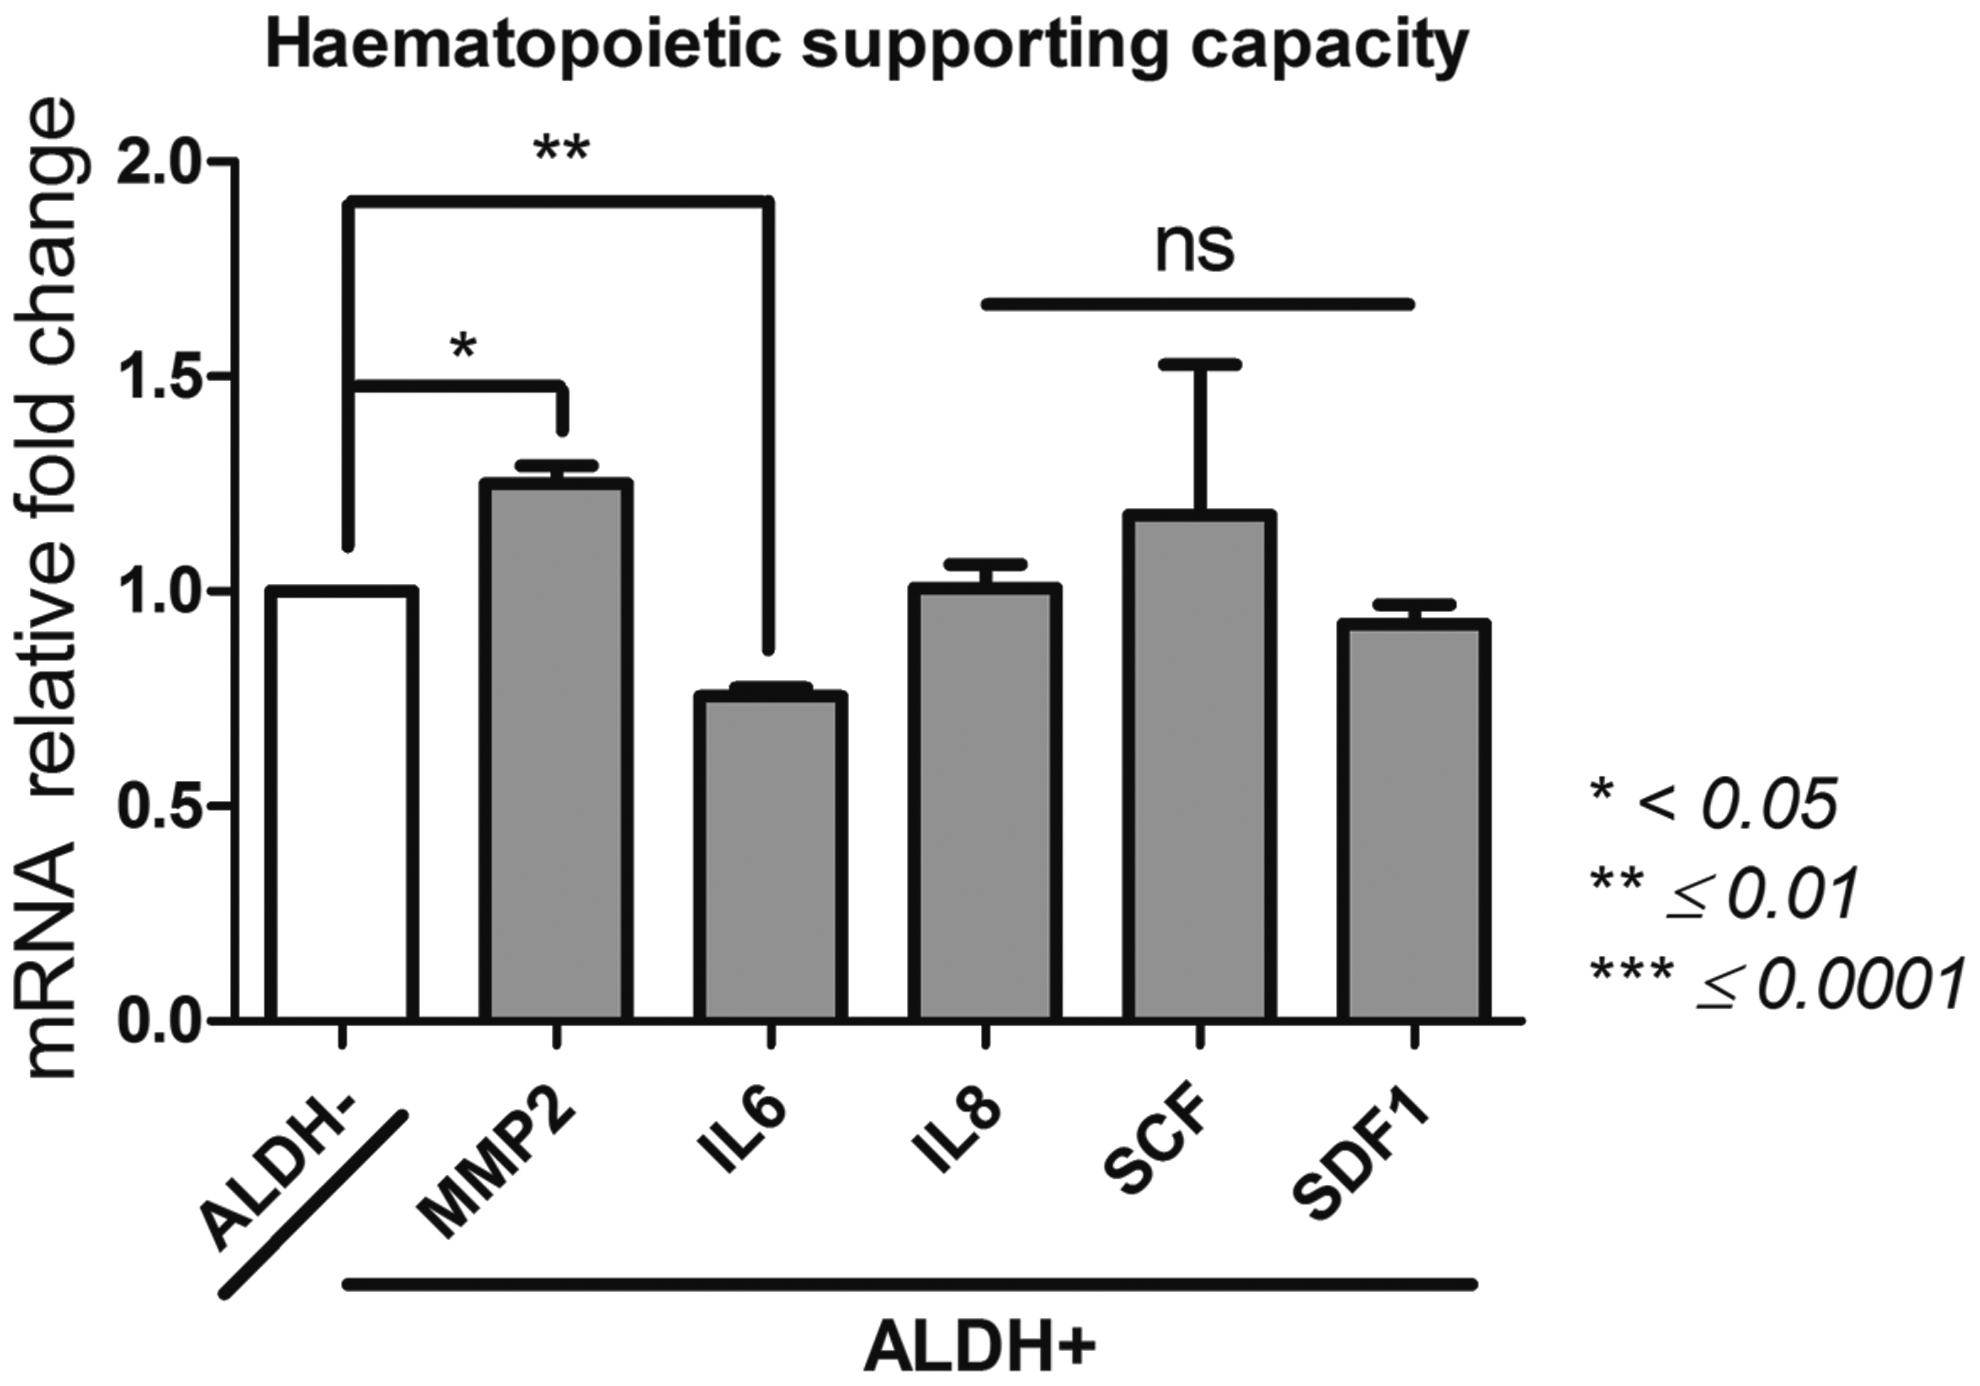
Hematopoietic supporting capacity of ALDH+ and ALDH− BM-MSCs. After sorting ALDH+ and ALDH− BM-MSCs by FACS technique, we analyzed by qPCR their expression of MMP2, SDF1, SCF, IL-6, and IL-8 as illustration of their hematopoietic supporting capacity. Data concerning ALDH+ cells are presented as fold change of mRNA gene expression relative to GAPDH expression compared to the ALDH− cells. *p < 0.05, **p ≤ 0.01, and ***p ≤ 0.0001.
Immunomodulatory ability (Fig. 8)
Galectin1 (GAL1); hepatocyte growth factor (HGF); leukemia inhibitory factor (LIF); cytochrome c oxidase subunit 1 (COX1), COX2
The ALDH+ population significantly showed the highest gene expression for COX2 (27,272 ± 793), COX1 (553 ± 55), LIF (22,332 ± 2226), and HGF (2715 ± 231) genes compared to the ALDH− population (COX2: 24,341 ± 569, p = 0.001; COX1: 420 ± 30, p = 0.0356; LIF: 15,892 ± 746, p = 0.0456; and HGF: 679 ± 64, p = 0.026). The GAL1 gene expression was also higher for the ALDH+ population (1.82 ± 0.09 × 10⁶) compared with the ALDH− population (8.14 ± 0.6 × 10⁵, p = 0.025). With the highest expression of immunoregulatory genes, ALDH+ population of BM-MSCs might display potent immunomodulatory ability.
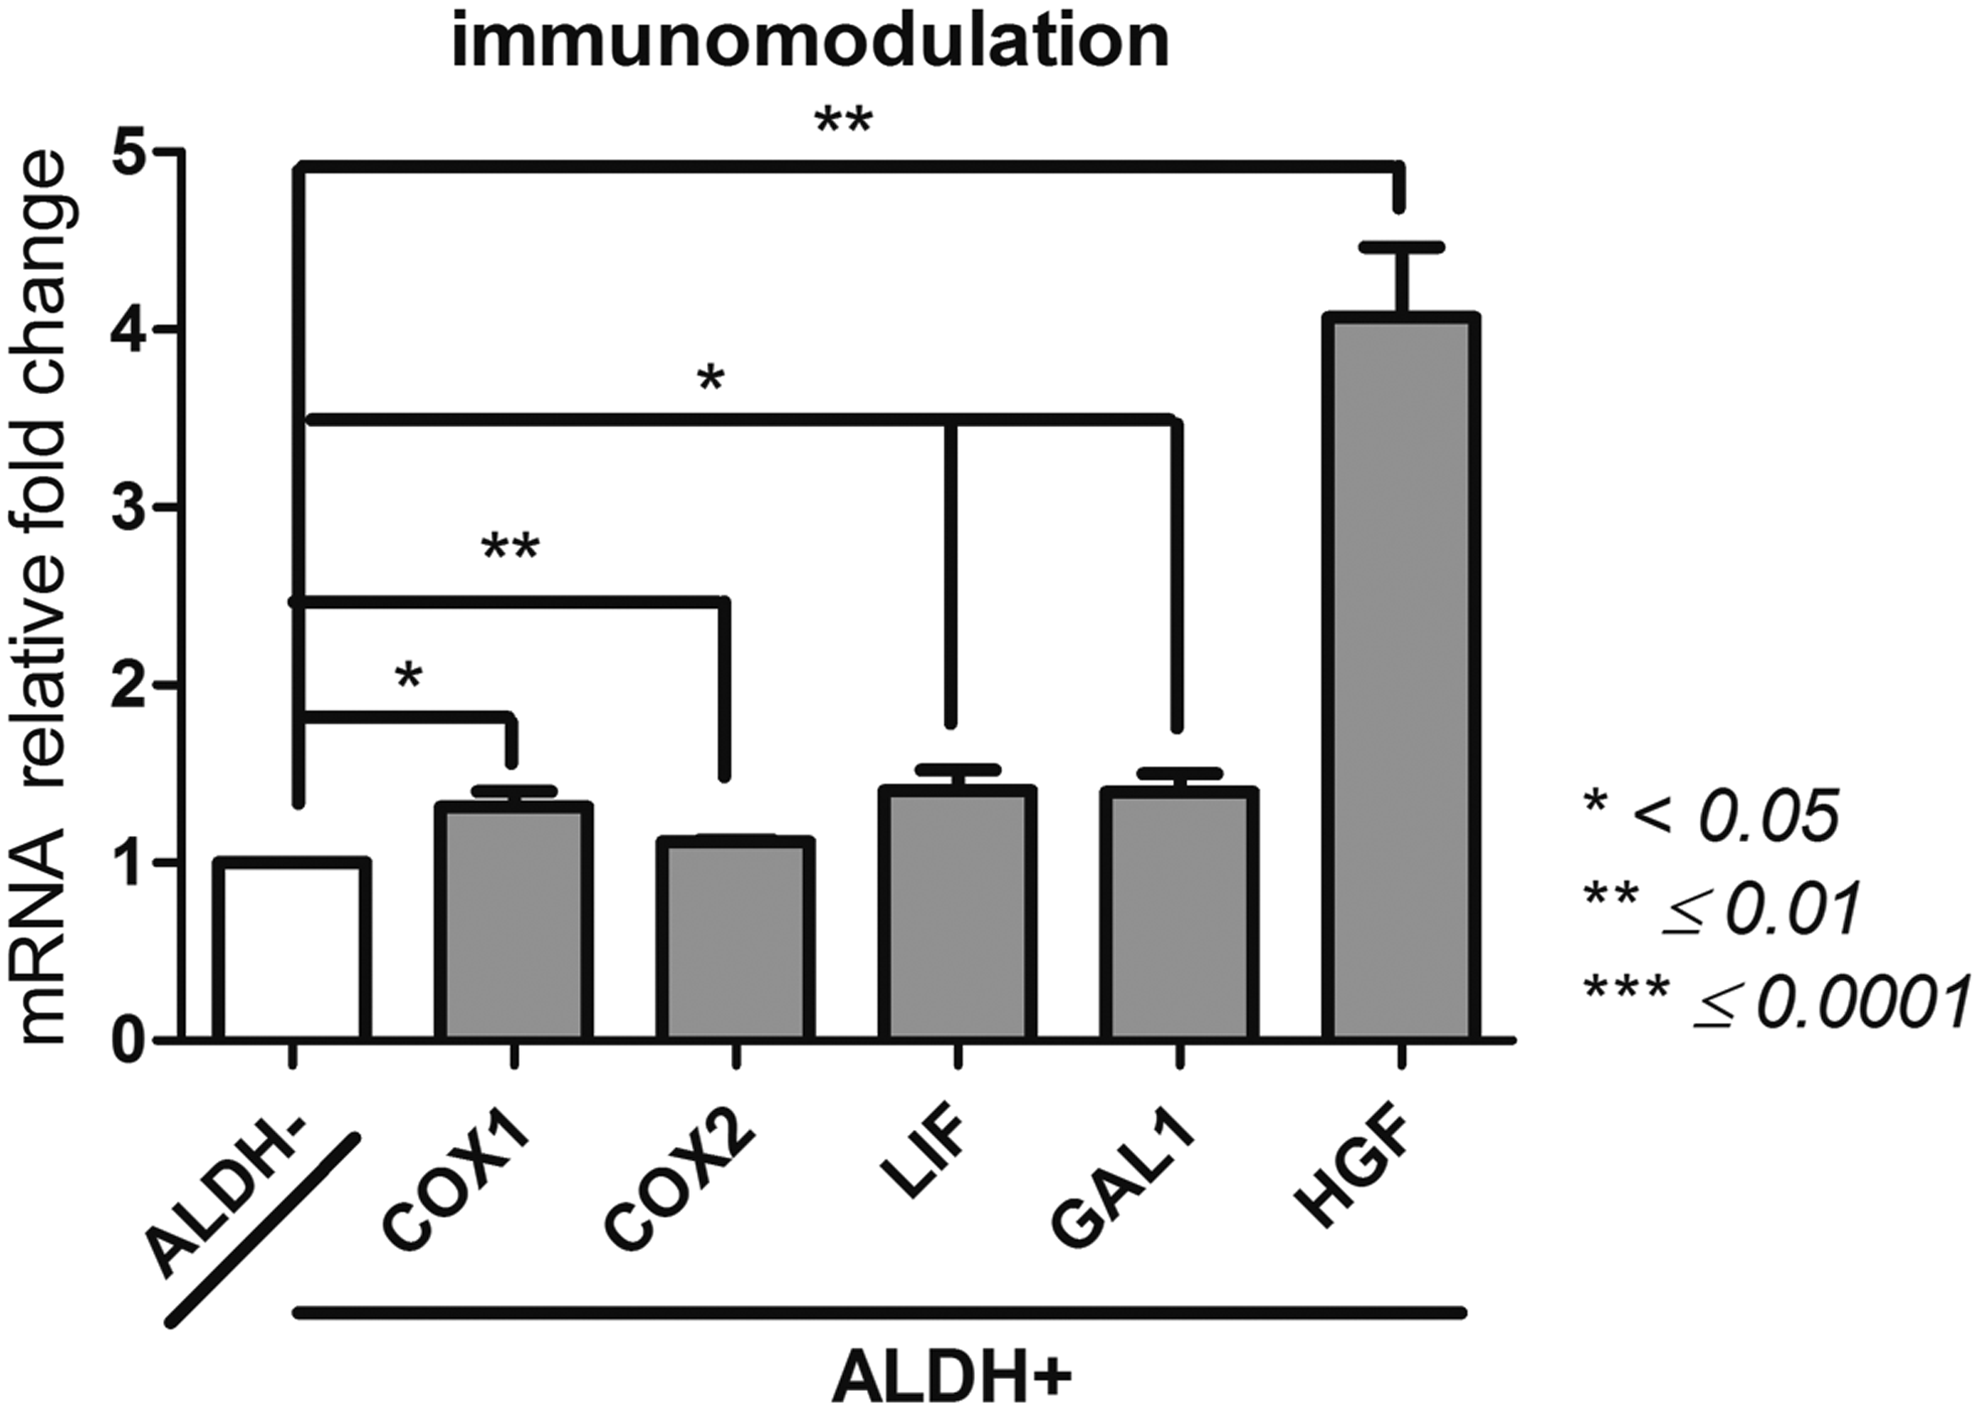
Immunomodulatory ability of ALDH+ and ALDH− BM-MSCs. After sorting ALDH+ and ALDH− BM-MSCs by FACS technique, we examined by qPCR their expression of GAL1, HGF, LIF, COX1, and COX2 as demonstration of their immunomodulatory ability. Data concerning ALDH+ cells are presented as fold change of mRNA gene expression relative to GAPDH expression compared to the ALDH− cells. *p < 0.05, **p ≤ 0.01, and ***p ≤ 0.0001.
Multilineage competence (Fig. 9)
Osteogenesis potential: Runt related transcription factor 2 (Runx2); Osterix (OSX); integrin binding sialoprotein (BSP); TNF receptor superfamily member 11 (OPG); secreted phosphoprotein type 1 (OPN)
The expression of BSP in ALDH+ and ALDH− populations was not significantly different (p = 0.05). ALDH+ and ALDH− cells showed significantly different expression of Runx2 (40,485 ± 545 and 32,962 ± 477, respectively, p = 0.0004). Concerning OSX expression, the lowest expression was seen in the ALDH+ population (76.06 ± 2.65) in comparison to the ALDH− population (277.6 ± 10.6, p = 0.0004). For OPG and OPN expressions, ALDH+ population showed a lower expression than its negative counterpart (p = 0.0209 and p = 0.0193, respectively). In relation with these differences, the potential of differentiation toward the osteogenic lineages seems not equal, and ALDH− cells present a more differentiated state than ALDH+ cells.
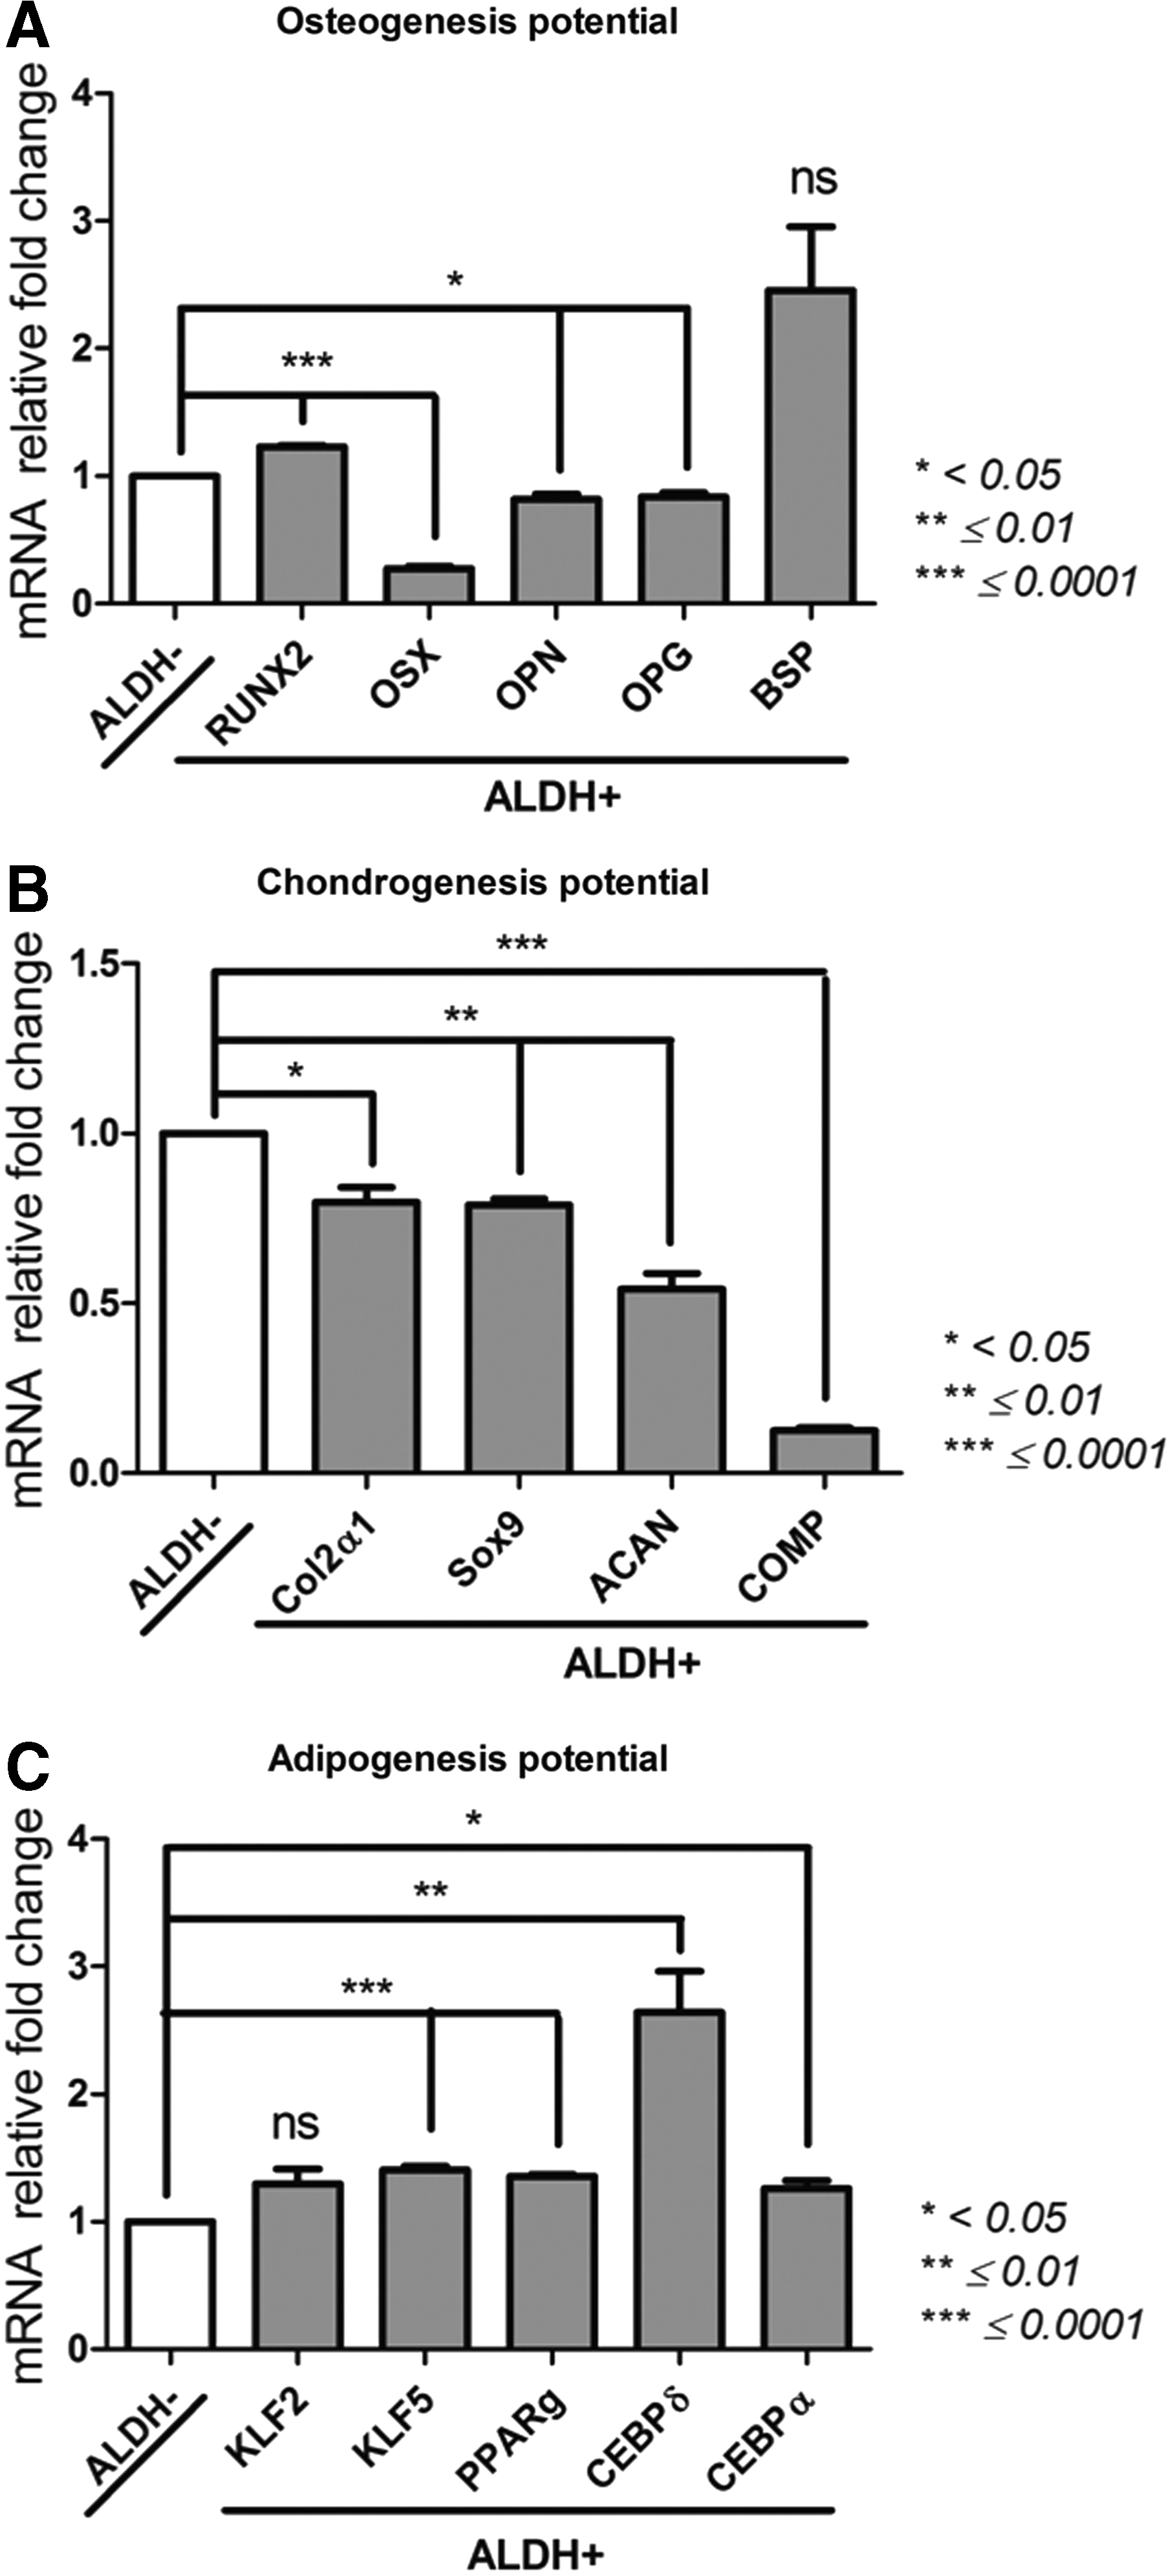
Osteogenic competence of ALDH+ and ALDH− BM-MSCs
Chondrogenesis potential
SRY box 9 (Sox9); collagen type II alpha 1 chain (Col2a1); aggrecan (ACAN); cartilage oligomeric matrix protein (COMP)
ALDH+ population showed a significant lower COMP expression (7453 ± 296) compared with the ALDH+ population (59,653 ± 1671, p < 0.0001). Col2A1 gene expression was also lower in ALDH+ cells than in their negative counterpart (1053 ± 42 vs. 1337 ± 102, p = 0.0357). Sox9 gene expression was also lower in ALDH+ cell population (11,513 ± 248) than in the ALDH− subset (14,610 ± 471, p = 0.0007). ALDH+ population also displayed the lowest ACAN gene expression (27,968 ± 1353) compared to its positive counterpart (52,307 ± 3578, p = 0.0073). The chondrogenic gene expression of BM-MSC populations varies in a way depending on their ALDH activity suggesting that ALDH+ cells represent more undifferentiated cells than ALDH− fraction.
Adipogenesis potential
CCAAT/enhancer binding protein alpha (C/EBP-α), C/EBP-δ; peroxisome proliferator activated receptor gamma (PPAR-γ); Kruppel-like factor (KLF2); KLF5; adiponectin (ADIPOQ)
All the genes related to adipogenesis were expressed at the highest level for the ALDH+ population, except for the KLF2 and ADIPOQ gene expressions which were not significantly different. In this case, the adipogenic genes are most expressed in ALDH+ cells.
Discussion
MSCs as therapeutic cells display different properties that make them tremendous candidate for several clinical applications.18,19 In this work, we chose the term “stromal cells” according to the recommendations of the ISCT. Regarding their nomenclature, 20 they proposed that any fibroblast-like plastic-adherent cells, independent of their tissue of origin, should be called mesenchymal stromal cells instead of mesenchymal stem cells (keeping the acronym “MSCs”). Several reasons indicate that using the term “mesenchymal stem cells” is inappropriate and are likely arising from inaccuracy in terminology and analytic procedures. 21 Such a term has to be restrained to a cell population that demonstrates stem cell activity according to specific criteria. 22
MSCs are considered a mixture of heterogeneous cells as they are usually obtained from unfractionated tissue preparation. In the field of regenerative medicine, it is important to have a well-defined cell product particularly in terms of identity and competences. Due to their low tissue frequency and the absence of a reliable isolating marker, the specific identification of MSCs is still limited. Indeed, the presence of CD73, CD105, and CD90 in parallel to the lack of CD34, CD31, and CD45, as classically described, is variable according to the technics and methods used for cell culture and therefore not sufficient for identifying native MSCs. 23
Over time, several markers have been reported to enrich MSCs, but they are not specifically able to identify and isolate a homogenous population of MSCs.24,25 BM-MSCs in culture were sorted based on ALDH activity, and thus, two populations with significantly different activity were observed and thus isolated (designed as ALDH+ and ALDH−). Furthermore, these two populations presented distinct transcriptomic profiles related to the main properties of MSCs (proliferation, response to hypoxia, angiogenesis, phenotype, stemness, multilineage, hematopoiesis, and immunomodulation).
Concerning the choice of studied genes, we have opted for those that are differentially expressed by MSCs and relevant for their therapeutic properties. The analysis of the genes related to the stemness property26–28 shows that the ALDH+ population is more likely to express stem cell features than the ALDH− population. Although the Nanog expression was similar, a higher expression of Oct4 and Rex1 expression point in the direction of the stemness maintenance in ALDH+ fraction. This hypothesis is also reinforced by the cell cycle gene expression.
It has been previously demonstrated that ALDH+ may distinguish more primitive stem cells with slow-dividing properties than the ALDH− subset. 29 A high expression of p53, with a low expression of CCNB, indicates that the ALDH+ population of cells seems to be in a quiescent state. 30 P53 controls the proliferation, self-renewal, and differentiation of stem cells and its absence promotes a higher proliferation rate of BM-MSCs. 31 pRB is also more expressed in ALDH+ cells and was also reported to be induced in quiescent cells. 32 Interestingly, ALDH inhibits cell proliferation and improves the clonogenicity. 33
Recently, ALDH was reported to influence stem cell response to hypoxia 34 ; therefore, we studied a possible relationship between ALDH and hypoxia signaling35,36 in BM-MSCs. In breast cancer cells with high ALDH activity, an important hypoxic response following HIF1A induction was described. 37 In our study, ALDH+ cell population displayed also a high HIF1A expression, together with a high Glut1 expression. The use of MSCs in reparative medicine often implies their function in the presence of a high oxidative context. In a comparative study, maternal decidua basalis MSCs rather than chorionic villous MSCs present elevated ALDH activity and could be more efficient for tissue regeneration. Indeed, MSCs from pregnancy sites which are exposed to increased oxidative stress will thus have high ALDH activity. 38 In response to hypoxia, MSCs in culture are able to secrete angiogenic factors, such as basic fibroblast growth factor, VEGF, transforming growth factor-β, platelet-derived growth factor, angiopoietin-1, placental growth factor, IL-6, and monocyte chemotactic protein-1, in addition to the ability to produce components of the extracellular matrix, which serves as a substrate for endothelial cells. 39
Regarding the angiogenic potential of MSCs, 40 FLT1, ANG1, and ANG2 were differently expressed depending on ALDH activity. The expression level for ANG1, ANG2, and FLT1 (VEGF receptor) was significantly higher in the ALDH+ cells. In contrast, VEGF level was similar whatever the ALDH activity of cells. MSCs may differentiate into various cell types and promote angiogenesis by modulating the microenvironment. 29 MSCs seem to express molecules and their corresponding receptor or antagonist to sense their environment and modulate their secretions accordingly.
Nearly all admitted cellular responses to VEGF are signaling through VEGFR-2 (KDR/Flk-1), but the exact role of FLT1 (VEGFR-1) in angiogenesis remains elusive. By sequestering VEGF, FLT1 may also prevent VEGFR-2 signaling. In contrast, angiopoietins are a family of vascular growth factors that play critical roles in angiogenesis. ANG2 functions as a competitive ANG1 antagonist in a context-dependent manner. 41 Numerous clinical trials have proved the therapeutic efficiency of MSCs in patients with vascular diseases by regulating their local angiogenesis. Recently, Sherman et al. reported that BM-MSCs with enhanced ALDH activity display potent pro-angiogenic secretory activities although the mRNA expression patterns using Affymetrix arrays were strikingly similar. 42
BM-MSCs may exhibit an array of immunological markers, 43 which determines their fate and function during immune responses. 44 The expression profile of CD146, CD106, CD54, and CD58 important for cell–cell interactions was thus established. Interestingly, the ALDH activity selection made possible to isolate ALDH+ population with a significantly high level of CD106 expression. Endothelial cells, as well as stromal cells, have shown expression of CD106. Among different types of MSCs, CD106 is highly found within placental chorionic villi (CV), modestly on BM-MSCs, slightly on umbilical cord (UC)-MSCs, and not detected in adipose (AD)-MSCs.
Data have demonstrated that CD106 characterizes a subset of CV-MSCs with distinctive immune-associated gene expression and immunomodulation, 45 as well as potent pro-angiogenic activity. 46 However, through the NF-κB pathway, high cellular density induces CD106 expression reducing thus migration of BM-MSCs. 47 Thanks to N-cadherin, cell–cell adhesion increases CD106 expression in MSCs through platelet-derived growth factor receptor beta (PDGFRβ) and the activation of Src regardless of their ligand. 48
CD146 also termed MCAM (MelCAM) was previously referenced as an endothelial marker involved in cell–matrix interactions and angiogenesis. In this study, we observed that ALDH+ population had a significant higher expression of CD146 than ALDH− population. The significant expression of CD146 within MSCs may be associated with increased capacity for bone formation 49 and greater vascular smooth muscle commitment 50 and, thus, indicate a valuable therapeutic cell product for bone or muscle tissue engineering. CD146+ MSCs also exhibited greater chondrogenic and immunosuppressive capacities suggesting their use in treating inflammatory arthritis. 51
Although no variation was observed for CD54 expression, ALDH+ cells express lower levels of CD58 than their negative counterpart. Upregulated CD54 and CD58 surface expression on MSCs has been previously reported to be important for immunomodulation. The signal leading to IL-10 secretion is mainly delivered following CD2 and CD58 interactions rather than CD11a and CD54 one. 52
The CD200 molecule was described to be critically involved in the regulation of the immune response 44 and bone homeostasis 53 mediated by MSCs. Both pro-osteogenic and -inflammatory cytokines are able to promote the expression of CD200 in cultured BM-MSCs. 54 ALDH+ population expressed significantly higher level of CD200. The immunological profile of ALDH+ population seems to be more compliant with the status of MSCs as immunotherapeutic cells.
By generating most of the stromal cells within the hematopoietic stem cell (HSC) niche, and by producing pro-hematopoietic factors, MSCs play a crucial role in the hematopoietic system physiology and homeostasis. 55 In this respect, hematopoietic factors such as IL-6, IL-8, SDF1, SCF, and MMP2 were demonstrated to participate in MSC hematopoiesis supporting capacity. 56 ALDH+ populations presented high MMP2 and SCF, comparable to SDF1 and IL-8, and low IL-6 gene expression in comparison to ALDH− population. Interestingly, high levels of IL-6 moderately participate to MSC supporting hematopoiesis. 56 The measure of ALDH activity was suggested as a quality device in the HSC transplantations. 57
ALDH+ population shows increased expression of pro-hematopoietic factors indicating a greater pro-hematopoietic supporting capacity, and as proposed for BM-MSCs, they could be useful for ex vivo HSC expansion, as well as an adjuvant cellular therapy during HSC transplantation to promote both hematological engraftment and recovery. 58
As functional immunomodulatory cells, MSCs modulate immune, as well as inflammatory responses, by a network of competing regulatory pathways. 59 In particular, distinct mechanisms of immunomodulation are exhibited by MSCs with HGF, GAL1, LIF, and prostaglandin E2 (through COX1 and COX2) showing different expression and functional profiles. 59 This pattern of regulatory factors showed the highest significant gene expression within the ALDH+ population suggesting that they may have superior immunomodulatory capacities and may be more suitable for immunotherapy indications.
Furthermore, due to their multilineage potential, MSCs are valuable therapeutic cellular products in the field of regenerative medicine. 60 Their capacities to differentiate into osteogenic, adipogenic, and chondrogenic lineages are the most studied. Thus, this trilineage differentiation ability of ALDH+/− populations from MSCs was evaluated by evaluating the constitutive expression of multiple genes related to the osteogenic, adipogenic, and chondrogenic lineages.61–63
For osteogenesis, the expression profile of Runx2, BSP, OPN, OSX, and OPG related markers varied considerably among both populations of MSCs. ALDH+ population demonstrated increased expression of late osteoblastic markers OPN, OSX, and OPG suggesting that these cells are less committed than the ALDH− fraction. ALDH+ cells have higher Runx2 expression, a key transcription factor essential for osteoblastic differentiation.
Regarding adipogenesis, 64 the adipogenic markers such as adiponectin, C/EBP-α, C/EBP-δ, PPAR-γ, and KLF5 were significantly more expressed in ALDH+ population of MSCs. The molecular regulation of adipogenesis is well balanced and controlled. 65 The PPAR-γ, as well as C/EBPα-δ, is considered as the early positive regulators of adipogenesis, while adiponectin participates among other factors to the formation of mature adipocytes. In addition, KLF5 positively controls adipocyte differentiation by enhancing PPAR-γ and C/EBP expressions. These data demonstrate that ALDH+ cells express transcription factors implicated in the early differentiation of bone and AD tissue. As common progenitor of both cell types, MSCs through distinct signaling pathways are finely cross-regulated for these lineage commitments. 64
We observed differences not only in expression of early and late osteogenic and adipogenic genes but also in chondrogenic gene expression. Indeed, the expression of Sox9, Col2a1, ACAN, and COMP chondrogenic genes was decreased within the ALDH+ population confirming their undifferentiated status. Altogether, our findings suggest that MSCs display a multipotency capability depending on their ALDH expression profile, and ALDH+ cell fraction is enriched for molecular markers of early differentiation and seems less committed than the negative counterpart.
The study of Kusuma et al. has associated an increased expression of ALDH in MSCs from the maternal decidua basalis (DMSC) with their high exposition to oxidative stress. They suggest that DMSC should be ideal cell population for tissue engineering as they therapeutically operate in high oxidative stress environment. 38 Furthermore, reestablishing ALDH activity in injured MSCs using agonists of the enzymes may represent a suitable strategy to enhance the resistance of MSCs and therefore their therapeutic value toward cytotoxic damage. 66 In parallel, MSCs derived from UC blood showed that a subset of cells with a high ALDH activity is more effective for bone repair within a short period of time. 40 For Sherman et al., using ALDH as a functional progenitor cell marker, high ALDH activity identifies a pro-angiogenic MSC subset. 42
In summary, our data highlight an effective and consistent procedure for isolating a high ALDH and low ALDH enzymatic activity subpopulations of BM-MSCs. These populations presented distinct gene expression profiles related to the main properties of MSCs. However, further investigation is necessary to completely understand the functional properties of these distinct ALDH populations of MSCs to achieve the desired therapeutic effect.
Footnotes
Acknowledgment
M.N. is an awardee of a “Télévie”postdoctoral fellowship.
Disclosure statement
No competing financial interests exist.
References
Supplementary Material
Please find the following supplemental material available below.
For Open Access articles published under a Creative Commons License, all supplemental material carries the same license as the article it is associated with.
For non-Open Access articles published, all supplemental material carries a non-exclusive license, and permission requests for re-use of supplemental material or any part of supplemental material shall be sent directly to the copyright owner as specified in the copyright notice associated with the article.