
Abstract
Most histological evaluations of critical-sized bone defects are limited to the analysis of a few regions of interest at a time. Manual and semiautomated histomorphometric approaches often have intra- and interobserver subjectivity, as well as variability in image analysis methods. Moreover, the production of large image data sets makes histological assessment and histomorphometric analysis labor intensive and time consuming. Herein, we tested and compared two image segmentation methods: thresholding (automated) and region-based (manual) modes, for quantifying complete image sets across entire critical-sized bone defects, using the widely used Osteomeasure system and the freely downloadable Aperio Image Scope software. A comparison of bone histomorphometric data showed strong agreement between the automated segmentation mode of the Osteomeasure software with the manual segmentation mode of Aperio Image Scope analysis (bone formation R2 = 0.9615 and fibrous tissue formation R2 = 0.8734). These results indicate that Aperio is capable of handling large histological images, with excellent speed performance in producing highly consistent histomorphometric evaluations compared with the Osteomeasure image analysis system. The statistical evaluation of these two major bone parameters demonstrated that Aperio Image Scope is as capable as Osteomeasure. This study developed a protocol to improve the quality of results and reduce analysis time, while also promoting the standardization of image analysis protocols for the histomorphometric analysis of critical-sized bone defect samples.
Impact Statement
Despite bone tissue engineering innovations increasing over the last decade, histomorphometric analysis of large bone defects used to study such approaches continues to pose a challenge for pathological assessment. This is due to the resulting large image data set, and the lack of a gold standard image analysis protocol to quantify histological outcomes. Herein, we present a standardized protocol for the image analysis of critical-sized bone defect samples stained with Goldner's Trichrome using the Osteomeasure and Aperio Image Scope image analysis systems. The results were critically examined to determine their reproducibility and accuracy for analyzing large bone defects.
Introduction
The reconstitution of critical-sized bone defects through tissue engineering approaches has received considerable scientific, economic, and clinical interest over the past years 1 with the use of animal models and histological assessment, making it possible to investigate the pathways that regulate bone healing. 2 Despite multiple tissue engineering innovations over the last decade, histomorphometric analysis of large bone defects continues to pose a challenge for pathological assessment due to the resulting large image data set, and the lack of a gold standard histomorphometric image analysis software system and approach/protocol to quantify critical-sized bone defect histological outcomes.
For the last 50 years, qualitative assessment of histological sections has been the gold standard approach for evaluating bone responses to bone therapies.3,4 Most histological interpretations of critical-sized bone defects are made according to the presence or absence of staining.5,6 Qualitative quantification also has been used to interpret histological outcomes. Usually graded according to staining intensity, such quantifications can be categorized as weak (+), medium (++), and strong (+++). 7 When numbers are used instead of qualitative signs, these histological evaluations are termed semiquantitative estimations and are widely used for assessment of immunohistochemical (IHC) stains as well as biological response evaluations to medical devices.4,7–16
In their 2014 review, Fedchenko and Reifenrath 7 described the use of different approaches for the interpretation and reporting of IHC results in bone tissue studies. After extensive research, they were able to identify six predominant methodologies, including: (1) description of morphological parameters; (2) counting of positively stained cells; (3) calculating positive percentages of stained cells in relation to the total area evaluated; (4) qualitative scoring related to staining intensity; (5) combinative semiquantitative scoring; and (6) automated systems. However, a standardized system has not yet been agreed on for the quantitative evaluation of staining results.
Over the last decades, the extraction of numerical data from histological images of bone defect samples has gained significant attention with the introduction of whole slide imaging scanners and the integration of statistical methods into medical image analysis.4,17 The increase in computer power and the improvement in integrated image analysis systems have automatically enabled histological analysis to move from purely qualitative analysis to semiautomated and automated quantitative measurements.18,19 Histomorphometric analysis rather than computer-assisted image analysis innovations has been considered the gold standard methodology for bone quantitative evaluations. 4
Despite the development of new imaging technologies and the advantage of entire microscope glass slides being imaged, histomorphometric evaluations of critical-sized bone defects present numerous intrinsic and extrinsic challenges, including the length of the defect (30 mm defect plus ∼10 mm distal and 10 mm proximal host bone = ∼50 mm total defect size), which produces large histological image files. The file size of a high-resolution image can easily reach 20 gigabytes (for 1.29 μm resolution – 5 × microscope objective, 39904 × 19909 pixels image file).
To date, considerations such as the length of the bone defect and image file size ensure most of the histomorphometric evaluations of critical-sized bone defects remain limited to the analysis of a few regions of interest (ROI) at a time. Moreover, semiautomated methods (manual histomorphometric assessment) have intra- and interobserver variability, 20 primary data cannot be reanalyzed automatically as the histological image is not retained with the biopsy results file, 4 and the appraisal of large image data sets makes histological assessment and histomorphometric analysis labor intensive and time consuming.
The large volume of data obtained from the imaging of critical-sized bone defect samples also raises a number of economical, technical. and methodological challenges, including high costs; the acquisition, projection, viewing, storage, and analysis of content-rich images; lack of interoperability between image acquisition format and image analysis systems; poor image analysis user interface; inability to analyze multiple parameters (variables) in parallel; and no delivery of information in a systematic manner. Moreover, none of the technical factors mentioned has been standardized. 21
Histomorphometry is a quantitative approach used for the extraction of numerical data through the measurement of tissue samples using digitized images.10,17,22–23 The recommended histomorphometric nomenclature, symbols, and units as well as appropriate approaches and methods relevant to bone indices' calculations have been described by Parfitt et al. 24 and Dempster et al. 23 However, this standardization refers to bone histomorphometric terminology and dimensional extrapolation through the application of stereology, rather than a gold standard histomorphometric image analysis system/tool. 24
In summary, the Osteomeasure image analysis system is frequently used for obtaining histomorphometric evaluations from dynamic or digitized images.25–28 It is often referred to as the gold standard. Primary (2D measurements) and derived measurements (3D measurements) can be obtained, however experience and knowledge are required for its use. In contrast, the Aperio Image Scope image analysis system is freely available, requires little technical expertise, and it has short processing times. Hence, this software has potential for expediting the histomorphometric evaluation of critical-sized bone defect image data sets, and should be explored further. Herein, we present a standardized protocol for the image analysis of critical-sized bone defect samples stained with Goldner's Trichrome using the Osteomeasure and Aperio Image Scope image analysis systems using manual and automated image segmentation modes.
Materials and Methods
Histology
Histological resin sections of sheep tibiae collected from 17 Merino sheep were sourced from a previous study (Queensland University of Technology Animal Ethics Approval Number 0900000425). Three different treatment groups, each containing samples with a critical-sized 3 cm tibial defect, were evaluated in this study: group I (n = 3), a microfiber mesh scaffold only; group II (n = 5), the microfiber mesh scaffold was combined with functionalized alginate hydrogel; and group III (n = 9), functionalized alginate hydrogel combined with recombinant human bone morphogenic protein 2 (rhBMP-2) (see Supplementary Data S1 for more detail about the treatment groups).
Histological assessment was performed on ground resin sections stained with Goldner's Trichrome staining (histological sample preparation is described in Supplementary Data S1).
Resin ground sections were entirely imaged using ZEN software on a Carl Zeiss microscope (ZEISS Axio Imager 2; Carls Zeiss Microscopy, NY) (czi format images) with a 2.5 × objective and 2.58 μm per pixel resolution (also known as the scaling factor) (see Supplementary Data S2 for further details about image acquisition). Images were exported in Tagged Image File Format (TIFF) to be used in the Osteomeasure system and in Big TIFF pyramid format to be used in the Aperio Image Scope system. A subset of images limited to the defect site-only ROI was defined using the Aperio Image Scope image analysis system. The defect perimeter of 30 mm was defined excluding proximal and distal host bone. (See Supplementary Data S2 for further details about image properties.)
Histomorphometry
Seventeen bone defect-only ROI images were analyzed with the Osteomeasure and Aperio Image Scope analysis systems. Quantification of staining patterns for the formation of new bone and fibrous tissue formation was performed using both the manual delineation of tissue edges (manual—region based selection mode) and the automation of color-specific threshold ranges (automated—thresholding segmentation mode).
Using the Osteomeasure and Aperio Image Scope systems, the total tissue area of the defect-only ROI was manually traced. Then, manual and automated segmentation modes were used to acquire histomorphometric indices for two major bone variables, including bone and soft tissue. A protocol for the Osteomeasure and Aperio image scope systems for histomorphometric evaluation of static images using the manual and automated segmentation modes can be found in Supplementary Data in Supplementary Data S3 and S4, respectively.
The following criteria were used when measuring the major bone variables using the Osteomeasure and Aperio Image Scope systems:
Total tissue area: The total area of all stained tissue structures within the 30 mm defect-only ROI. Bone area: tones of green and blue color produced by the Goldner's Trichrome stain within the 30 mm defect-only ROI. Fibrous tissue area: tones of red color produced by the Goldner's Trichrome stain within the 30 mm defect-only ROI. All manual and automated area selections must be acquired using the same software system magnification (2 × ) (Osteomeasure system only).
Primary measurements acquired according to the nomenclature and indices' calculations described in Parfitt et al. 24 included:
Total tissue area (T. Ar): amount of the total tissue area within the defect-only ROI; acquired through manual area selection only.
Bone area (B. Ar): amount of the total area of bone tissue within the defect-only ROI; acquired through manual and automated area selections.
Fibrous tissue area (Fb. Ar): amount of total fibrous tissue area within the defect-only ROI; acquired through manual and automated area selections.
Statistical analysis
Statistical analysis was obtained with GraphPad Prism version 7.03 and excel. Intraobserver reproducibility (concordance of measurements done by one observer) and agreement between the image systems' results were evaluated by correlation coefficient (R2) with 95% confidence intervals (CI). A correlation coefficient of 1 or -1 corresponded to a perfect linear correlation between two measurements. A 0 value corresponded to no correlation between measurements. Intersystem Bland/Altman analysis was performed between image analysis segmentation methods.
Mean value, standard deviation (SD), and standard error of the mean were compared between the two image analysis systems according to segmentation modes, variables, and per treatment group. One-way ANOVA was used to compare treatment groups and t-test was used compare image analysis system (Aperio vs. Osteomeasure) measurements of bone and fibrous tissue formation per group treatment. Significance was defined as p < 0.05.
Results
Using the Osteomeasure software, it took ∼30 min to analyze each image in manual mode and 1 h when using the automated (thresholding) segmentation mode. Using Aperio software, it took ∼20 and 10 min to analyze the same images using the manual and automated segmentation modes, respectively.
The results obtained for bone and fibrous tissue formation within the defect-only ROI were analyzed without discrimination of treatment groups to determine intersystem (Osteomeasure vs. Aperio) parity of measurements.
Intersystem comparisons for the bone and fibrous tissue variables using different segmentation modes
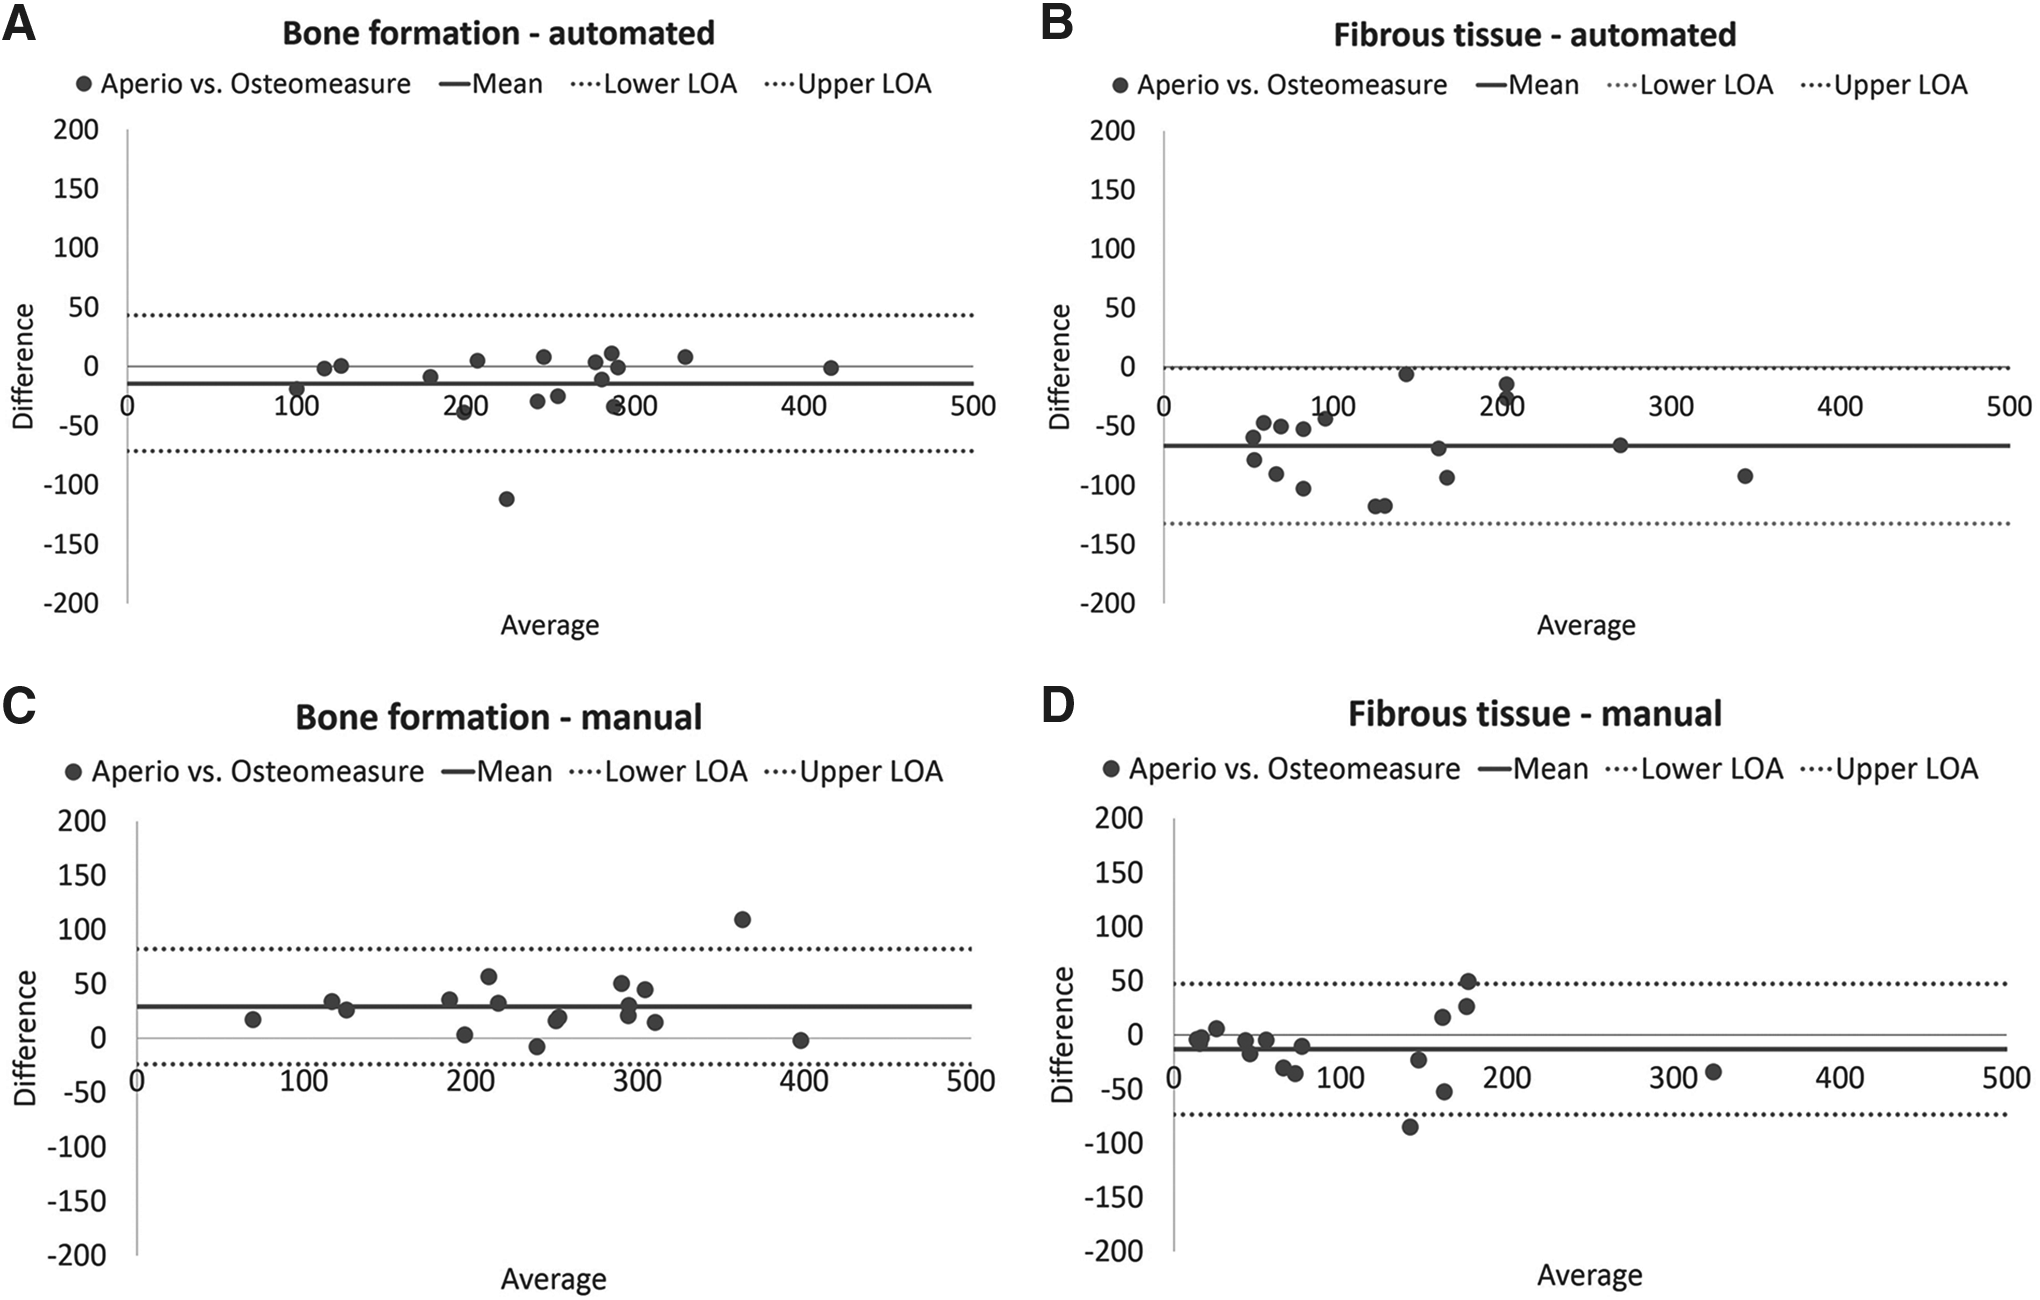
The automated bone and fibrous tissue paired measurements obtained with the Aperio and Osteomeasure systems presented both high and positive correlation (Bone: R2 = 0.8754, 95% CI: 0.8268–0.9769 and Fibrous tissue: R2 = 0.8464, 95% CI: 0.7877–0.9712). Although, high and positive correlation was found, the Bland/Altman paired analysis indicate that the bone (Fig. 1A) and fibrous tissue formation (Fig. 1B) measurements obtained with the Aperio Image Scope were mostly higher than the measurements obtained with the Osteomeasure system, suggesting a small variability within the difference of the Aperio and Osteomeasure automated paired measurements. However, most of the bone and fibrous tissue paired measurements were lying within the 95% limits of agreement, except for one of the bone paired measurements (Fig. 1A).
Intersystem comparison between automated and manual segmentation modes using Osteomeasure and Aperio Image Scope systems for new bone and fibrous tissue formation variable.
The manual bone paired measurements attained with the Aperio Image Scope system were in excellent agreement with the Osteomeasure system measurements (R2 = 0.9117, 95% CI: 0.8764–0.9839). Most of the paired measurements were within 95% limits of agreement of the Bland/Altman analysis, except for one pair of measurements, in which the Aperio histomorphometric measurement was lower than the evaluation attained with the Osteomeasure system (Fig. 1C).The manual fibrous tissue measurements attained with the Aperio system was positively correlated with the Osteomeasure manual results (R2 = 0.8734, 95% CI: 0.8241–0.9765). Although the manual correlation was higher than the correlation obtained with the automated segmentation mode, one pair of measurements was lying outside the Bland/Altman's 95% limits of agreement (Fig. 1D).
Figure 2 illustrates an overview and comparison between Osteomeasure and Aperio Image Scope systems when using thresholding (automated) and manual (region-based selection) segmentation modes. The images show that when using the automated segmentation mode, both Osteomeasure and Aperio Image Scope systems produced a finer image segmentation than with the manual segmentation mode (Fig. 2B–E). However, higher bone measurements and a discrepant paired measurement were found for the bone formation variable using the automated segmentation of the Aperio system.

Comparison of Osteomeasure and Aperio Image Scope systems manual and automated segmentation modes.
When examining data (Supplementary Data S5) to identify the outliers obtained in the intersystem comparisons, these results were determined to be the result of nonspecific background. In this study, bone resin images suffered from nonspecific background staining as a result of resin surface etching before Goldner's Trichrome staining. Contrary to paraffin samples, where paraffin is completely removed before staining, it is not possible to remove resin from the resin slides. Samples are etched to deliberately crack the resin allowing stain penetration. This procedure results in resin etching artefacts, such as fissures in the resin (Fig. 2F). These fissures mostly appear in the void areas, such as the resin around the tissue, in the central marrow cavities (Fig. 2F), and within the fibrous tissue areas (Fig. 2G), ensuing additional stain (mostly the bone variable tones).
Manual segmentation mode also affected the bone formation histomorphometric measurements, however, while using the Osteomeasure system, the bone marrow area cannot be completely and equally isolated without being affected by user manual selection. As such, the outliers obtained for the bone manual segmentation mode using the Osteomeasure system were identified as intraobserver variability error.
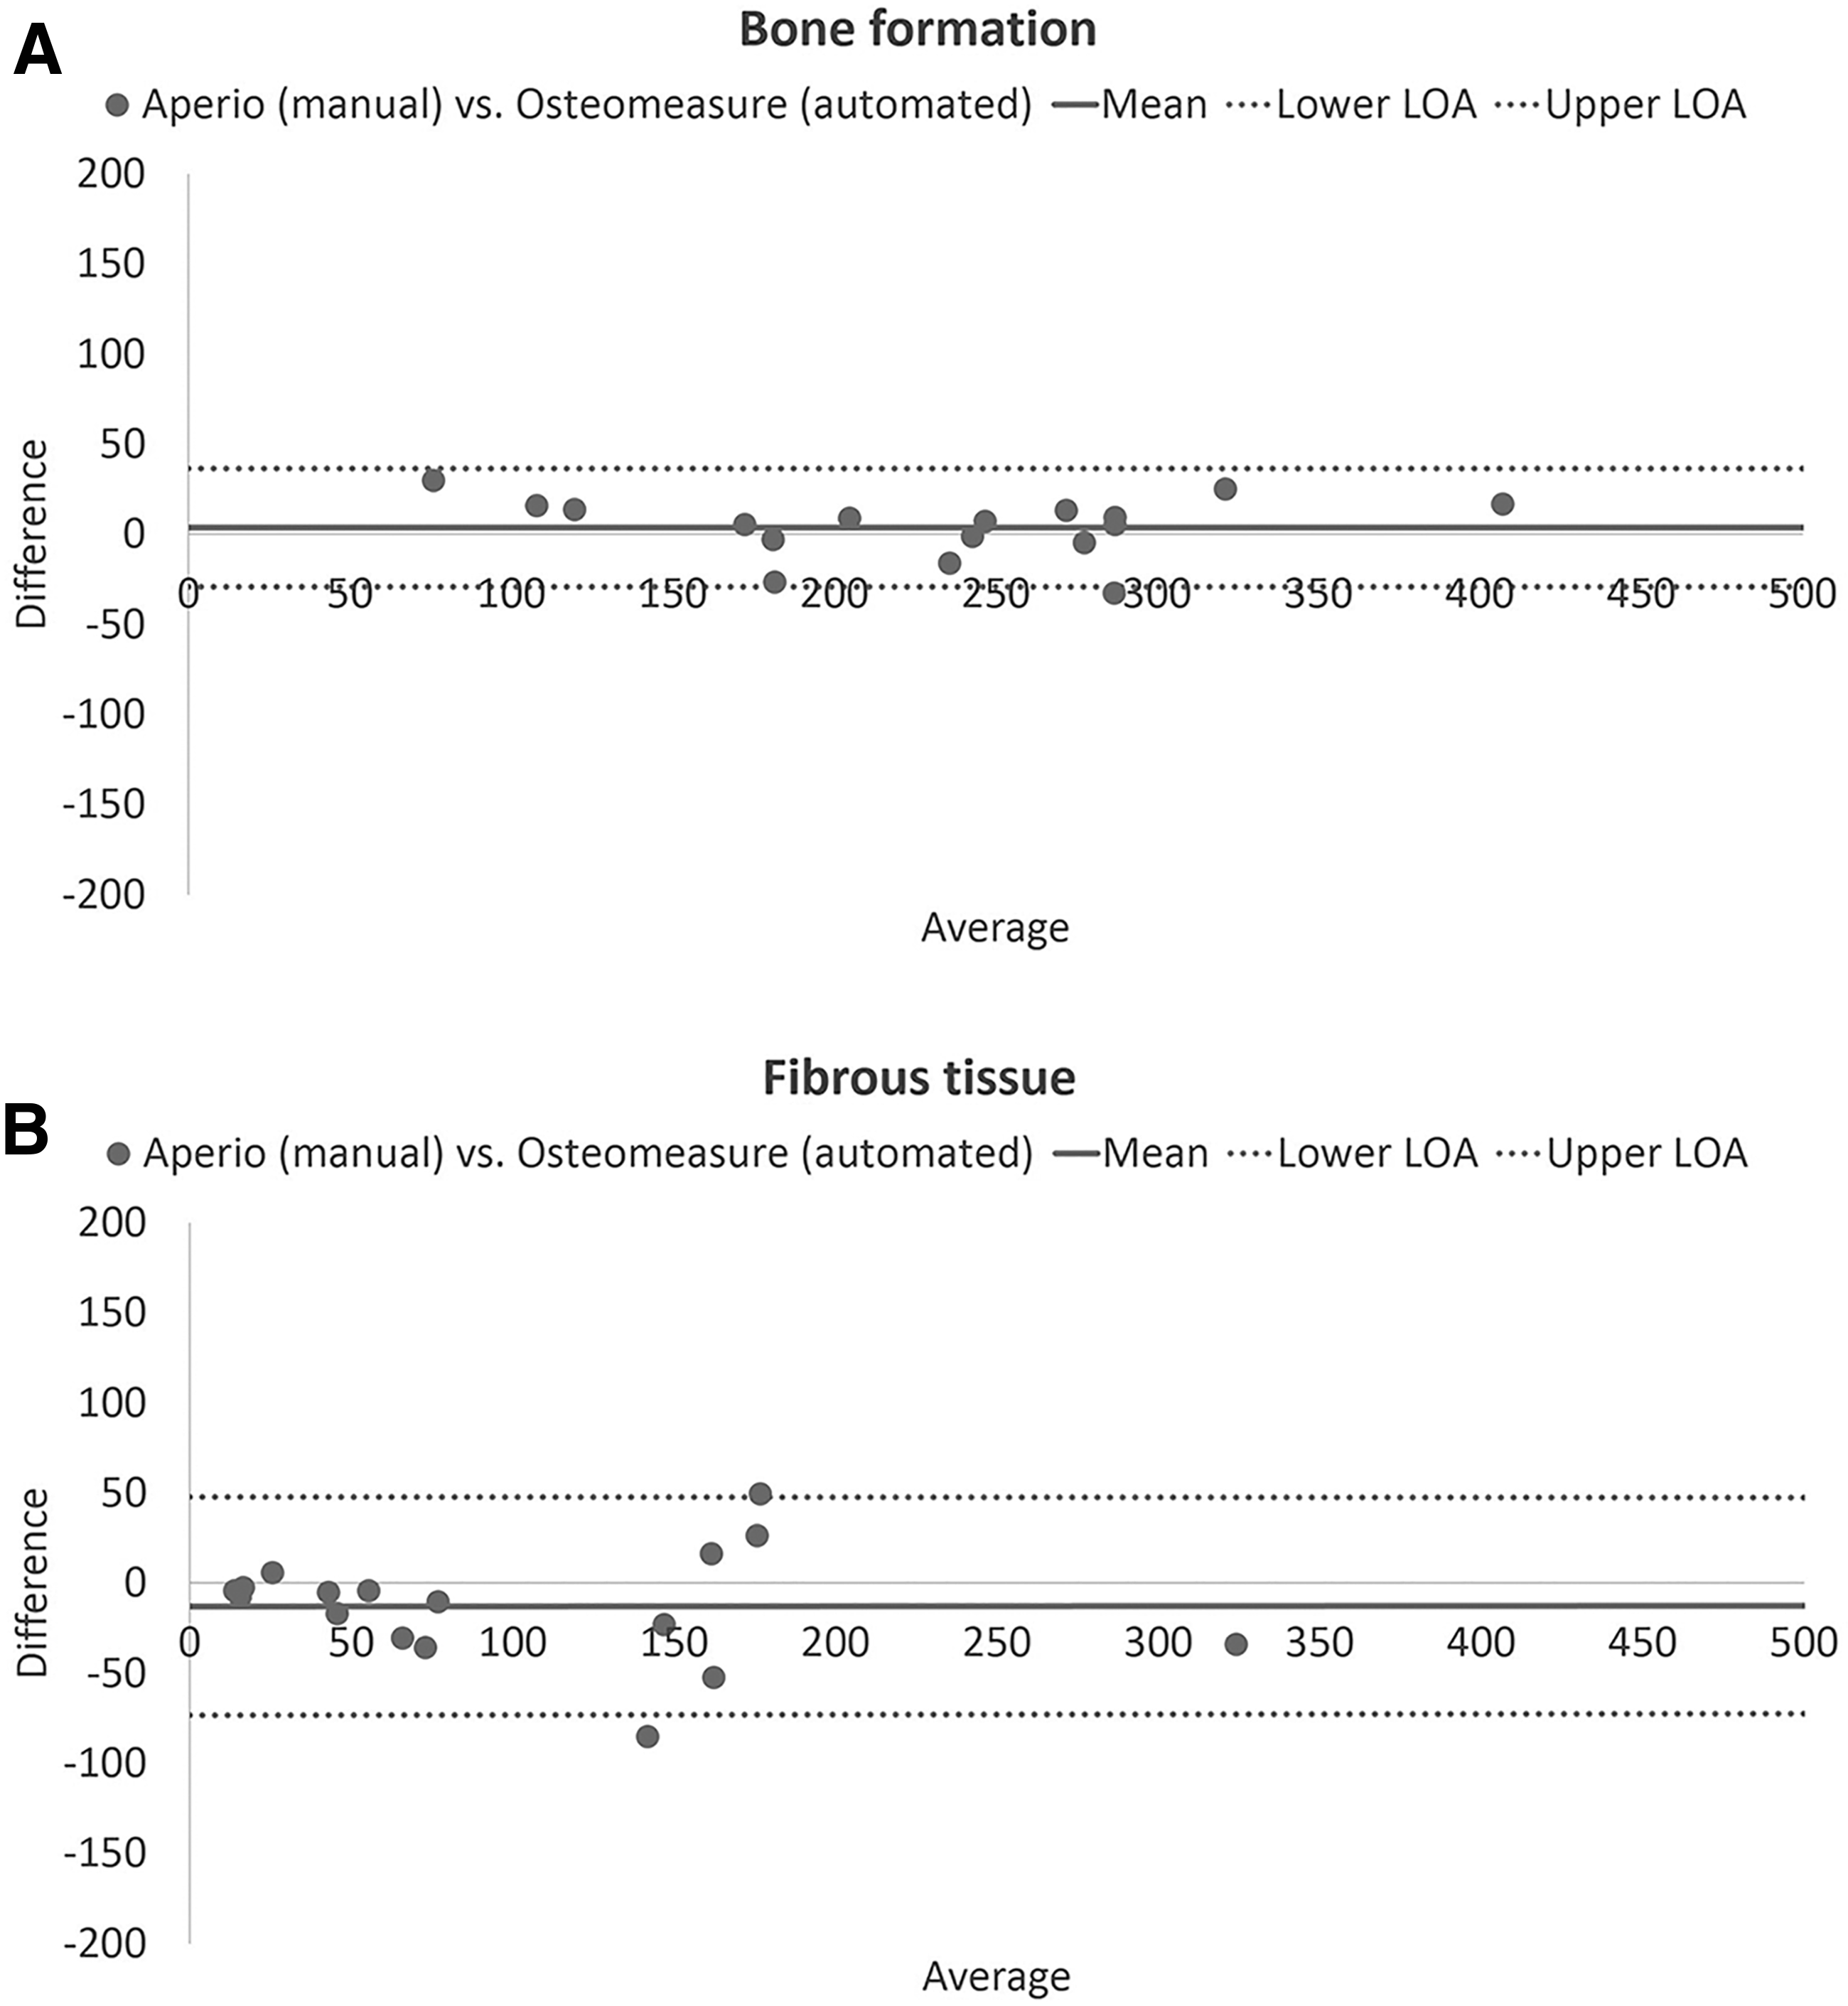
The previous intersystem comparisons (Fig. 1) showed that the automated segmentation mode of the Osteomeasure system (Fig. 2B) and the manual segmentation mode of the Aperio Image Scope (Fig. 2E) system produced a finer image pixel segmentation. Thus, to compare the different treatment groups, for bone and fibrous tissue formation, the automated measurement scores obtained with the Osteomeasure system were plotted against the manual measurements obtained with the Aperio Image Scope system (Fig. 3A, B).
Intersystem comparison between automated segmentation mode using Osteomeasure and manual segmentation mode using Aperio Image Scope systems, for new bone and fibrous tissue formation variables.
In terms of new bone and fibrous tissue formation, strong correlation of R2 = 0.9615 and R2 = 0.8734 was attained, respectively. The corresponding Bland/Altman analysis indicated nearly perfect agreement between the measurements for the bone formation histomorphometric variable (Fig. 3A).
Histomorphometric results according to treatment groups
To compare the treatment groups, ANOVA analysis was applied using the same histomorphometric data set (Fig. 4A–D).
ANOVA analysis for new bone and fibrous tissue formation.
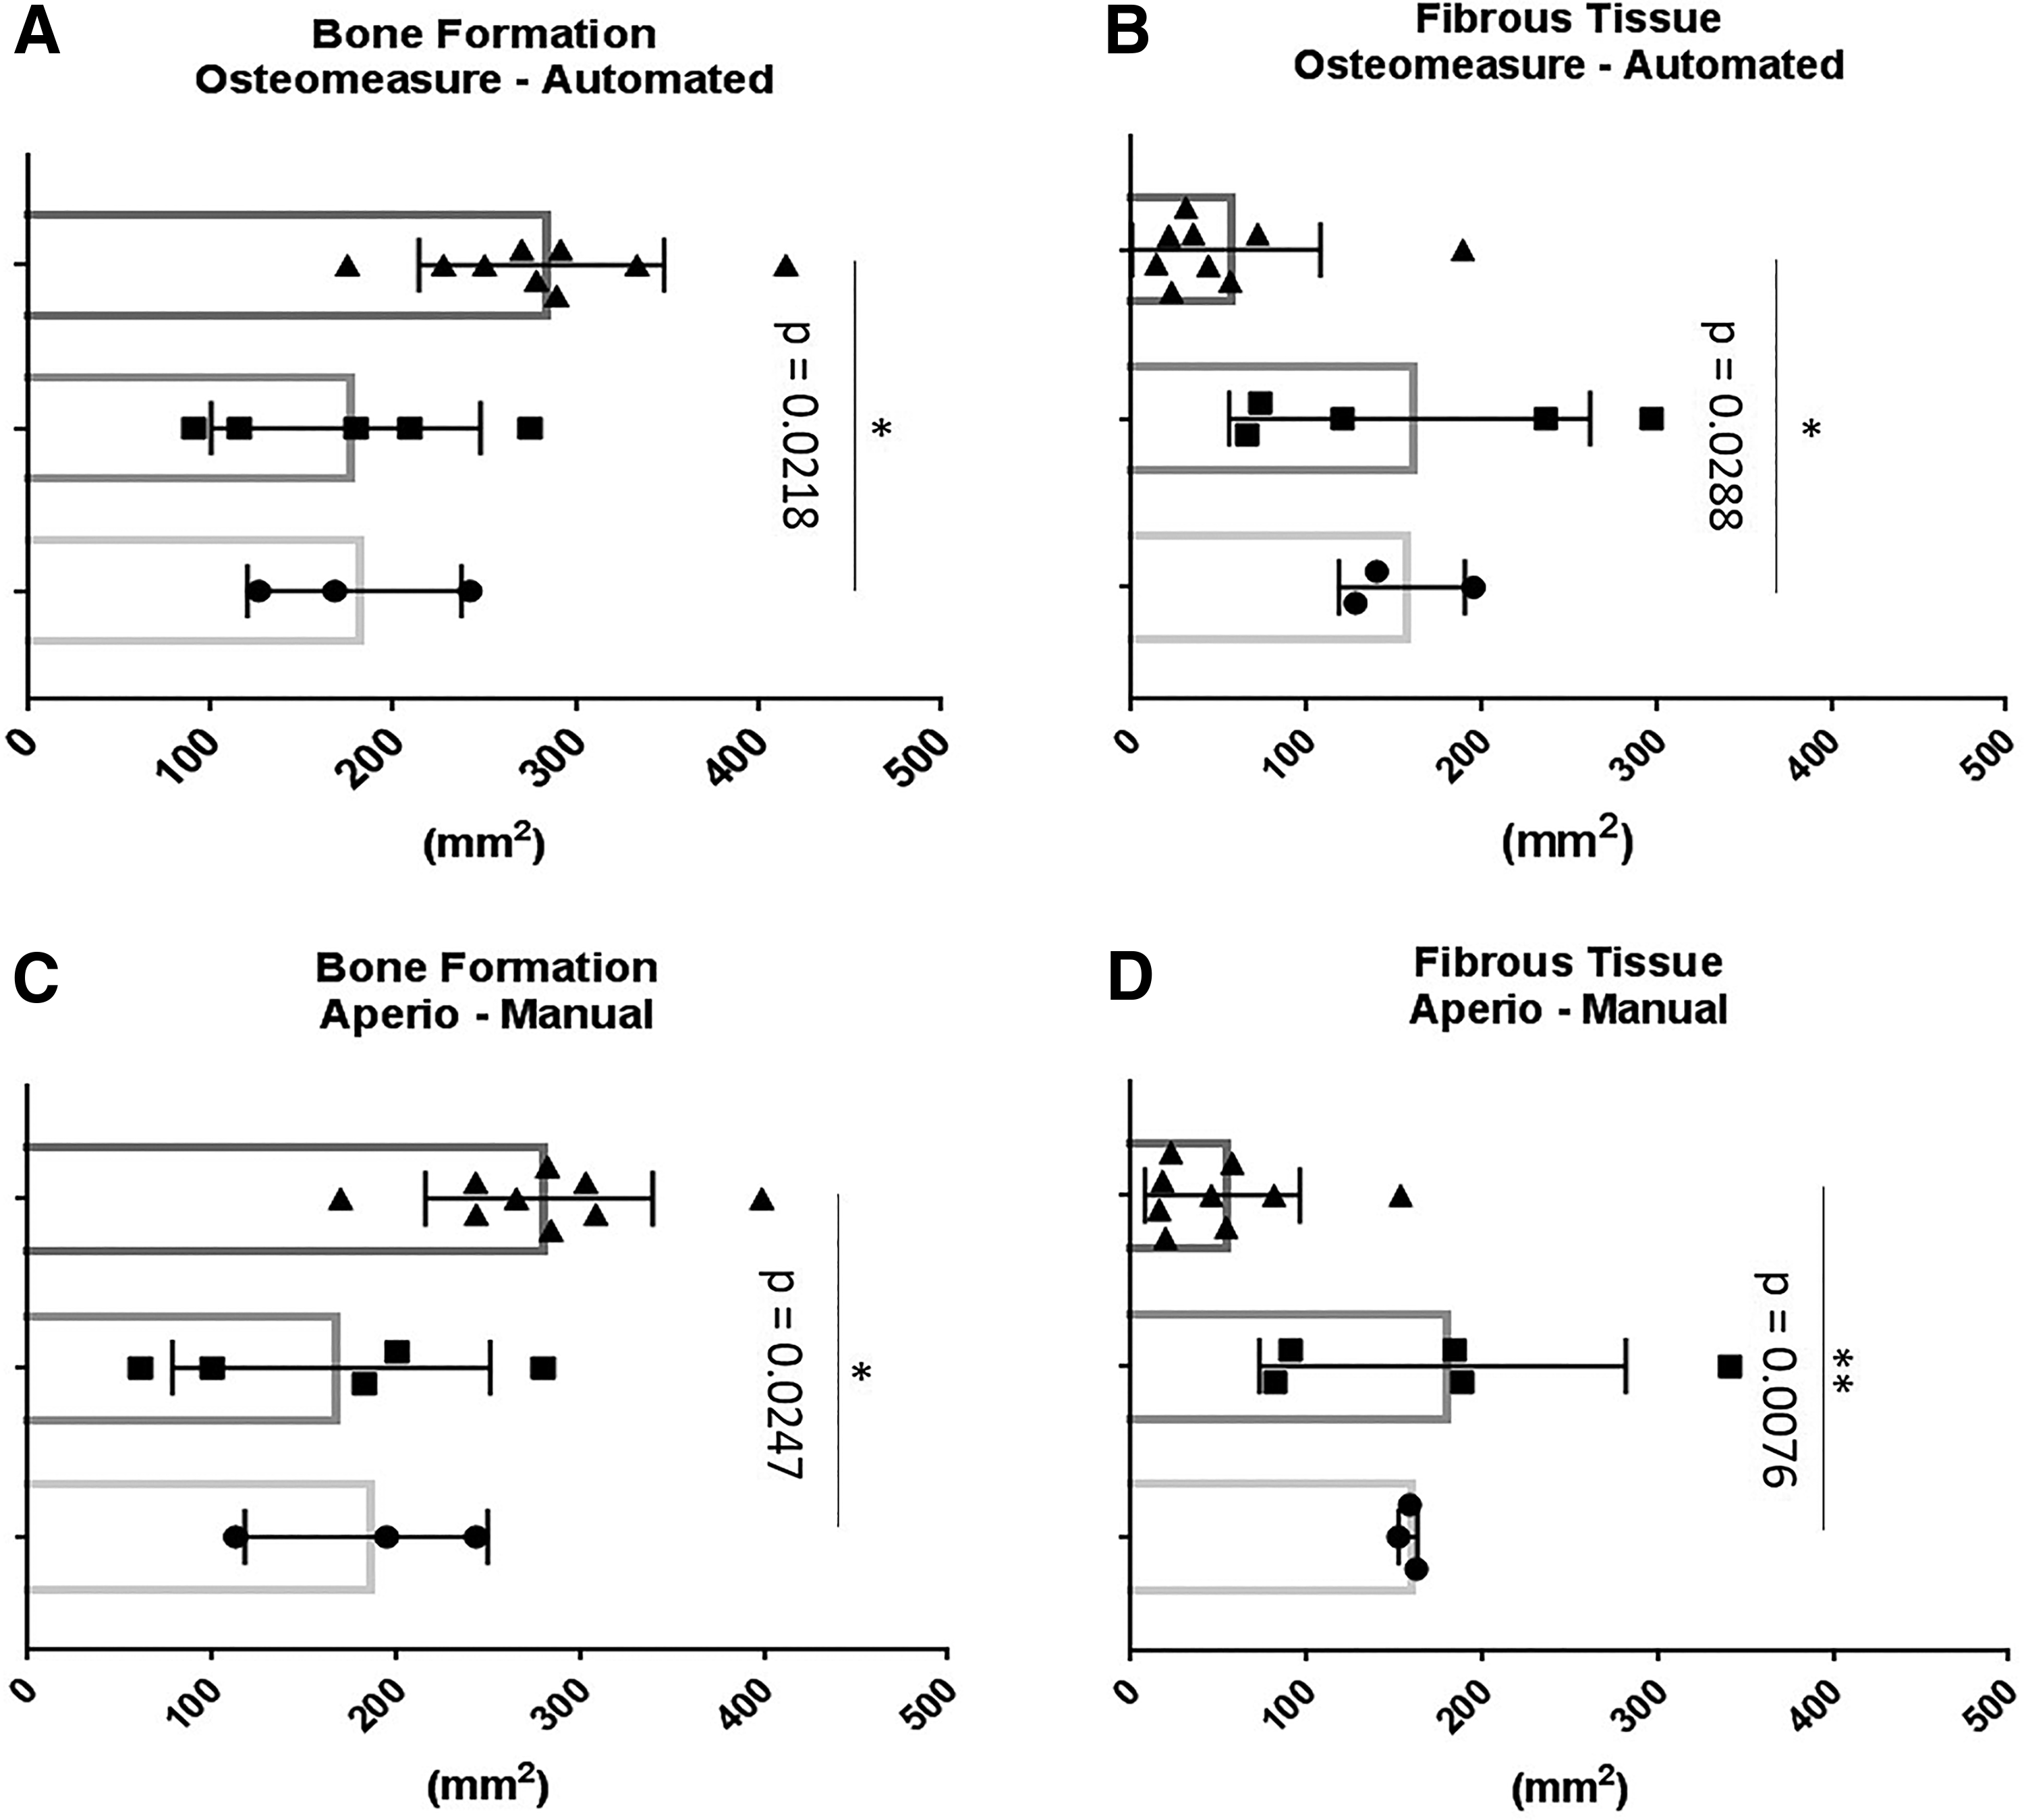
Significantly higher amounts of bone formation were observed within group III when compared with group I when using the Osteomeasure automated segmentation mode analysis (ANOVA, p = 0.0218) and when using the Aperio Image Scope manual segmentation mode analysis (ANOVA, p = 0.0247) (Fig. 4A, C). Correspondingly, a significantly lower amount of fibrous tissue formation was observed between group III and group I using the Osteomeasure automated segmentation mode (ANOVA, p = 0.0288) and using the Aperio Image scope manual segmentation mode analysis (ANOVA, p = 0.0076) (Fig. 4B, D).
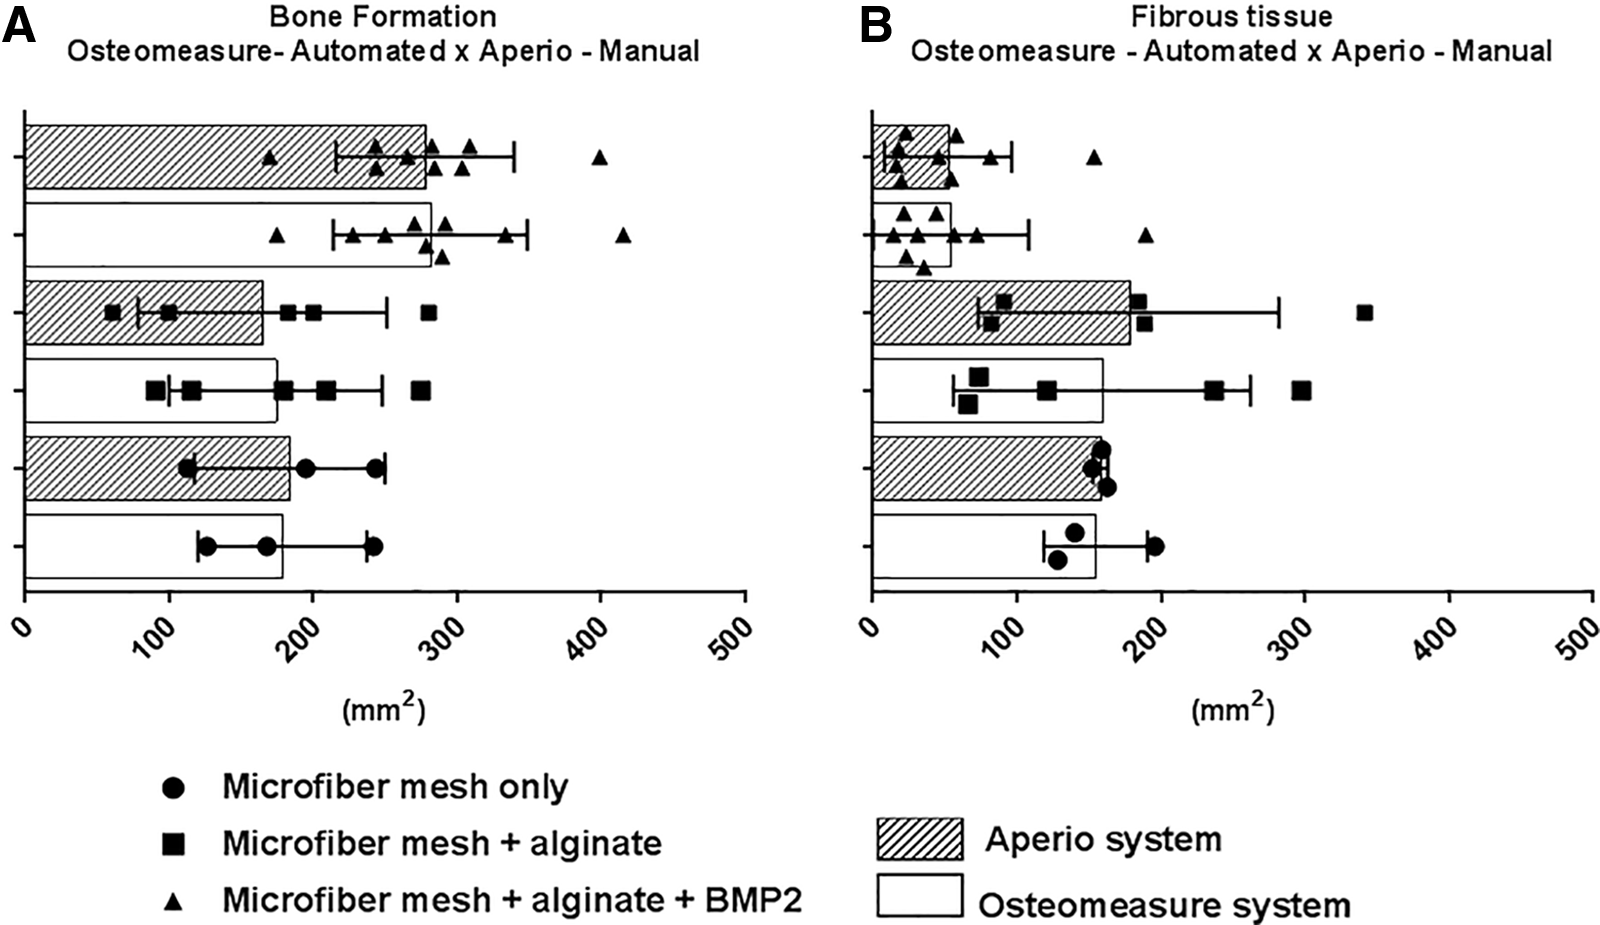
Although, the p-values found were slightly different, the results attained with the Osteomeasure automated segmentation mode and Aperio Image Scope manual segmentation mode followed comparable trends as illustrated in Figure 5A and B.
Comparison of the measurements trend obtained with the automated segmentation mode with the Osteomeasure system and with the manual segmentation mode with the Aperio Image Scope image analysis systems.
Descriptive intersystem statistical analyses
The accuracy of the intersystem descriptive statistical analyses was determined by comparing the SD of the Aperio Image Scope image analysis software to the widely used Osteomeasure system. Around 95% coefficient intervals was also determined (Table 1). Overall, the descriptive statistical analyses indicated that SD values obtained for the Aperio Image Scope image analysis was slightly lower than the SD obtained with the Osteomeasure system, thus suggesting comparability in terms of its precision (Table 1).
Intersystem Descriptive Analyses of Bone and Fibrous Tissue Formation According to Image Analysis System, Segmentation Modes, and Variables
95% CI, 95% coefficient interval; SD, standard deviation; SEM, standard error of the mean.
Similarly, intersystem descriptive analyses of bone and fibrous tissue formation per group treatment obtained with the Aperio Image Scope also did not differ from the Osteomeasure system, further confirmed by calculated p-values >0.05 (Table 2). However, these results denote that the sampling size was small, hence the wide 95% coefficient intervals. 29 These results suggest that the accuracy of the measurements obtained with the Aperio Image Scope are as precise as the Osteomeasure system analysis.
Intersystem Descriptive Analyses of Bone and Fibrous Tissue Formation Per Group Treatment
p, probability. Group III (microfiber mesh + alginate + BMP2); Group II (microfiber mesh + alginate) and Group I (microfiber mesh only).
Discussion
The digitalization of microscope slide sections has allowed the capture of histological images to shift from partial image acquisition to scanning whole microscope glass slides, further improving and refining histological image assessments. 30 The content and quality of histological images are directly associated with the microscope optics used when acquiring the histological image. While the TIFF is a widely accepted image format, owing to its capabilities and flexibility, the TIFF images produced by the Zen Software were not supported by the Aperio Image Scope system. Thus, the images had to be saved as Big TIFF/pyramid format, enabling compatibility between image analysis software and the displayed image format.
Image segmentation approaches commonly include: (i) thresholding; (ii) edge based; (iii) region based; and (iv) active contour modes. 31 Our histomorphometric analyses were carried out using two well-known image analysis systems, Osteomeasure and Aperio Image Scope, comparing two image segmentation methods, thresholding and region-based modes, using Goldner's Trichrome-stained sections of critical-sized bone defect samples.
Variability of stain colors, pixel color intensity overlap due to heterogeneity of staining color, as well as image staining background were the main issues associated with the thresholding (automated) image segmentation mode. Lejeune et al., 20 while validating a new computer-assisted image analysis procedure, described similar findings with stain reproducibility and the necessity for addressing consistent methods for quantification of staining. Within void areas where no tissue structures exist, background staining may occur due to resin etching artefacts. Background pixel intensities that closely mimic the colors produced by the Goldner's Trichrome stain (such as the shades of blue and green for the bone variable), also are included in the histomorphometric quantification, and would explain the higher bone formation measurements obtained with the automated segmentation mode while using the Aperio Image Scope analysis.
Changing the histogram intensity for removing image background is not recommended. This type of operation alters the image content permanently by changing the pixel values. Once it is applied and the image is saved, image data cannot be retrieved unless the sample is imaged again. 32 This issue also compromised the fibrous tissue automated results obtained with the Aperio image analysis system. In this case, the central cavities (trabeculae spaces) filled with hematopoietic tissue and areas of nonmineralized bone, which stained reddish (same color of fibrous tissue), also were counted as fibrous tissue, and would also explain the higher measurements attained.
A similar issue happens while using the Osteomeasure system; however, instead of selecting staining background, the system selects the central marrow area cavities within the bone defect site. This could be related to the Osteomeasure processing steps for the thresholding of pixel acquisition. After thresholding selection, the Osteomeasure system requires smoothing of the thresholding selection followed by acceptance of the pixel selection. During the smoothing step, extra blurring is included in the selection, hence adding extra pixels to the final histomorphometric quantification.
Hangartner 33 reported the influence of thresholding techniques on the selection of bone parameters as a similar blurring artefact. The reason for such an effect relies on the finite resolution of the image matrix. A pixel can be represented only by one value, therefore if bone tissue and marrow cavities are sharing the edges or part of a pixel, the selection will be based on an average of all tissues at that location. This issue was observed while using the automated image segmentation of the Osteomeasure system, where bone marrow cavities within the bone tissue had additional blurring artefact, thus selecting extra pixels within an image.
In line with the color overlap mentioned previously, the present study observed that manual segmentation mode using the Aperio image Scope system took longer to achieve histomorphometric evaluation than the automated segmentation mode. However, manual selection was still, on average, 10 min faster than the automated segmentation mode using the Osteomeasure system. Corroborating our finding, Zhang et al. 4 obtained similar results while using Osteomeasure automated segmentation mode for histomorphometry of whole slide imaging. This large difference in time may be related to the Osteomeasure image analysis software system approach. 19 Automated segmentation saved time when color overlap was not an issue, however, when color overlapping was problematic, it took some time to obtain the right pixel color selection.
A solid understanding of image analysis software and image properties is required to generate reliable conclusions. Histomorphometric measurements in digital images can be compromised by several factors, such as image dimensions and scaling factors. Therefore, image analysis system calibration is compulsory to ensure reproducibility and accuracy of histomorphometric measurements. Before any measurement taken, it is imperative to retrieve the hierarchical framework (image raw data/image properties) of the image processing parameters. False conclusions can result due to poor knowledge and understanding of image and image analysis software features.
With the Osteomeasure system, when the images are loaded and read by the system, they are manually scaled according to the TIFF image. Then, the user needs to follow a sequence of steps from retrieval of image properties, such as dimensions and scale per pixel, to the conversion of image width and high from pixels to microns. In comparison, Aperio Image Scope is relatively easy to calibrate as the user only needs to insert the resolution per pixel by which the image was acquired.
Aperio Image Scope also offers the advantage of working with the entire image section by using selection tools, such as the rectangle tool selection to select the area of the region of interest (defect site) within an image. However, with regard to interoperability between image file format and image analysis system, disadvantages are encountered, including image dimensions and format restriction.
Another limitation of working with the Aperio Image Scope system is that the user has to find out the pixel value of a specific color to adjust the algorithm selection. Image color pixel information is provided as RGB color mode. With the Aperio Image Scope system, the red, green, and blue (RGB) color mode must be converted to hue, saturation, and intensity (HSI) color mode, which extends the time spent to tune the algorithm selection. In addition, image background must be excluded from the analysis, thus manual image segmentation gives a finer histomorphometric evaluation. An additional drawback is that the histomorphometric data generated only provide the total tissue area in mm2, whereas the other specific measurements, such as the variables used in this study, need to be converted from pixels to mm2 afterward.
The Osteomeasure system also presents a few disadvantages, including high costs and inability to analyze multiple parameters in parallel or reanalyze primary data automatically, since the histological image is not retained with the analysis results file. It also requires fine hand motor coordination, as manual tracing cannot be interrupted in the middle of a manual tissue area selection. Moreover, manual tracing is a time-consuming and labor-intensive method, especially while appraising large image data sets. 4 Such a technique directly depends on the subjective abilities of the user and it is prone to inconsistencies between analyses (intraobserver) and users (interobserver).
With the increasing use of histomorphometric evaluations, the key aim of this study was to identify whether the histomorphometric data produced by the Aperio Image Scope were sufficiently reliable when compared with the widely used Osteomeasure image analysis system. A comparison of the image analysis systems and segmentation modes was made using the same critical-sized bone defect image data set, and it was found that the results obtained with the Osteomeasure and Aperio Image Scope systems were remarkably similar with regard to the ANOVA analysis obtained for bone formation and slightly different for the fibrous tissue histomorphometric variable.
The freely available Aperio Image Scope software permitted both manual and automated segmentation mode approaches, enabled the production of highly similar histomorphometric data, required minimal supervision and user training, and was far more expeditious, interface friendly and cost effective. However, no single image analysis package is perfect for every application. Image analysis systems vary in their functionality and interoperability with regard to different histological sample types and sizes, including the image acquisition software used for obtaining the histological images.
Footnotes
Acknowledgments
The authors would like to gratefully acknowledge Dr. Jan Henkel for providing the sheep specimens used in this study. The authors would like also to thank the Histology Facility Central Analytical Research Facility (CARF), and Institute of Health and Biomedical Innovation (IHBI) at Queensland University of Technology (QUT) for providing general facility support.
Disclosure Statement
No competing financial interests exist.
Funding Information
Financial support for this project was provided by the Australian Research Council (ARC) under the Linkage Program (LP0991527; awarded to D.W.H.).
References
Supplementary Material
Please find the following supplemental material available below.
For Open Access articles published under a Creative Commons License, all supplemental material carries the same license as the article it is associated with.
For non-Open Access articles published, all supplemental material carries a non-exclusive license, and permission requests for re-use of supplemental material or any part of supplemental material shall be sent directly to the copyright owner as specified in the copyright notice associated with the article.