
Abstract
Background:
Several staging systems exist to estimate the prognosis for patients with thyroid carcinoma. Our goal was to develop a new staging system to predict cancer-specific survival (CSS) and evaluate it against published systems.
Methods:
The Cedars-Sinai Medical Center (CSMC)'s staging system was derived using data from an adjusted analysis of 1622 patients with differentiated thyroid carcinomas (DTCs) from the CSMC Thyroid Cancer Center. Mean follow-up time was 11.8 years. There were 1180 female and 442 male patients with a mean age of 46. Staging systems reviewed include University of Alabama (Birmingham) and M.D. Anderson Cancer Center (UAB-MDACC); the Tumor–Node–Metastasis (TNM) 5th and 7th editions; Memorial Sloan-Kettering (MSK); the National Thyroid Cancer Treatment Cooperative Study (NTCTCS); Ohio State; Clinical Class; Metastases, Age, Completeness of resection, Invasion, and tumor Size (MACIS); Noguchi; and the Yildirim model for predicting outcomes. The proportion of variance explained (PVE) and the C-index were computed to rank and compare each staging system's ability to predict CSS with this patient population.
Results:
Adjusted hazard ratios revealed that age at surgery of >45 years, the presence of distant metastases, capsular invasion, and vascular invasion were the most significant predictors of CSS in this patient population. The final CSMC risk score consists of low-, moderate-, and high-risk groups. Among the well-differentiated thyroid carcinoma staging systems, the CSMC and NTCTCS ranked highest with PVE values of 5% and 4.3%, respectively, while the NTCTCS and CSMC staging systems were reversed using the C-index (0.77 and 0.76, respectively).
Conclusion:
The PVE and C-index values were relatively low across all applicable staging systems and varied in each study reviewed. This suggests that no one staging system has been shown to be superior to another across different patient populations with DTC. In the future, additional factors, such as biological markers, added to the clinical and pathological characteristics may lead to the development of superior staging systems.
Introduction
In 2007, Cedars-Sinai Medical Center (CSMC) established a thyroid cancer database for patients receiving treatment at the institution. The goals of this study were to develop a staging system using this database that would allow us to predict cancer-specific survival (CSS) for patients with DTC and to compare our system with many of the previously published systems.
Methods
The study population consisted of 1622 patients treated for papillary (PTC) and follicular thyroid carcinomas (FTCs) at the CSMC Thyroid Cancer Center between the years 1950–2011. This database includes a retrospective review of data derived from the medical records of local endocrinologists and surgeons and the Department of Pathology and Laboratory Medicine. All of the operative and pathology reports were reviewed in detail. In particular, the majority of the pathology reports provided full and detailed descriptions of the tumors, which allowed for appropriate pathologic interpretation and classification of each tumor based on current standards. As surgical treatment of the thyroid gland has evolved throughout this time period, particularly during the last decade for prophylactic versus therapeutic central lymph node dissection (level VI), patients over the age of 45 may have been slightly upstaged from the time of primary diagnosis. The presence of distant metastatic disease was staged as M1 if the disease was discovered within 6 months of surgery on follow-up scans, including post-therapy RAI, computed tomography (CT), positron emission tomography (PET), or magnetic resonance imaging (MRI) scans. Patient deaths were confirmed by data from the CSMC cancer registry, the California Department of Public Health's Office of Vital Records, or the Social Security Death Index. The cause of death was ascertained from the treating physician or review of death certificates. This study was reviewed and approved by CSMC's Institutional Review Board.
Ten staging systems were identified from a comprehensive literature review and applied to the sample population specifically for cancer-specific mortality. For DTC, these included University of Alabama (Birmingham) and M.D. Anderson Cancer Center (UAB-MDACC) (2,4,7); the American Joint Committee on Cancer's Tumor–Node–Metastasis (TNM), both 5th and 7th editions (2,4,6,10,12,15,17,22,31); Memorial Sloan-Kettering (MSK) (2,4,6,8,9,19,20,28,29); the National Thyroid Cancer Treatment Cooperative Study (NTCTCS) (2,5,12,15); Ohio State (2 –4,6,12,15,16); Clinical Class (2 –4,6,11,12,17); and the Yildirim model for predicting outcomes (27). Additionally, for papillary thyroid carcinomas (PTCs) specifically, the Metastases, Age, Completeness of resection, Invasion, and tumor Size (MACIS) (1 –4,6,12,15,17 –22) and Noguchi (2,6,23) systems were included in the analysis.
Seven other staging systems were considered, but were not applicable to the CSMC data. The European Organization for Research and Treatment of Cancer (EORTC) (1 –4,6,12,25), the Age, Metastases, Extrathyroidal extension, and Size (AMES) (1 –4,6,12 –15,17,19,22); the University of Münster system (2,4,24), and the Virgen de la Arrixaca University Hospital at Murcia (Spain) (2,26) staging systems are models of all-cause mortality, while our study goals were to model CSS. Table 1 gives a brief summary of variables used in these staging systems. The Age, histologic Grade, Extrathyroidal extent, and tumor Size (AGES) (1,6,12,15); the DNA ploidy, Age, Metastases, Extent, and tumor Size (DAMES) (2,30); and the Sex, Age, and Grade (SAG) (6) systems are staging systems requiring data not captured in our data set.
The Tumor–Node–Metastasis Staging System (TNM) is one of the most commonly used staging systems. This system was developed and is maintained by the AJCC and the UICC as a tool for doctors to stage different types of cancer based on the extent of the tumor (T), the extent of spread to the lymph nodes (N), and the presence of metastasis (M).
AJCC, American Joint Committee on Cancer; AMES, Age, Metastasis, Extrathyroidal extension, and Size; EORTC, European Organization for Research and Treatment of Cancer; FTC, follicular thyroid carcinoma; MACIS, Metastasis, Age, Completeness of resection, Invasion, and tumor Size; MSK, Memorial Sloan Kettering; NTCTCS, National Thyroid Cancer Treatment Cooperative Study; PTC, papillary thyroid carcinoma; UAB-MDACC, University of Alabama (Birmingham) and M.D. Anderson Cancer Center; UICC, Union for International Cancer Control.
Cox proportional hazard modeling (33) was used to relate risk factors to CSS times after confirming that the assumption of proportionality of hazards was met. Risk factors considered in both unadjusted and adjusted Cox models were variables, such as sex, age at surgery, tumor size, local invasion, distant metastasis, vascular invasion, nodal involvement, multifocality, the presence of metastatic disease, and RAI treatment. The initial variable selection for the fully adjusted model was performed as described by Collett (34), and then validated by means of bootstrap analysis (35,36). In the bootstrap procedure, 500 random samples of the 1622 cases were sampled with replacement. The model was then fitted to every bootstrap sample to determine estimates of coefficients for the Cox model of survival. Means of the estimated coefficients were then tested by way of a t-test. Variables with coefficients with a p-value>0.05 were removed from the model and the bootstrap validation process repeated.
The final set of variables selected was then fitted back to the original full data set in a Cox hazard model of CSS time to generate estimates of regression coefficients and hazard ratios. The final risk function was translated into risk scores (37), and then further stratified into 3 risk categories of low, moderate, and high risk to determine the CSMC staging system for DTC. To rank and compare each staging system's ability to predict CSS among this patient population, Kaplan–Meier curves were generated to visualize the data and the proportion of variance explained (PVE) for each staging classification (37) and was calculated from the following formula: PVE=RM 2=1−(LR /LU )2/N , where LR and LU are the restricted and unrestricted maximum likelihood in which stage classification is the only parameter; N is the number of patients whose data are used in the model; and RM 2 is the proportion of total uncertainty attributed to the model determined from a contingency table analysis of frequency of residual-disease–free versus disease stage. A higher PVE value for one model over another indicates superiority in predicting survival times in a Cox regression model (6,38).
Additionally, as a measure of concordance, the C-statistic for each model was also computed (39,40). The C-statistic in survival-time modeling is analogous to the area under a receiver-operating characteristic curve and represents an estimate that a model accurately distinguishes cases of higher risk of mortality from lower risk cases. The C-statistic ranges from 0.5 (indicating complete randomness, thus a poor performance) to 1.0 (perfect prediction and perfect fit). In general, a C-statistic above 0.7 indicates a good overall model fit (41).
Data are presented as means and standard deviations (SDs) or counts and percentages. Statistical significance was set at p<0.05. All statistical analysis was performed using SAS v.9.3 (Cary, NC).
Results
The study population included 1180 women and 442 men and a mean follow-up time of 11.8 years (SD=10.4). Table 2 gives basic demographics of the CSMC DTC patient population as well as the TNM stage distribution. Over a third of the study population were over 50 years of age at the time of surgery (n=630) with a mean age of 46 years (SD=15.6). PTC accounted for 93% of DTC cases.
Data are reported as mean±standard deviation or as number (percent).
The unadjusted and adjusted hazard ratios for CSS are presented in Table 3. In both the unadjusted and adjusted analysis, histology, tumor size, lymph node involvement, and multifocality were not found to be significant factors in CSS. While the male sex was significant as an independent variable, it was not significant in the adjusted analysis, and thus not included in the final model
HR, hazard ratio; CI, confidence interval.
Adjusted hazard ratios for this population revealed that age at surgery of >45 years, presence of distant metastatic disease, capsular invasion (T3/T4), and vascular invasion were the most significant predictors of CSS in DTC. Although RAI therapy was considered in the modeling with 53% of the DTC population receiving treatment (n=862), it was not found to be a significant predictor of CSS in this population. Additionally, we found that differentiating between N1a and N1b did not improve our model, as there was no statistical difference between the two. The final CSMC risk scoring method for CSS in DTC cases derived from the adjusted analysis is provided in Table 4. The presence of distant metastatic disease (12 points) and being over the age of 45 at the time of surgery (11 points) were found to be the largest risk factors for cancer-specific mortality, while capsular and vascular invasion status were less so, with 5 and 4 points, respectively. Based on our risk assessment criteria, patients who scored less than 10 points had the lowest overall risk of cancer-specific death, while patients with more than 19 points had the highest overall risk of cancer-specific death (Table 5). Within our risk stratification staging system, all three risk strata (low, moderate, and high) were each statistically significantly different from one another in predicting CSS time with p<0.001.
Using the clinicopathological data within our dataset, each case was staged according to previously published staging criteria for comparison. Kaplan–Meier curves of CSS times of applicable staging systems are presented in Figure 1 for DTC and Figure 2 for staging systems applicable to PTCs specifically. From these figures, it is apparent that the high-risk group has a poor survival rate, which requires more aggressive care. Furthermore, our low- and moderate-risk groups have significant differences in CSS times as early as 5 years after diagnosis (Table 5). The stratified risk assessment ranking by PVE and the C-index are summarized in Table 6. As higher PVE values indicate a better fit of the staging criteria, our new CSMC risk stratification system and the NTCTCS system performed the best (PVE of 5% and 4.3%, respectively), for DTC cases. Additionally, for PTC cases only, the CSMC staging system and MACIS system had the highest PVE values at 4.2% and 3.5%, respectively.
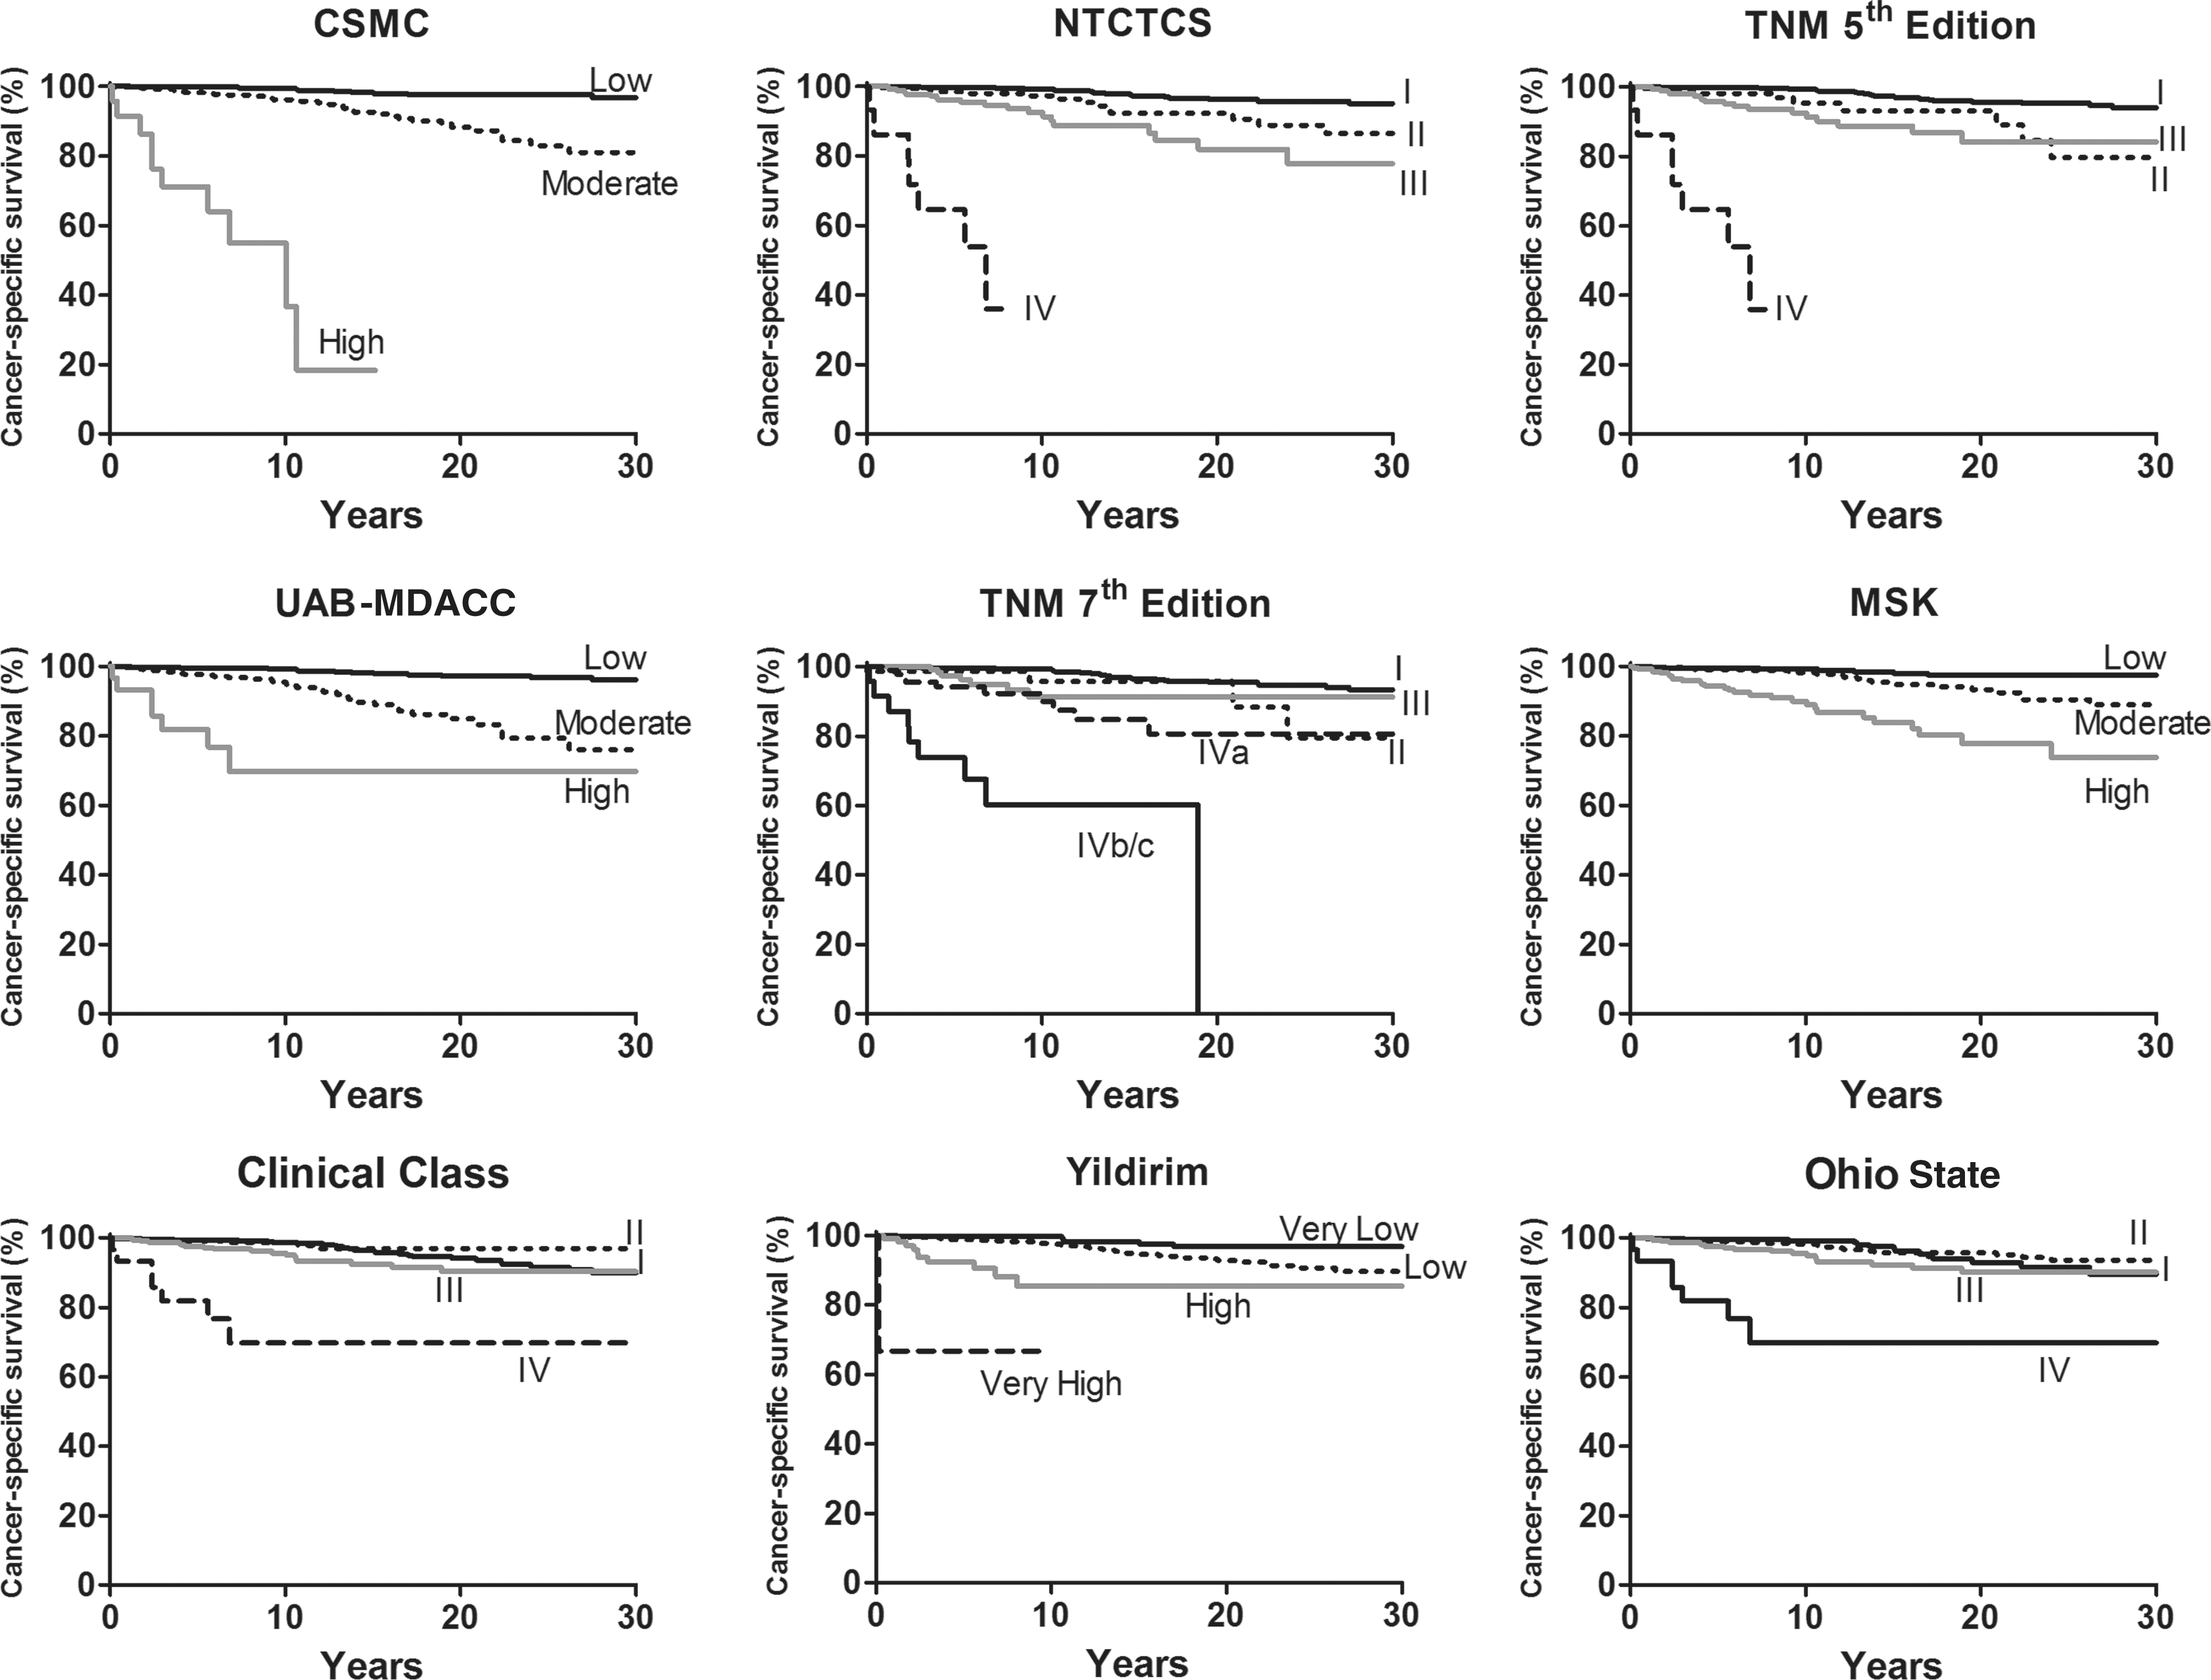
Kaplan-Meier curves of cancer-specific survival (CSS) times for differentiated thyroid carcinomas (DTC) by various staging criteria. p<0.001 for all staging criteria.
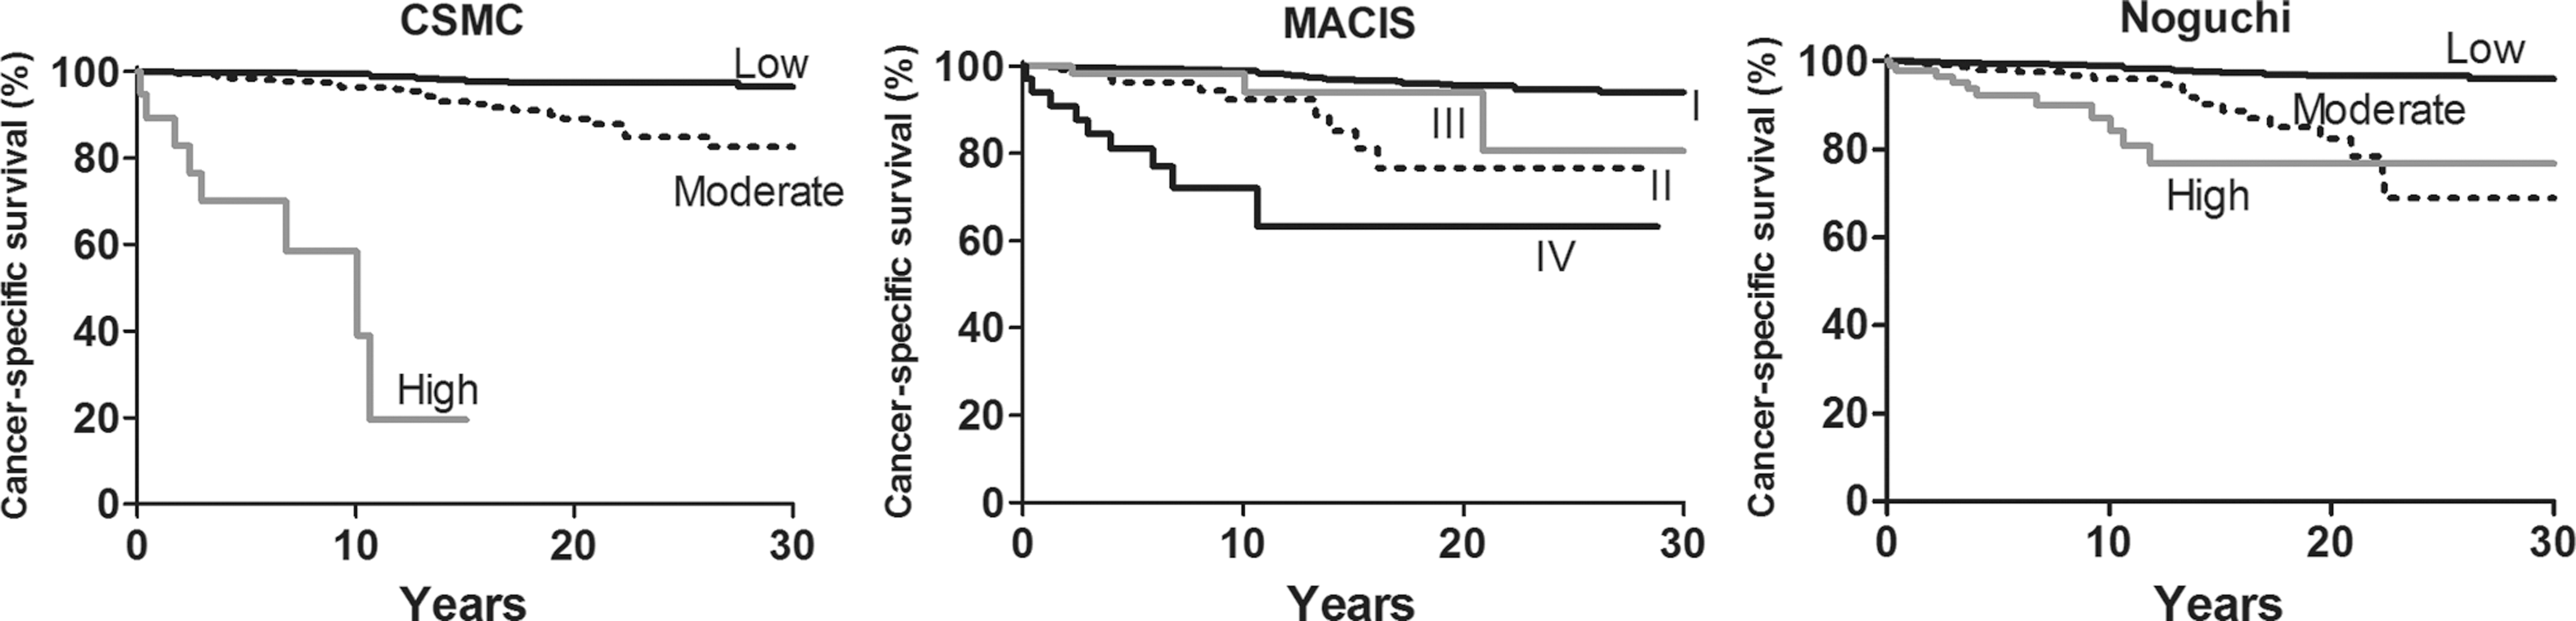
Kaplan-Meier curves of CSS times by various staging criteria specific only to PTC pathology. p<0.001 for all staging criteria.
MACIS and Noguchi methods were scored only in PTC cases.
CSMC, Cedars-Sinai Medical Center; DTC, differentiated thyroid carcinoma; PVE, proportion of variance explained.
The PVE levels are all very low due to little variation in the original dataset. The C-statistic was also explored and showed that NTCTCS resulted in a C-index score of 0.77, with the CSMC and TNM 5th edition following closely behind at 0.76 for DTC. Furthermore, the C-index for the PTC cases specifically showed that the NTCTCS system ranked highest with a score of 0.75, while both CSMC and TNM 5th editions were 0.74. As a result, using both the PVE and C-index resulted in similar rankings among each staging system.
Discussion
The CSMC Staging System developed from the adjusted Cox proportional hazard model utilizes age, the presence of distant metastasis, capsular invasion, and vascular invasion to risk stratify the patients. Our model did not include sex, tumor size, regional lymph node metastasis, multifocality, or DTC histology (papillary or follicular), as these factors were not significant independent predictors of CSS in our population. To compare the different staging systems, cases from the CSMC database were classified according to the staging criteria listed in Table 1 using systems, including our own, developed to model CSS in DTC. The ability of each staging classification to predict CSS was compared with that of other staging classification schemes by computation of the PVE (38) and the C-index (39,40).
Although the TNM system is the most widely used and universally accepted, its PVE value for this patient population is below that of the CSMC and the NTCTCS systems. However, given the relatively low PVE and C-index scores across all of the applicable staging systems, it is apparent that all staging systems used in this study are less than ideal in predicting survival in this dataset. Review of multiple studies that compare staging systems also result in relatively low PVE scores (Table 7), which suggest that while there are many staging systems to choose from, there is not one single staging system that stands out in predicting thyroid carcinoma survival rates (1 –6,22,27,42 –45). It is important to note that each staging system mentioned was developed using a specific database from each institution's patient population (or group of institutions, as in the NTCTCS system). While there are many common variables used in each model, each system provides a poor overall fit when applied to other patient groups. This is most apparent in the Yildirim study (27), where their proposed mathematical model is nearly identical to the CSMC staging system. However, when their model was applied to the CSMC DTC population, their PVE and C-index scores were among the lowest ranked. While the two patient populations were similar in many respects, including sex, age, cervical lymph node involvement, and multifocality, the Yildirim DTC population had a much higher mortality rate and more patients presenting with distant metastases. The Yildirim study also had a higher percentage of FTC patients and capsular and vascular invasion cases. As a result, their relatively small dataset had much more variation and a greater mortality, all of which resulted in a high PVE value in their study. When applied to the CSMC dataset, where a majority of patients are in the low-risk category with low mortality rates, the Yildirim model had low PVE values.
Mathematical model for predicting outcomes.
Staging systems originally applicable to PTC only.
Data not available (communication with author).
AGES, Age, histologic Grade, Extrathyroidal extent, and tumor Size; AIM, Mayo Clinic—Age, Invasion to blood vessels, Metastases; CIH, Cancer Institute Hospital (Tokyo, Japan).
Additionally, the PVE value will naturally be higher for any staging criteria with more classification categories due to the increase in the degrees of freedom, thus suggesting a higher, more predictive model (1 –6,22,27). It is also interesting that although the PVE has been used to evaluate staging criteria in other studies, it has failed to conclusively prove its utility in determining which staging system is the best across each patient population (1 –6,18,19). A majority of the studies that applied the PVE resulted in dramatically different PVE values and no one staging system was consistently recommended across each study. Consequently, the PVE may not be an adequate method in ranking these staging systems. As a result, we also computed the C-index as another comparison measure across staging systems. It is worth noting that using the C-index resulted in a slightly higher NTCTCS score when compared to the CSMC system, for both the DTC (0.77 and 0.76, respectively) and PTC (0.75 and 0.74, respectively) patient population. However, despite using the C-index, we were still unable to demonstrate any one staging system to be significantly improved over another. Nevertheless, many of the C-index scores were >0.7, which indicates a good overall model fit (41), whereas our PVE values were quite low, indicating that these staging systems are a poor fit for our data. We conclude that these staging systems are perhaps not as predictive of survival time as one would hope (1 –6,27,42 –45). Moreover, with DTC's high survival rate due to a majority of patients being in the low-risk category, the vast majority of observed cases are censored observations, making it difficult to mathematically model death. As a result, data sets with a low number of patients and higher mortality rates will generate higher PVE values than larger data sets with relatively few deaths as was seen in our study.
Given that many of these staging systems were also developed many years ago using similar combinations of risk factors with comparable outcomes, the systems still encounter the same limitations and challenges. In the future, the addition of other prognostic factors may result in staging systems that will better differentiate between low- and moderate-risk populations (44,45). For example, the addition of biological markers, which are found in more aggressive DTC variants such as DNA ploidy (30,46 –50), BRAF mutations (48,49), CA 19-9 (50), and proliferating cell nuclear antigen (48,21,51), may aid in survival prediction.
This study has some limitations, including a selection bias, where a majority of the population are patients of our Thyroid Cancer Center, where physicians are more likely to screen for nodules, goiters, and other thyroid abnormalities. As a result, patients with thyroid microcarcinomas (≤1 cm) are more often diagnosed, leading this population to have a higher survival rate. The treatment of our patients has generally been consistent with the recommendations published by the American Thyroid Association (ATA) (52). In recent years, we have treated fewer patients with low-risk DTC with RAI than was done in the past (53). Although we did not re-examine the histology of each case, we did review the surgical and pathology reports in detail to classify patients into PTC or FTC categories.
In addition to the ATA guidelines, there are multiple other guidelines on DTC management, with some differences in recommendations (54 –58). Thus, there can be much variation between institutions (59,60). As a result, a proficiency bias also exists in comparing PVE values across each study, since it is not possible to review how each institution treated their patients (61,62). This can result in differing survival rates depending on how each institution treats their DTC patients. While it is important to consider the stage of thyroid carcinoma patients in predicting survival rates and to facilitate management of the disease, it is difficult to treat patients based solely on their stage due to varying factors, such as extent of surgery, surgical expertise, and existing comorbidities, as well as patient preference on their treatment plan. Therefore, it is of utmost importance to work with a multidisciplinary team of experts to determine the most successful way to treat each individual patient to optimize disease-free survival.
Footnotes
Disclosure Statement
The authors declare that no competing financial interests exist.