
Abstract
Background:
Thyroid ultrasound (US) elastography provides an estimation of tissue stiffness and is helpful to differentiate malignant from benign lesions. Tissue proprieties and molecules causing stiffness are not established. The aim of the study was to correlate US elastography findings with tissue properties in thyroid nodules.
Methods:
A total of 115 thyroid nodules from 112 patients who underwent surgery for the presence of Thy 3 (indeterminate) cytology (n = 67), Thy 4–5 (suspicious—indicative of carcinoma) cytology (n = 47), or large goiter in the presence of Thy 2 cytology (n = 1) and suspicious US features were examined by US elastography. Tissues obtained after surgery were characterized for cell number, microvessel density, fibrosis, and expression of galectin-3 (Gal-3) and fibronectin-1 (FN-1).
Results:
Low elasticity on qualitative US elastography (LoEl) was found in 66 nodules (one benign and 65 carcinomas); high elasticity (HiEl) was found in 49 nodules (46 benign and three carcinomas; p < 0.0001). Quantitative analysis, performed in 24 nodules and expressed as elastic ratio between the strain of the nodule and that of the surrounding thyroid parenchyma, showed a mean of 1.90 (interquartile range [IQR] 1.18–2.77) in 14 nodules with LoEl, and a mean of 1.01 (IQR 0.91–1.10) in 10 nodules with HiEl (p = 0.002). Stiffness did not correlate with cell number and was inversely correlated with microvessel density. Fibrosis was higher in nodules with LoEl than in those with HiEl (p = 0.009) and in carcinomas than in benign nodules (p = 0.02). Fibrosis was higher in nodules with high expression of Gal-3 (p < 0.001) and FN-1 (p = 0.004). Fibrosis and expression of Gal-3 and FN-1 were higher in the classic compared with the follicular variant of papillary thyroid carcinoma and lower in follicular adenomas.
Conclusions:
Low elasticity at US elastography is highly correlated with malignancy. Nodule stiffness is correlated with fibrosis and expression of Gal-3 and FN-1. These features are more evident in the classic than in the follicular variant of papillary thyroid carcinoma.
Introduction
N
Cytological examination of material obtained by fine-needle aspiration (FNA), due to its high sensitivity and specificity, is the best single test for differentiating malignant from benign thyroid lesions (5). The major limitations of FNA cytology are the occurrence of nondiagnostic (10–15%) and indeterminate (10–20%) cytology (6,7).
The newly developed US elastography has been applied to study the stiffness/elasticity of nodules, with the purpose of differentiating malignant from benign lesions. As for thyroid cancer, a low elasticity on US elastography showed a high predictive value in the assessment of malignancy (8,9). The reliability of US elastography has been confirmed by several authors, and it has recently been reviewed in a meta-analysis (10). Interestingly, US elastography maintains its high predictive value in thyroid nodules with indeterminate cytology in a range of series (11 –16). Hence, US elastography can be considered an additional diagnostic tool for the management of indeterminate thyroid lesions (2,3). The results obtained with real-time US elastography were confirmed by quantitative elastographic techniques, such as strain index, acoustic radiation force impulse, and supersonic shear wave (17,18).
The tissue proprieties that link stiffness to cancer in thyroid nodules are unknown. Theoretically, an increased cell number and/or fibrosis could account for nodule stiffness. An increased expression of molecules involved in cell-to-cell and cell-to-matrix adhesion as well as in fibrosis has been described in thyroid neoplasia. In addition, some of them, such as Gal-3 (19 –23) and HBME-1 (24 –26) have also been employed as cytochemical tumor markers. To validate real-time US elastography as a robust new technique for the assessment of malignancy in thyroid nodules, this study compared real-time qualitative with quantitative US elastography in a series of patients and analyzed tissue proprieties in surgical samples that could correlate with nodule stiffness such as cell number, microvessel density, degree of fibrosis, and expression of Gal-3 and FN-1.
Patients and Methods
Patients
In the period January to March 2012, patients with one or two nodules in the absence of confounding factors such as thyroiditis, multinodularity with coalescent nodules, and macrocalcifications underwent US elastography. Among them, 112 patients (M age = 44 ± 13 years; range 8–74 years; 78 females) in whom surgery was indicated for Thy 3 cytology (n = 67), Thy 4–5 cytology (n = 47), or large goiter in the presence of Thy 2 cytology (n = 1) and suspicious US features (1,2) were selected for this study. Three patients had two nodules with Thy 3 cytology. Thus, a total of 115 nodules were included in the study. Nodular volume (M ± standard deviation [SD]) was 4.6 ± 9.76 mL. Patients gave their consent to participate in the study, allowing molecular analysis of biological material. All patients were euthyroid in the absence of circulating thyroid autoantibodies and had undetectable serum calcitonin measured with immunoradiometric assay (CIS BIO International, Gif-sur-Yvette, France; normal values <10 ng/mL).
FNA cytology
FNA was performed under US guidance using a 23-gauge needle attached to a 10 mL syringe. The material was air-dried, stained with Papanicolaou and Giemsa, and interpreted by two experienced cytologists (D.G. and M.I.). The adequacy of aspirates was defined according to the guidelines of the Papanicolaou Society (27). Results of cytology were reported according to the Italian Consensus (28).
Histological diagnosis and morphological features
Histological diagnoses were made with standard procedure (hematoxylin and eosin), according to the World Health Organization 2004 system (29), and confirmed independently in a blinded fashion by three pathologists (A.P., L.T., and F.B.). Tumor fibrosis was expressed as the percentage of dense connective tissue with respect to the tumor cell–occupied area in the whole nodule (two to five slides) and expressed both as M ± SD and as median with interquartile range (IQR). To evaluate the number of cells, the slides were observed under a standard Nikon TS100F microscope (Nikon Instruments, Florence, Italy) connected to a digital video system. Using a 40× magnification lens, three fields representative of the whole nodule were sampled randomly and photographed using an MMI GmbH digital microphotography system (Nikon Instruments). Cells were counted by an image analysis using the Nis Elements AR software (Nikon Instruments) and reported as M ± SD.
To evaluate tumor microvessel density, tissue sections were immunostained with an anti-CD34 primary antibody using an automated Benchmark IHC staining system (Ventana, Tucson, AZ). The immunostained slides were observed under a 40× magnification lens with a standard microscope connected to a digital video system, as described above. Three representative fields with the highest vascularity were chosen for each sample and photographed, as previously described. Results were reported as the area occupied by the microvessel (μm2/field, M ± SD). A.P., F.B., and L.T. who performed cytology, pathology, and evaluation of cell number, microvessel density, and fibrosis were unaware of the US elastography data.
RNA purification and complementary DNA synthesis
After standard deparaffinization, formalin-fixed and paraffin-embedded (FFPE) thyroid tissue sections (5 μm) were enriched by manual microdissection. Next, RNA was extracted and purified from the FFPE tissue sections using the RNeasy FFPE kit (Qiagen GmbH, Hilden, Germany). RNA integrity was assessed by spectrophotometry (NanoDrop ND-1000 Technologies, Wilmington, DE).
Semi-quantitative real-time reverse-transcription polymerase chain reaction
Gal-3 and FN-1 mRNA quantification was performed using the real-time quantitative polymerase chain reaction (PCR) Rotor Gene Sybr Green PCR kit (Qiagen) on a Rotor Gene 6000 (Qiagen) instrument. Quanti tect primer assays (Qiagen) were used for Gal-3 (NM_001177388, NM_002306, NM_194327), FN-1 (NM_002026, NM_212474, NM_212475, NM_212476, NM_212478, NM_212482), and beta-actin (NM_001101) as an internal control. Pooled normal thyroid tissues were used as external control. The comparative threshold cycle (Ct) method, defined as 2–ΔΔCt, was used for calculation of fold amplification of each sample versus external control. Each experiment was evaluated with three PCR reactions. Data are presented as M ± SD. Gal-3 and FN-1 mRNA expression of each sample was normalized by calculating the z-score obtained by subtracting the population mean and dividing by the standard deviation. The converted z-scores were then aggregated into one large set, identifying two different categories: low expression (negative z-score) and high expression (positive z-score). R.G. and N.B., who measured the expression of FN-1 and Gal-3, were unaware of the US elastography data as well as the cytology and pathology data.
Thyroid US elastography
Thyroid US elastography was performed using a real-time instrument (MyLab™70; Esaote SPA, Florence, Italy) with a linear transducer (8–13 MHz). The qualitative analysis of US elastography was performed using the methodology previously described (9,11). In nodules with high elasticity (HiEl), the green color was clearly dominant and classified as likely benign. In nodules with intermediate elasticity, the pattern of color distribution was inhomogeneous, with both green and blue color represented and classified as suspicious. In nodules with very low elasticity, the blue color was clearly predominant and classified as likely malignant. Nodules with intermediate and low elasticity were grouped and classified as nodules with low elasticity (LoEl).
For the quantitative analysis, the operator used had an electronic box, which included the selected nodule and an adequate amount of surrounding parenchyma. Two regions of interest—one corresponding to the nodule and one to the softest area of normal parenchyma—were identified on elastogram. The elastic ratio (ER) between the strain of the nodule and the surrounding thyroid parenchyma was calculated automatically by the software. During the study, ER became available and the results of the two techniques were compared as a secondary endpoint of the study. Unfortunately, the majority of patients had already been surgically treated, and only 24 nodules were available for this comparison. US elastography was performed by T.R., M.S., and V.L. before FNA. In vivo examination was performed by two examiners. Static and moving images were also recorded to be reviewed by the third examiner. The agreement on the US elastography scoring among the three examiners was >90%.
Statistical analysis
Proportions and frequencies in the group of patients were compared using the chi-square test and Fischer's exact test, when appropriate. The Kolmogorov–Smirnov test was employed to test the normality of data distribution. Student's t-test and Mann–Whitney U-test were used to detect difference between groups for normal and skewed variables, respectively. A p-value of ≤0.05 was considered statistically significant. Statistical analyses were performed using SPSS Statistics for Windows v10.0 (SPSS Inc., Chicago, IL). Receiver operation characteristic curve analyses were performed to identify the ER cutoff that better discriminated between carcinomas and benign nodules in term of sensitivity and specificity (i.e., highest Youden index).
Results
Cytology and histology
Among the 67 nodules with Thy 3 cytology, 20 (31%) were papillary carcinomas on histology (14 follicular variant, 6 classic variant) and one was a minimally invasive follicular thyroid carcinoma. The remaining 46 (69%) were benign: 37 were follicular adenomas, two hyperplastic nodules, and seven follicular adenomas with foci (<5 mm) of papillary carcinoma (Table 1).
CVPC, classic variant of papillary carcinoma; FVPC, follicular variant; TCPC, tall-cell variant of papillary carcinoma; MIFC, minimally invasive follicular carcinoma; FA, follicular adenoma; HN, hyperplastic nodule; AFPC, adenoma with foci of papillary carcinoma.
Among the 47 nodules with Thy 4–5 cytology, 46 (98%) were papillary thyroid carcinomas (29 classic variant, 10 follicular variant, and 7 tall-cell variant); one nodule was hyperplastic.
The large nodule with Thy 2 cytology was a follicular variant of papillary carcinoma on histology (Table 1).
US elastography
HiEl at real-time US elastography was found in 49 cases (46 benign lesions and 3 carcinomas); LoEl was observed in 66 cases (65 carcinomas and 1 benign nodule; Fig. 1). Thus, low elasticity was highly predictive of malignancy (p < 0.0001). The median ER was 1.90 (IQR 1.18–2.77) in 14 nodules with LoEl, and 1.01 (IQR 0.91–1.10) in 10 nodules with HiEl (p = 0.002). The ER cutoff of 1.1 identified carcinomas with a sensitivity of 86% (12/14) and benign nodules with a specificity of 90% (9/10). The negative predictive value (NPV) was 82%, and the positive predictive value (PPV) 92% (Fig. 2).
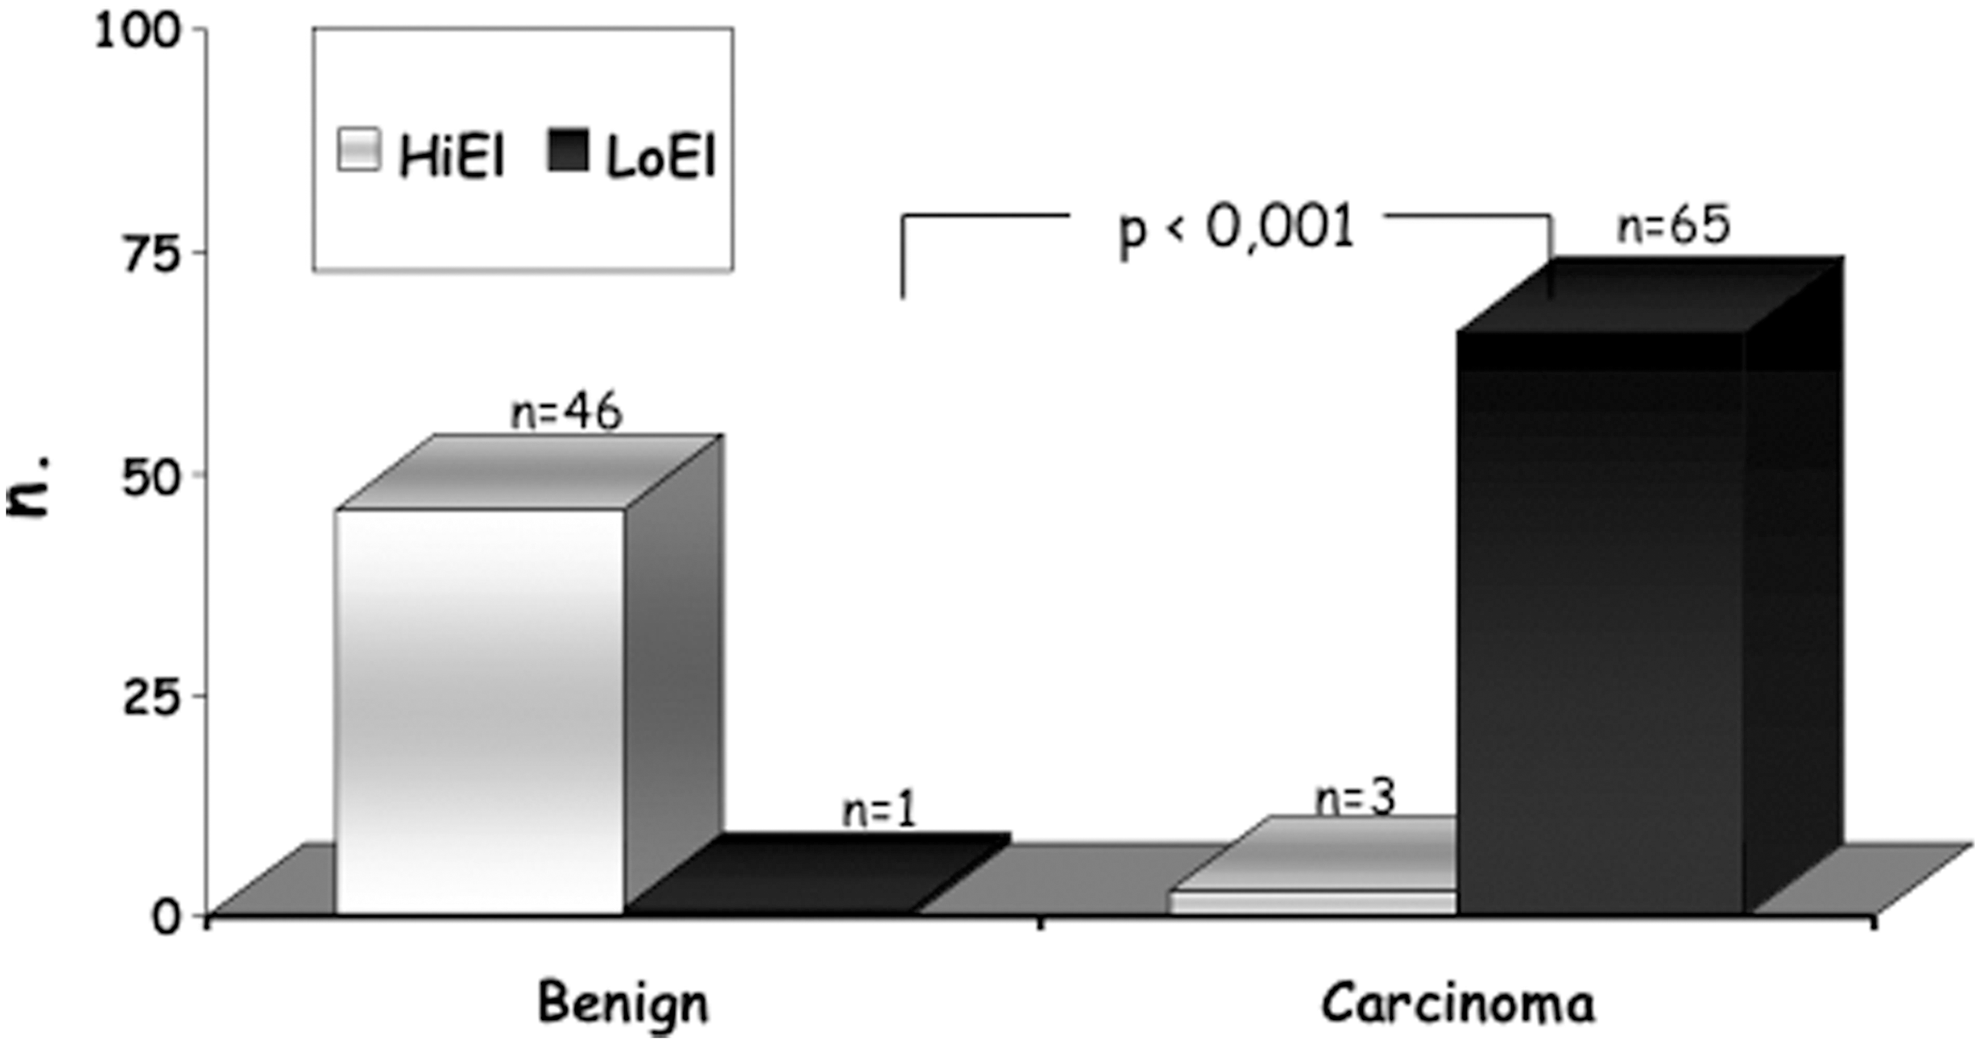
Elasticity of thyroid nodule in relation to the final histology of benign lesion (BN) or carcinoma (CA). High elasticity (HiEl), open square (□); low elasticity (LoEl), closed square (■).
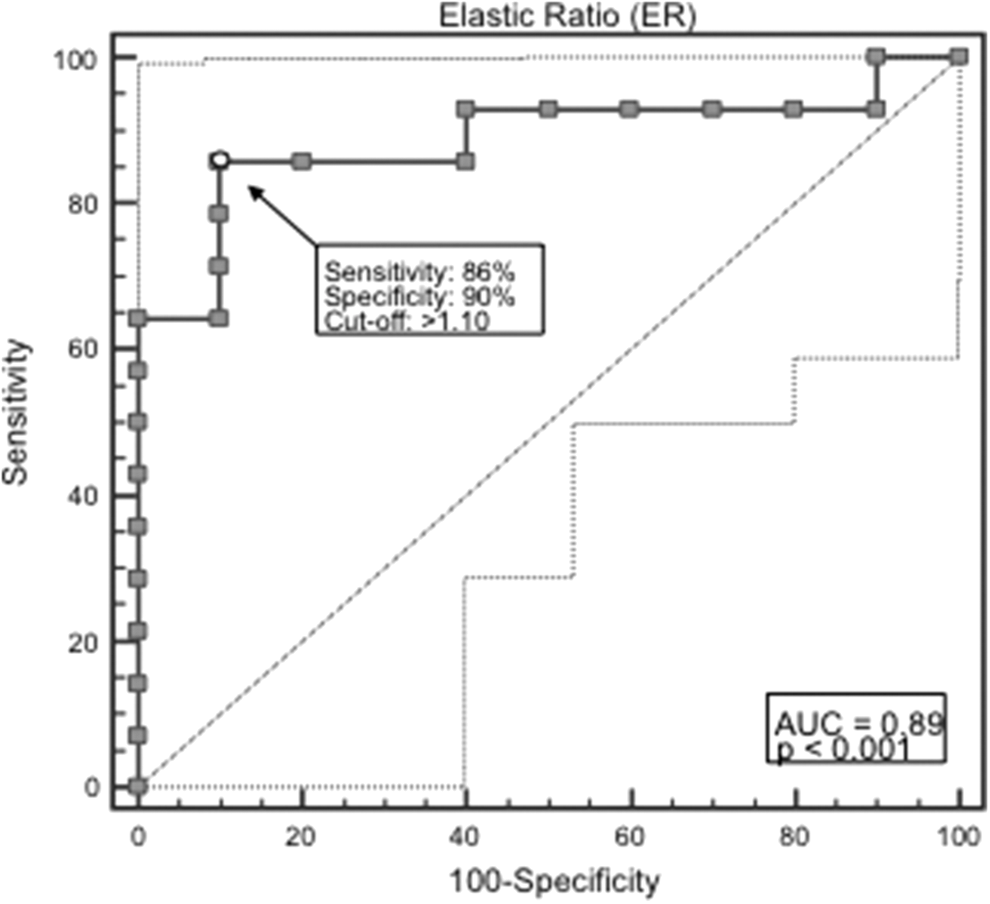
Receiver operating characteristic curve describing sensitivity and specificity of quantitative US elastography. The elastic ratio (ER) was a median of 1.90 (interquartile range [IQR] 1.18–2.77) in 14 nodules with LoEl, and 1.01 (IQR 0.91–1.10) in 10 nodules with HiEl (p = 0.002). The ER cutoff of 1.1 identified carcinomas with a sensitivity of 86% (12/14) and benign nodules with a specificity of 90% (9/10), with a negative predictive value of 82% and a positive predictive value of 92%.
Correlation between US elastography and cellularity, microvessel density, degree of fibrosis, and expression of Gal-3 and FN-1
Cell number did not correlate with elasticity: a median of 334 (IQR 289–408) cells/field in nodules with HiEl, and 308.5 (IQR 255–366.5) cells/field in nodules with LoEl (p = 0.12). On the other hand, microvessel density inversely correlated with elasticity: a median of 168.2 (IQR 125.7–217) μm2/field in nodules with HiEl, and 108.6 (IQR 92.4–158.5) μm2/field in those with LoEl (p < 0.001).
The degree of fibrosis inversely correlated with elasticity: a median of 5 (IQR 0–10) median and IQR) in nodules with HiEl, and 10 (IQR 0–30) in nodules with LoEl (p = 0.009).
Among the 49 nodules with HiEl, two had high and 47 low expression of Gal-3, while out of the 66 nodules with LoEl, 37 had high and 29 low expression of Gal-3 (p < 0.001). All 49 nodules with HiEl had low expression of FN-1, while of the 66 nodules with LoEl, 27 had high and 39 low expression of FN-1 (p < 0.001; Table 2). Thus, with regard to the finding of LoEl, low expression of Gal-3 had a NPV of 95.9%, while high expression of Gal-3 had a PPV of 94.8%. Low expression of FN-1 had a NPV of 100%, while high expression of FN-1 had a PPV of 40.9%.
NPV 95.9%; PPV 94.8%.
NPV 100%; PPV 40.9%.
US, ultrasound; Gal-3, galectin-3; FN-1, fibronectin-1; IQR, interquartile range; HiEl, high elasticity; LoEl, low elasticity.
Correlation between histology and cellularity, microvessel density, degree of fibrosis, and expression of Gal-3 and FN-1
While cell number did not differ between benign nodules (median = 333.5 cells/field; IQR 284–408 cells/field; p = 0.15) and carcinomas (median = 309 cells/field; IQR 256–371 cells/field), microvessel density was higher in benign nodules (median = 173.1 μm2/field; IQR 129–223.6 μm2/field) than it was in carcinomas (median = 108.8 μm2/field; IQR 92.4–157.6 μm2/field; p < 0.001). The degree of fibrosis was higher in carcinomas (median = 10; IQR 0–30) than it was in nodules with benign histology (median = 5; IQR 0–10; p = 0.02). Among the 47 benign nodules, one had high and 46 low expression of Gal-3, while out of the 68 carcinomas, 38 had high and 30 low expression of Gal-3 (p < 0.001). All 47 benign nodules had low expression of FN-1, while among 68 carcinomas, 27 had high and 41 low expression of FN-1 (p < 0.001; Table 3). Fibrosis was a median of 20 (IQR 3–40) in nodules with high expression of Gal-3, and 5 (IQR 0–10) in those with low expression of Gal-3 (p < 0.001). Fibrosis was a median of 20 (IQR 3–40) in nodules with high expression of FN-1, and 5 (IQR 0–12.5) in those with low expression of FN-1 (p = 0.004; data not shown). Thus, with regard to the histological diagnosis of carcinoma, low expression of Gal-3 had a NPV of 97.8%, while high expression of Gal-3 had a PPV of 55.8%. Low expression of FN-1 had a NPV of 100%, while high expression of FN-1 had a PPV of 39.7%.
NPV 97.8%; PPV 55.8%.
NPV 100%; PPV 39.7%.
BN, benign nodule; CA, carcinoma.
US elastography, cellularity, microvessel density, and degree of fibrosis in the classic and the follicular variant of papillary thyroid carcinoma and in follicular adenoma
Out of the 35 classic variant of papillary thyroid carcinoma, one had HiEl and 34 LoEl, while out of the 25 follicular variant cases, two had HiEl and 23 LoEl (p < 0.001). In contrast, all 37 follicular adenomas had HiEl. Cell number was a median of 334 (IQR 289–408) cells/field, in follicular adenomas, 336 (IQR 244–474) in the follicular variant of papillary thyroid carcinoma, and 309 (IQR 256–349) in the classic variant (p = 0.15). Microvessel density was a median of 182.5 μm2/field (IQR 148.7–230.2 μm2/field), 115.5 μm2/field (IQR 92.4–200.4 μm2/field) in the follicular variant of papillary thyroid carcinoma, and 107.7 μm2/field (IQR 92.6–105.5μm2/field) in the classic variant (p = 0.001). The degree of fibrosis was a median of 5 (IQR 0–10) in follicular adenomas, 5 (IQR 0–20) in the follicular variant, and 17.5 (IQR 2–30) in the classic variant of papillary carcinoma (p = 0.01). In addition, high expression of both Gal-3 and FN-1 was found more often in the classic variant than it was in the follicular variant of papillary thyroid carcinomas and almost never in the follicular adenomas, with only 1/37 showing high expression of Gal-3 (Table 4).
ER was measured in a total number of 16 nodules of this subgroup. The number of nodules in each histological category is reported in parentheses.
ER, elastic ratio.
Discussion
Real-time US elastography has been shown to be a useful diagnostic tool in the management of thyroid nodules, with high elasticity having a high NPV for thyroid carcinoma, even in indeterminate nodules (9,11). The results obtained by real-time elastography were confirmed by methods providing an objective measurement of tissue stiffness such as strain index, acoustic radiation force impulse, and supersonic shear wave (17,18).
The aim of this study was to compare qualitative real-time US elastography with quantitative US elastography and to correlate US elastography findings with tissue properties associated with stiffness/elasticity of thyroid nodules. An optimal correlation between nodule stiffness and thyroid cancer was confirmed. The elasticity was measured both by qualitative real time and by quantitative US elastography, and data obtained by the two methods were highly correlated, thus validating the qualitative measurements and strengthening the value of this technique. The reason why tissue stiffness is correlated with malignancy is unknown. It is hypothesized that the number of cells, the microvessel density, and the degree of fibrosis could be factors involved in the stiffness/elasticity of thyroid nodules.
Stiffness did not correlate with cell number, while it was inversely correlated with the microvessel density and positively associated with fibrosis. A similar cell number in benign adenomas compared to papillary thyroid cancer is not surprising given that both lesions show histological features with high cellularity and low colloid content. On the other hand, the inverse relationship with the microvessel density was unexpected. Indeed, malignant lesions are supposedly characterized by high vascularization. The number of vessels, but not the area of vascular surface, was found to be higher in benign lesions compared to carcinoma (30). On the other hand, tumor microvessel density has been reported to be directly associated with recurrence in differentiated thyroid cancer (31). Proietti et al. found that follicular adenomas had more extensive intratumoral hemorrhage and peripheral vascularization (32). Results obtained by in vivo determination of vascularization with color Doppler US (2,3) are contradictory and not suggestive for a difference between benign and malignant thyroid nodules (33). The present results suggest that malignant nodules are characterized by a higher fibrosis/microvessel density ratio compared with benign lesions.
The activation of the fibrotic process has been described in cancers occurring in several tissues and in thyroid cancers as well (34,35). The development of fibrosis is related to an aberrant activation of myofibroblasts that play a crucial role in tumor progression (36). In several tissues, an increased risk of cancer progression has been linked to the stromal collagen content. Several factors are involved in this process, including transforming growth factors, which induce differentiation of fibroblasts to myofibroblasts (36). In the present study, the degree of fibrosis was strictly correlated with the stiffness at US elastography. In addition, both stiffness and fibrosis were correlated with malignancy. Therefore, these results highlight that the higher expression of fibrosis in thyroid cancer is the link between malignancy and stiffness on US elastography, as well as hardness on physical examination (1,3).
After the finding of the role of fibrosis, evaluated by histology, the correlation between stiffness and some molecules involved in fibrosis and in the processes of cell-to-cell and cell-to-matrix adhesion was investigated. Low elasticity was correlated with a high expression of Gal-3 and FN-1. In several studies, an increased expression of Gal-3 has been related to malignant transformation, tumor progression, and metastasis (21 –24). In addition, Gal-3 has been proposed as a thyroid tumor marker because its expression has been found to be increased in FNA material as well as in histological samples of thyroid carcinomas (22,25). FN-1, an extracellular matrix protein produced by fibroblasts, has been associated with malignancy (34,35,37) in several tissues. A high expression of FN-1 in thyroid carcinomas has been reported by several but not all series (36,38,39). FN-1 is also expressed in fibrous tissue and basement membrane of goiters (32). In the present series of thyroid nodules, a high expression of both Gal-3 and FN-1 was associated with fibrosis and malignancy. Interestingly, the NPV for nodule stiffness of the low expression of both Gal-3 and FN-1 was higher than the PPV of high expression of both molecules, in agreement with the observation that the NPV for malignancy is much higher than its PPV of high expression of both molecules (9).
In summary, the present data indicate that compared with benign nodules, thyroid carcinomas have a similar number of cells, lower microvessel density, and higher degree of fibrosis. When the results obtained in nodules were examined grouped according to the histological subtype, it was observed that the microvessel density was lower in the classic variant, intermediate in the follicular variant of papillary carcinomas, and higher in follicular adenomas. In contrast, the degree of fibrosis, as well the expression of Gal-3 and FN-1, were the highest in the classic variant, intermediate in the follicular variant, and lowest in the follicular adenomas.
In conclusion, the present results confirm that nodule stiffness on US elastography is highly indicative of malignancy, and show that real-time qualitative elastography correlates well with quantitative elastography. The study also shows with a morphological approach that stiffness in thyroid nodules is inversely correlated with the microvessel density and directly correlated with fibrosis. Higher expression of molecules involved in the processes of fibrosis and cell-to-cell and cell-to-matrix adhesion such as Gal-3 and FN-1 are related to nodule stiffness and malignancy. These features characterize the classic variant versus the follicular variant of papillary thyroid carcinoma. More studies are needed to understand the processes that cause stiffness in thyroid cancer better.
Footnotes
Author Disclosure Statement
The authors have nothing to disclose.