
Abstract
Background:
In 2007 and 2015, two studies were conducted in Ribeirão Preto, São Paulo, Brazil, on schoolchildren of both sexes attending schools of three different socioeconomic levels (school 1: low; school 2: middle; school 3: high).
Methods:
Iodine concentrations were measured in samples of kitchen salt from the home provided by the schoolchildren and in urine samples, and these levels were compared to the thyroid volume by clinical assessment.
Results:
In 2007, a marked discrepancy in iodine concentrations was found in salt samples in 300 schoolchildren of both sexes (age range 8–10 years). Urinary iodine excretion >100 μg/L was detected in all cases, and 55.2% had concentrations of >300 μg/L (considered to be the upper limit by the World Health Organization). There was no increase in thyroid volume among the schoolchildren. In 2015, after a change in the norms for salt iodination from 20–60 to 15–45 mg/kg, the study was repeated in 295 schoolchildren (age range 8–10 years) from the same three schools studied previously. An improved standardization of iodine concentration was observed in the salt samples provided by the children, as well as a significant reduction in ioduria, with 10.9% of the samples showing an iodine concentration of <100 μg/L and with a reduction to 30.5% of samples with >300 μg/L. An increase in thyroid volume was also observed in a greater proportion of children from school 1, with a 7.92%, 5.19%, and 0.85% prevalence of goiter at schools 1, 2, and 3, respectively.
Conclusions:
Despite the limitations of the present study, which include sample size and thyroid evaluation by palpation, it is inferred that the iodination of the Ribeirão Preto schoolchildren studied is adequate. However, the individual iodine intake of some students was <100 μg/L, and some students also had an increased thyroid volume, raising the possibility of a deterioration of iodine intake in 2015 compared to 2007.
Introduction
The thyroid gland, which has a highly organized structure, is the first endocrine gland to develop in human embryos. This gland can synthesize and store its secretion products, the thyroid hormones triiodothyronine (T3) and thyroxine (T4), iodinated compounds that are important for the development of quality of life (1).
Iodine is a micronutrient present in the human body in very small quantities (0.02285 × 10⁻³%) in relation to adult body weight (2,3). Iodine corresponds to 65% of the molecular weight of T4 and to 58% of the molecular weight of T3. The daily iodine intake recommended by the World Health Organization (WHO), the United Nations Children's Fund (UNICEF), and the International Council for the Control of Iodine Deficiency Disorders (ICCIDD) is as follows: 50 μg for neonates (up to 12 months), 90 μg for children aged 13 months to six years, 120 μg for schoolchildren (7–12 years), 150 μg for adults (>13 years), and 250 μg for pregnant and nursing women.
The adequate level of urinary iodine concentration, as proposed by the WHO, is 100–200 μg/L for persons older than seven years of age (4,5).
To guarantee adequate iodine consumption, governmental policies have been adopted to promote the addition of iodine to industrialized kitchen salt (6). In Brazil, salt iodization has been implemented throughout the national territory since 1956 (7). While the WHO recommends the intake of a maximum of 5 g of salt per day, Brazilians consume up to 10 g per day (8,9).
To reduce the prevalence of thyroid dysfunction in Brazil, in 2013, the regulatory government agency, the National Agency of Sanitary Surveillance (ANVISA), reduced the amount of iodine in salt for domestic consumption from 20–60 to 15–45 mg iodine/kg salt (10,11).
In 2007, a study was conducted in Ribeirão Preto comparing iodine concentration in salt samples provided by schoolchildren, iodine excretion, and thyroid volume measured by ultrasound (12). In 2015, following the introduction of new regulations, a similar study was repeated at the same three schools, with the determination of iodine concentrations in samples of salt for domestic consumption and in urine samples from the schoolchildren, and with evaluation of the thyroid volume by palpation of the gland.
The objective of the present study was to compare iodine concentrations in samples of salt provided by schoolchildren and their ioduria levels to their thyroid volume determined in 2007 and 2015.
Methods
A total of 295 schoolchildren of both sexes were studied, ranging in age from eight to 10 years and attending the same three Ribeirão Preto public schools previously studied in 2007, which were the most representative of three different socioeconomic levels (based on family income, number of dwellers per residence, and access to health and educational services) according to the Education Secretary Office (12) as follows: School 1: lower socioeconomic level, 101 students (62 boys and 39 girls); School 2: intermediate socioeconomic level, 77 students (39 boys and 38 girls); School 3: higher socioeconomic level, 117 students (52 boys and 65 girls).
The Ethics Committee of UNAERP authorized this project (Project “Plataforma Brasil”—CAAE 37604700005498), and all the individuals responsible for the enrolled students gave written informed consent to participate.
Anthropometric data were obtained according to the method of Gordon et al. (13).
A total of 295 samples of salt for domestic consumption were obtained and measured by titration (14,15). Casual urine samples (n = 295) were obtained, and iodine excretion was determined according to the methods of Sandell and Koltoff after urine digestion with ammonium persulfate (16,17). These analyses were carried out in the same laboratory and by the same technician using the same technique as in 2007 and 2015.
Thyroid volume was assessed by palpation by a single examiner and classified as follows: T1, not visible and not palpable; T2, not visible but palpable; and T3, visible and palpable. The glands were considered to be enlarged if their volume exceeded that of a finger pad (2.5–3.0 cm high and approximately 1.0–1.5 cm wide, with an estimated thyroid volume of 2.5–3.5 cm3).
Statistical analysis
Sample counts, mean values, and standard deviations were obtained using Microsoft® Excel 2013 software.
Analysis of variance (ANOVA) of body surface and iodine concentrations in urine samples was carried out using the Kruskal–Wallis test followed by Dunn's post hoc test for multiple comparisons to evaluate the three schools in 2007 and 2015 (18).
The normal distribution of ioduria values was determined using the D'Agostino and Pearson omnibus normality test, the Shapiro–Wilk normality test, and the KS normality test (GraphPad Prism v6.01 for Windows; GraphPad Software, La Jolla, CA). The analysis revealed a non-normal distribution. Therefore, median ioduria values are reported.
The coefficient of variation (%CV) of ioduria for each school in 2007 and 2015 was also calculated (19,20).
In 2007, thyroid volumes were analyzed by ANOVA, and the three schools were compared using the t distributions. In 2015, the thyroid volumes were analyzed by the Kruskal–Wallis test followed by Dunn's post hoc test for multiple comparisons. Correlations between thyroid volume and urinary iodine concentration were determined by the Pearson correlation test in both 2007 and 2015 (21).
All analyses and graphs for the comparative ioduria values of 2007 and 2015 were generated using GraphPad Prism v6.01 for Windows.
Results
The mean body surface values of the schoolchildren from the three schools did not differ significantly across age or sex when the groups from 2007 and 2015 were compared (p = 0.10).
The iodine concentration in the industrialized salt samples for domestic consumption (mg/kg) were more uniform in 2015 and were within the range recommended by ANVISA. Iodine concentrations varied from 8.42 mg/kg at school 2 to 125 mg/kg at school 3 in 2007 and from 23.36 mg/kg at school 1 to 39.86 mg/kg at school 2 in 2015. The difference in mean iodide concentration in salt samples was not statistically significant in 2007 but was significant in 2015, indicating a difference in mean iodide concentration in salt samples at each school in the latter year, which was lower in school 1 and higher in school 3, although the distribution of iodide content was normal in each school. The mean iodine concentrations/kg salt in 2007 and 2015 are shown in Table 1.
Iodine Concentration in Samples of Kitchen Salt for Domestic Consumption (mg/kg) Obtained at Three Schools in 2007 and 2015
School 1: statistically nonsignificant difference between 2007 and 2015 (p = 0.318).
School 2: statistically significant difference between 2007 and 2015 (p = 0.001).
School 3: statistically significant difference between 2007 and 2015 (p < 0.001).
2007: statistically nonsignificant difference between schools 1, 2, and 3 (p = 0.79).
2015: statistically significant difference between schools 1, 2, and 3 (p < 0.001).
The urinary iodine concentrations (μg/L) determined in 2015 are shown in Table 2. ANOVA indicated no significant difference in median ioduria levels between students across schools (p = 0.129) (20).
Mean and Median Ioduria Values and Pearson Correlation Coefficient Between 2007 and 2015 Ioduria Values
CV, coefficient of variation.
The differences in median ioduria levels were statistically significant across time points (p < 0.001 for school 1; p < 0.003 for school 2; p < 0.001 for school 3) and across schools (p < 0.001; Tables 2 and 3).
Ioduria Ranges (μg/L) and Number of Cases in each School in 2007 and 2015
Ioduria data obtained for each school in 2007 and 2015 are shown in Table 2. For non-normal data, the %CV is the 75% ratio of the interquartile range and the median, indicating how the data are spread around the median. The %CV for the 2015 ioduria data was higher than the values for 2007, possibly due to the occurrence of cases with very low ioduria, the occurrence of cases with very low ioduria, and the presence of elevated values (Table 2).
In 2015, at school 1, 12/101 (11.88%) students had ioduria levels <100 μg/L, and the ioduria peak shifted from 350–450 μg/L to 200–300 μg/L urine (Tables 2 and 3 and Fig. 1). At school 2, 7/77 (9.09%) students had ioduria levels <100 μg/L, and the ioduria peak shifted from 300–400 μg/L to 250–350 μg/L urine (Tables 2 and 3 and Fig. 2). At school 3, 12/177 (6.05%) students had ioduria levels <100 μg/L, and the ioduria peak shifted from 250–350 μg/L to 200–250 μg/L urine (Tables 2 and 3 and Fig. 3).
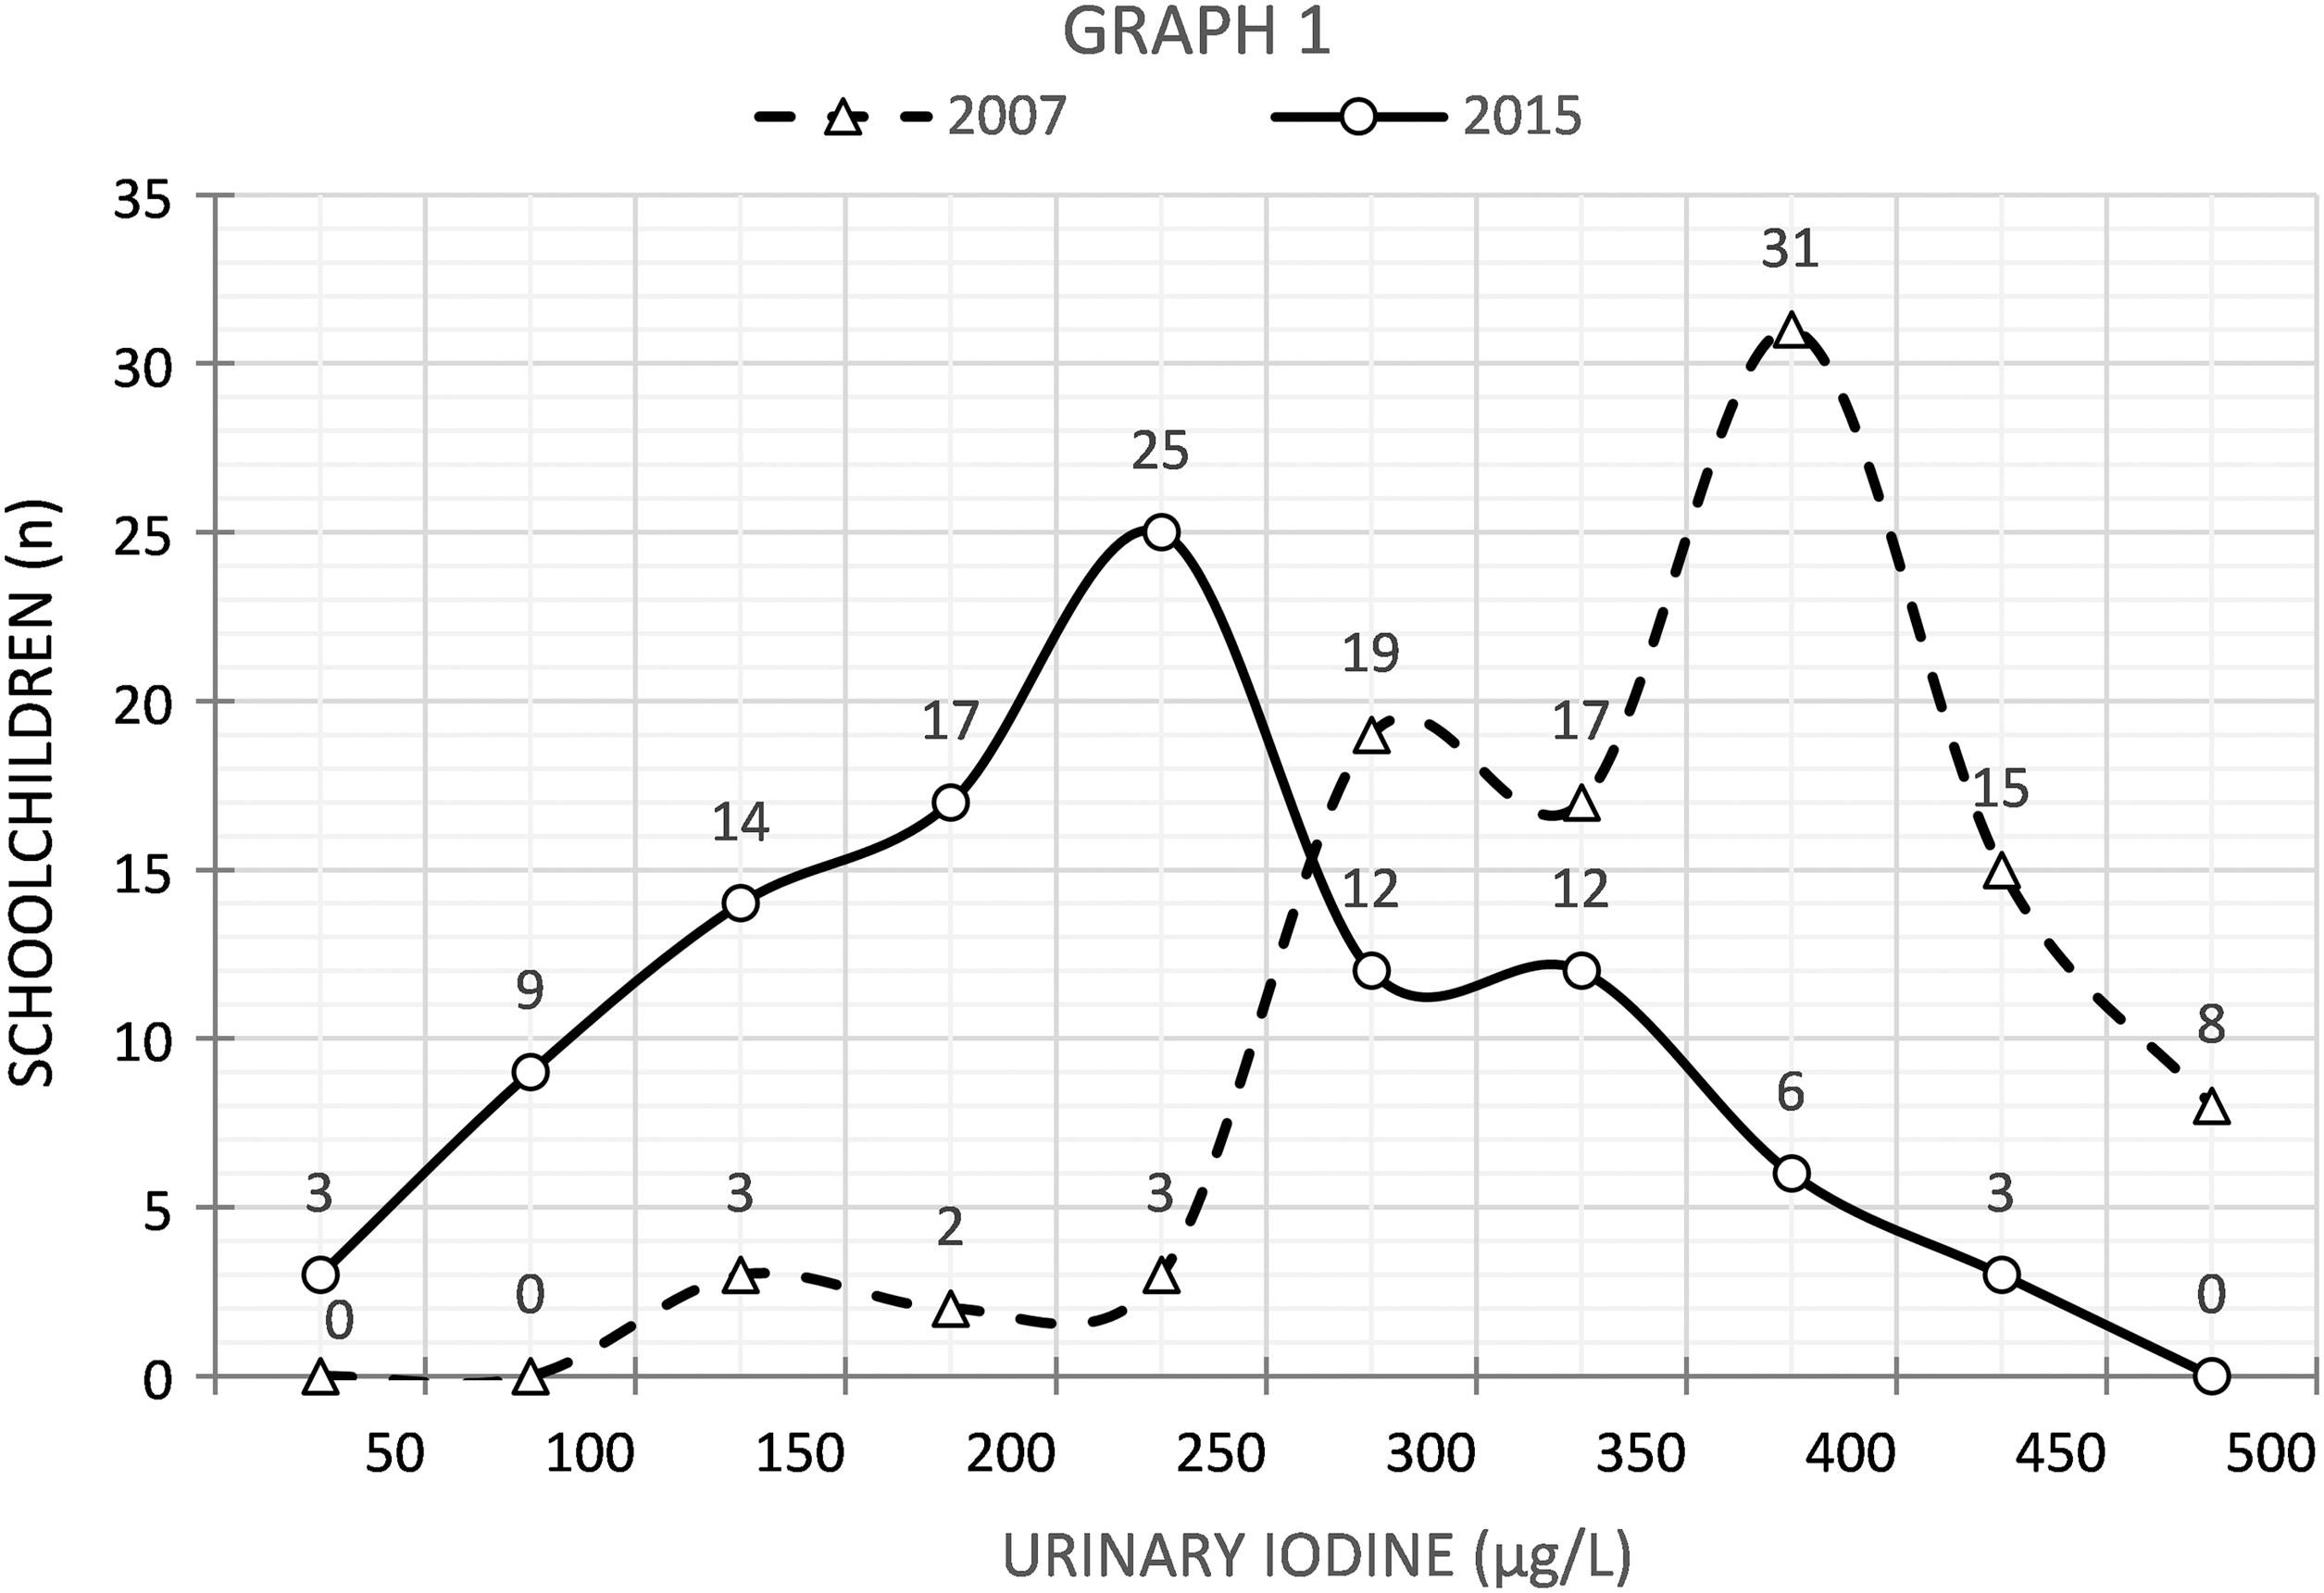
Comparison of ioduria values (μg/L) at school 1 between 2007 and 2015.
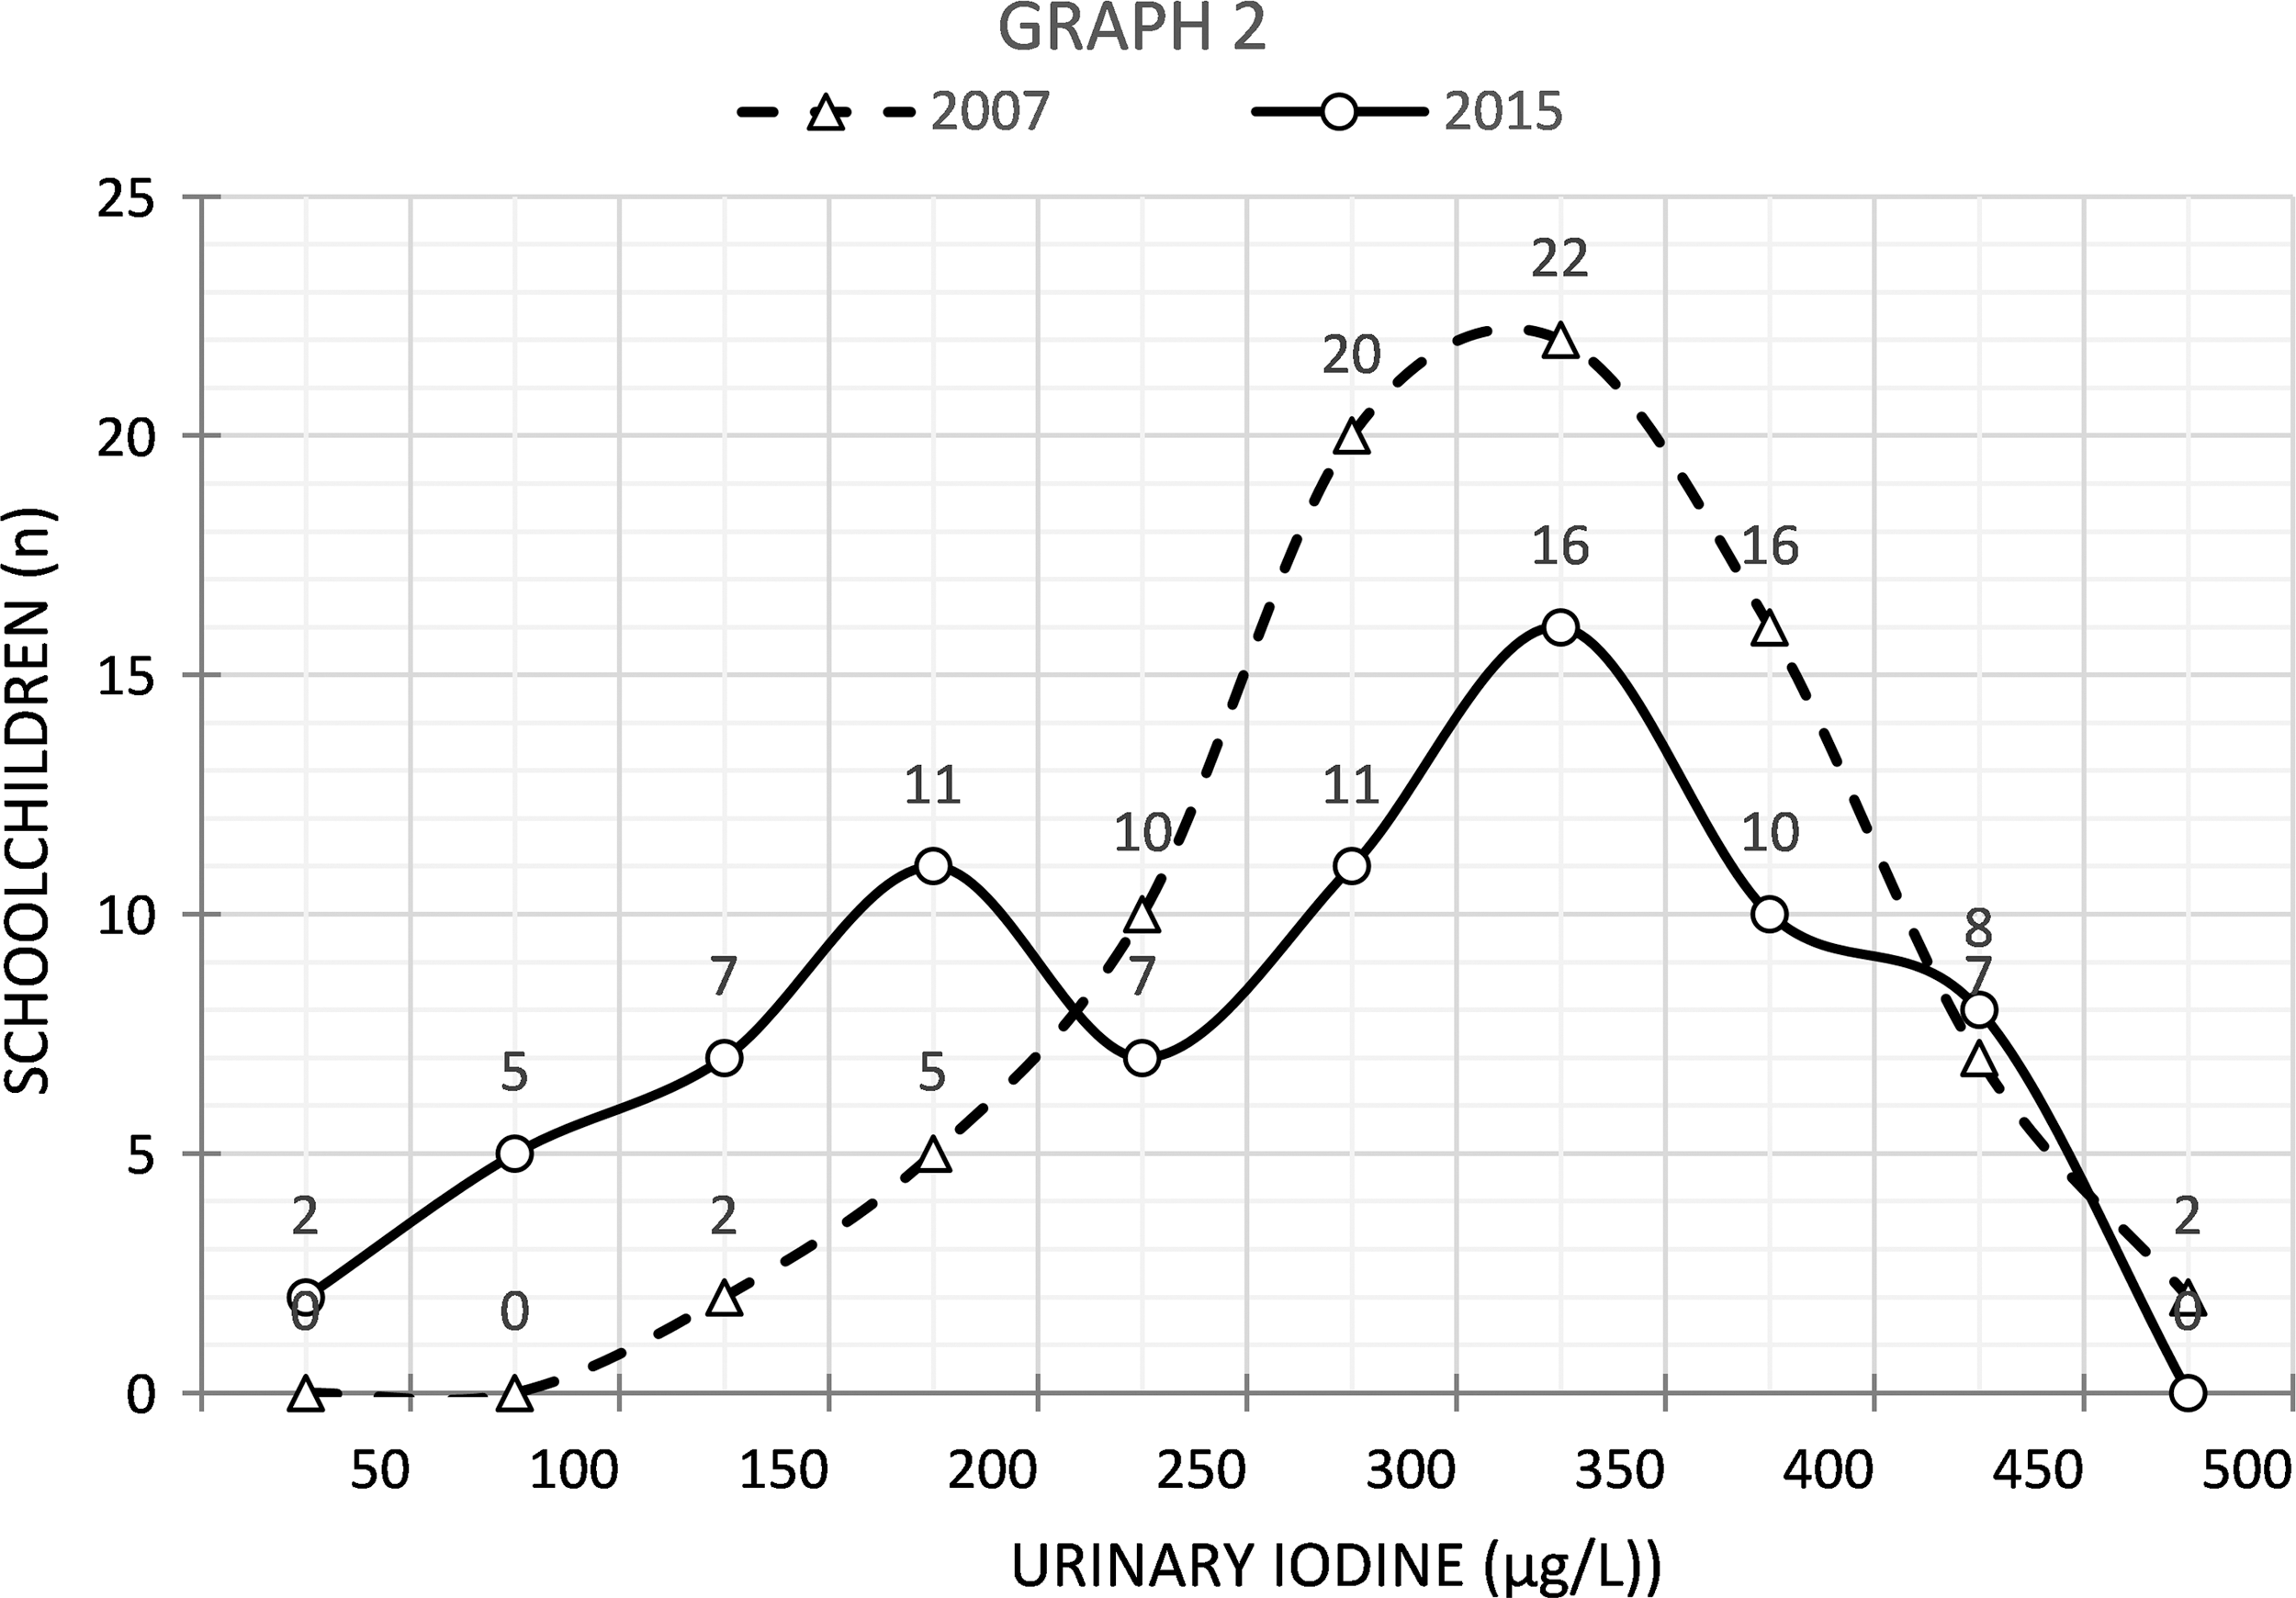
Comparison of ioduria values (μg/L) at school 2 between 2007 and 2015.
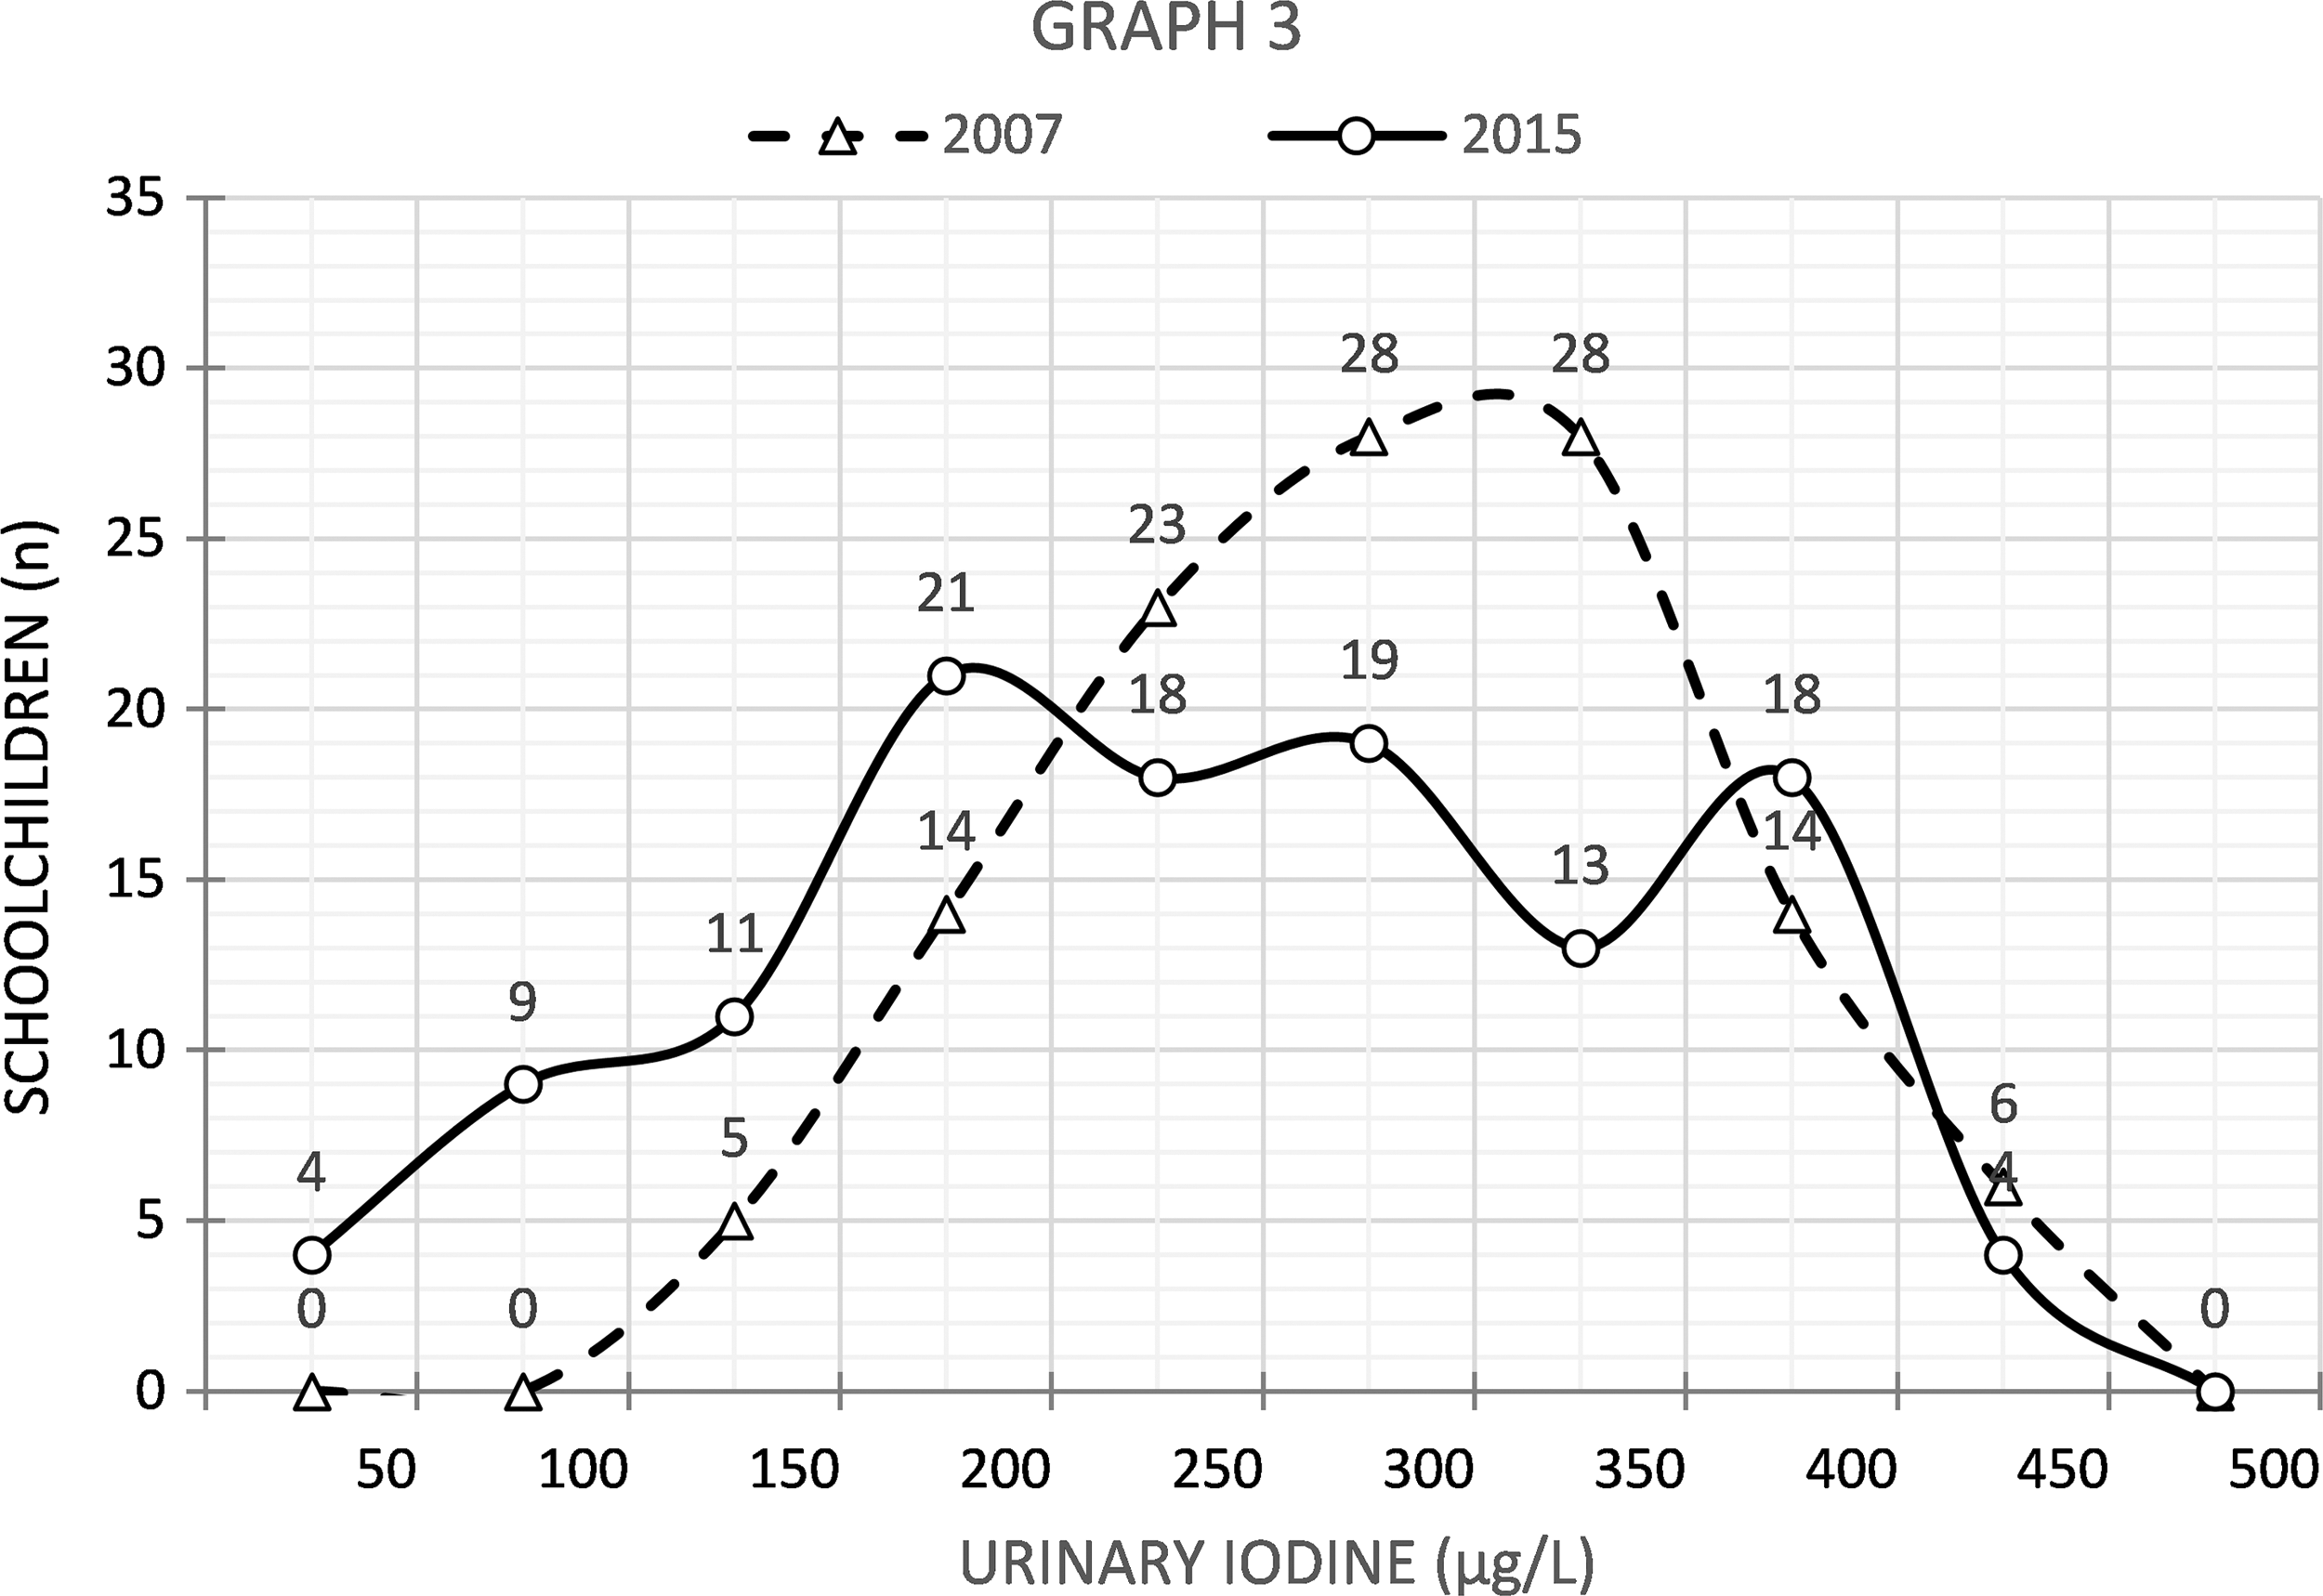
Comparison of ioduria values (μg/L) at school 3 between 2007 and 2015.
Tables 2 and 3 and Figure 4 illustrate the ioduria levels detected in 2007 and 2015, showing a significant reduction in the latter year of analysis. In 2007, approximately 55% of the urine samples contained >300 μg/L iodine; this percentage fell to 28.5% in 2015 (the maximum limit recommended by the WHO). The ioduria values across the three schools for 2007 and 2015 were significantly different (p < 0.001 and p = 0.012, respectively).
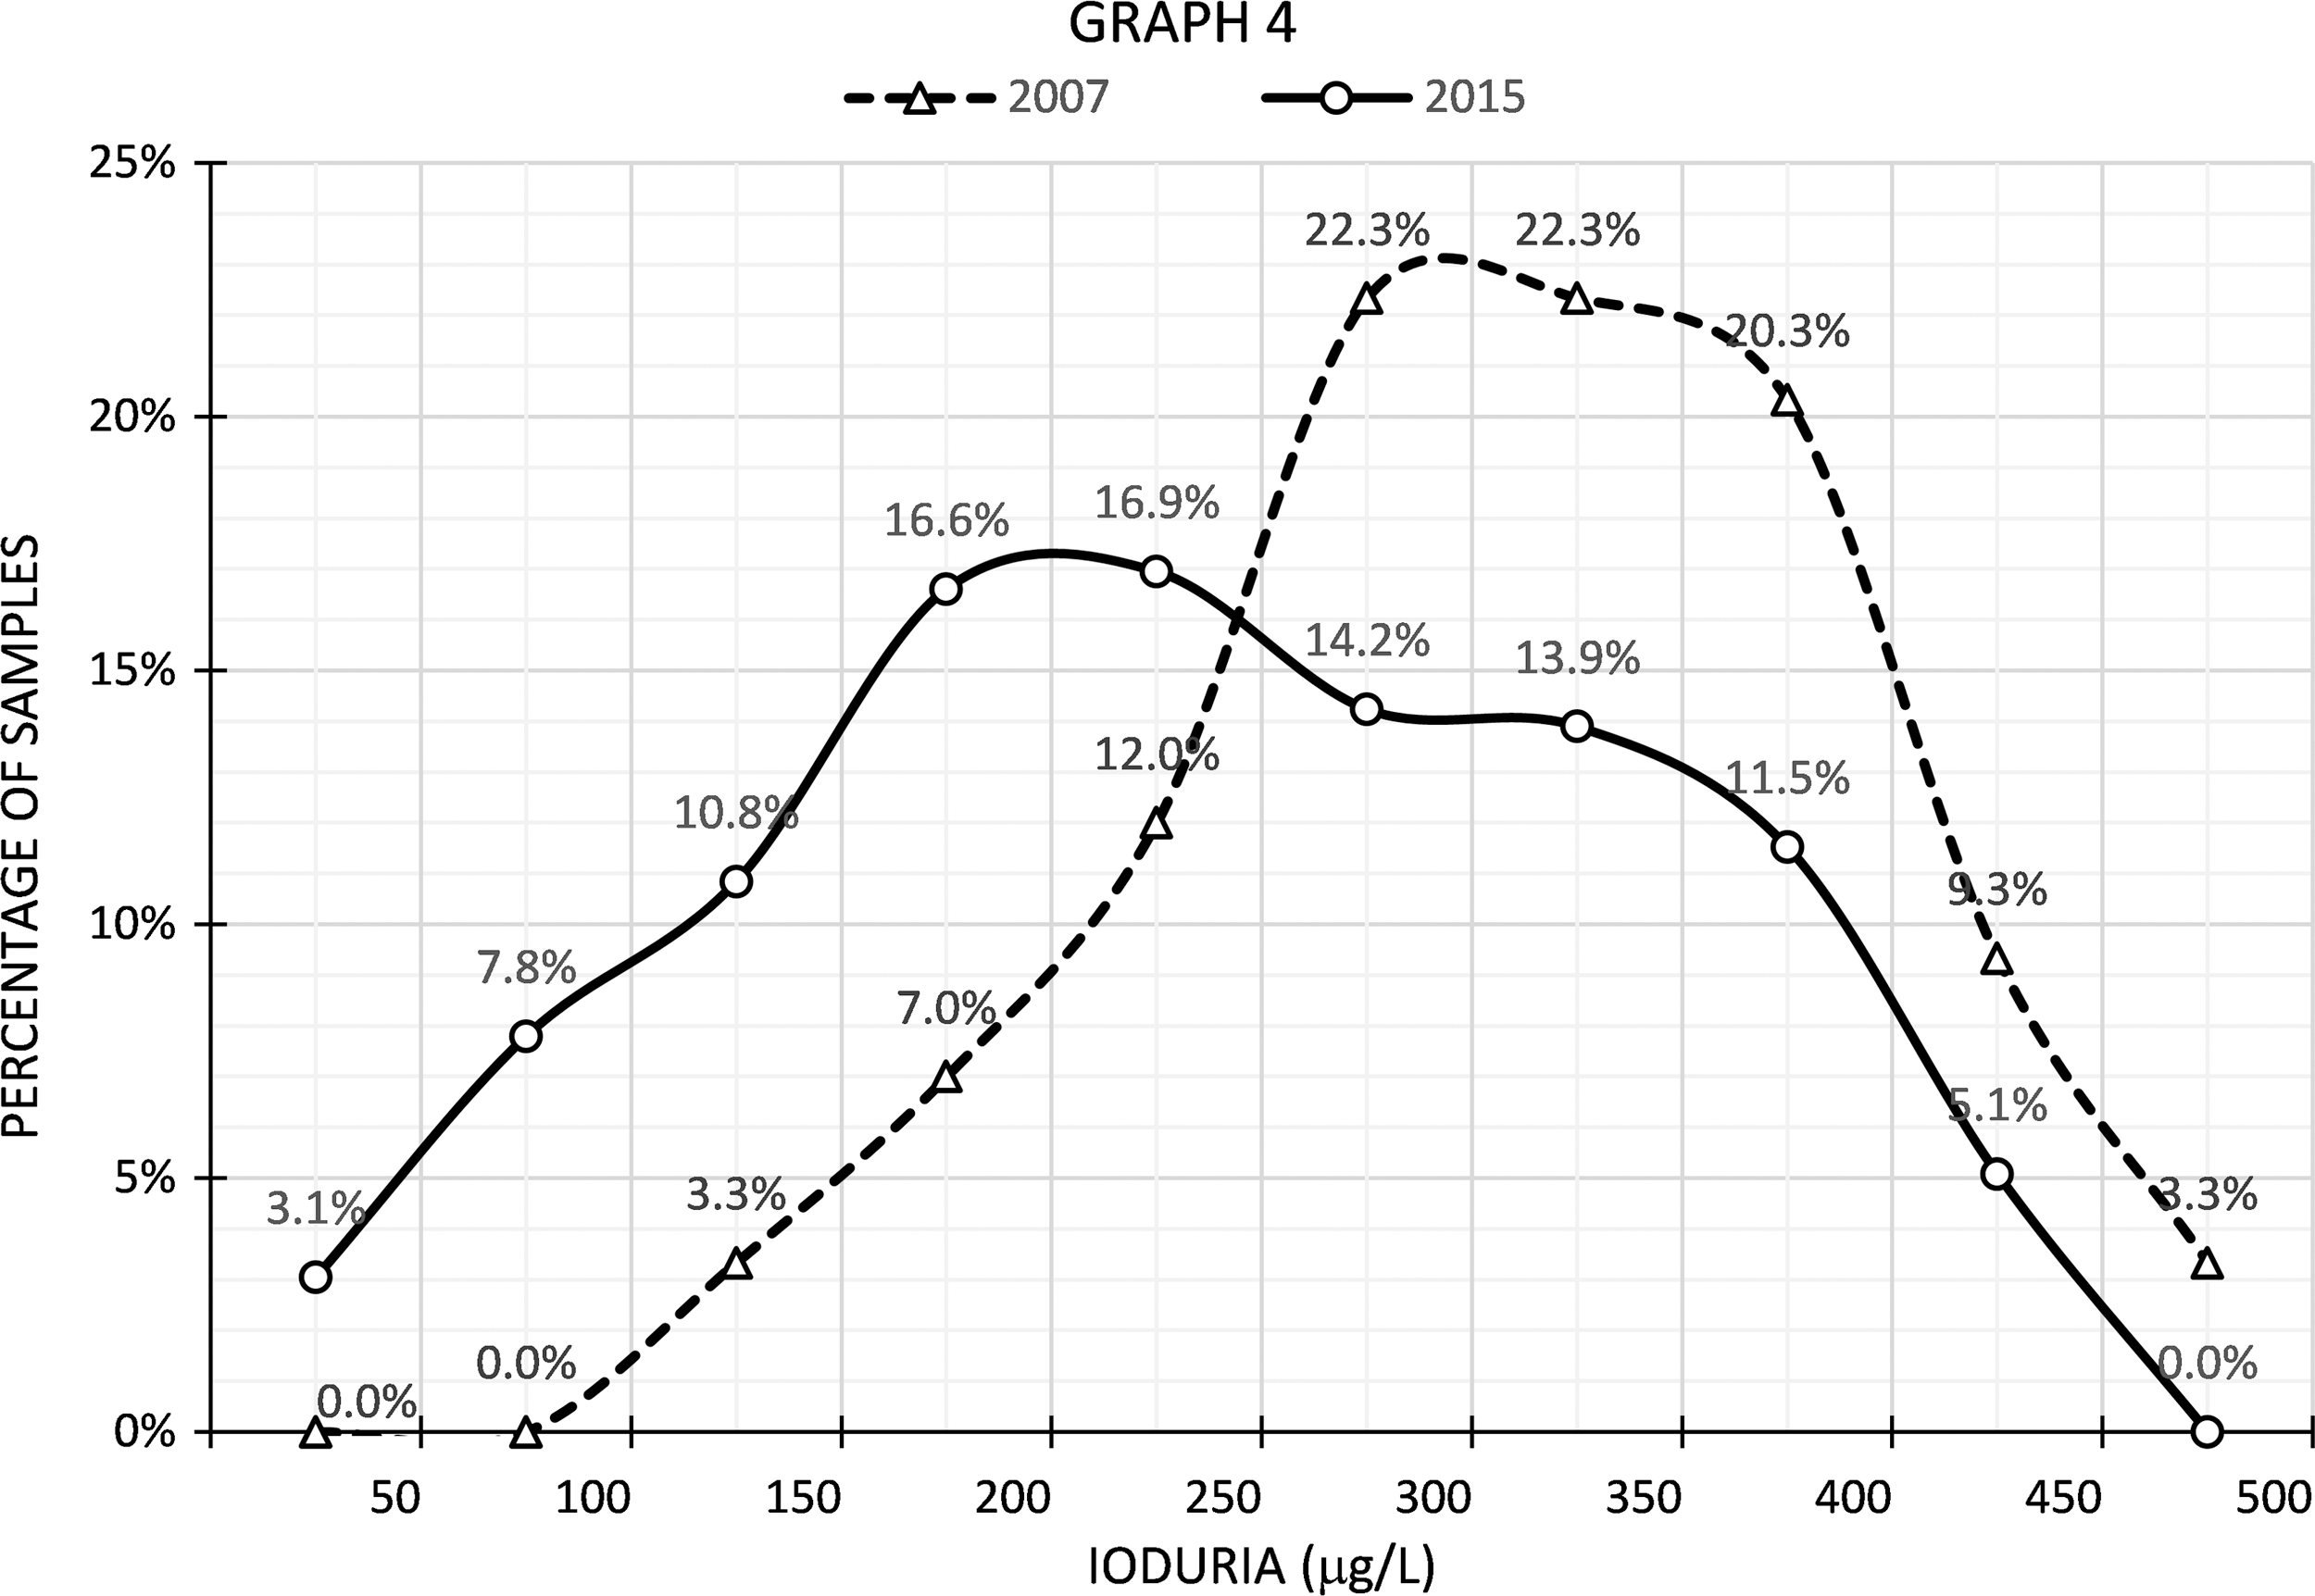
Comparison of ioduria percentages (μg/L) between 2007 and 2015.
Table 4 presents the thyroid volume of the students from each school in 2015. Table 5 compares thyroid volume to urinary iodine excretion (μg/L). Table 6 compares thyroid volume to iodine in salt samples at the three schools in 2015. The thyroid volumes detected and classified as T1, T2, and T3 showed an increase of T3 at school 1 (predominating among the children with lower ioduria), a lower proportion at school 2, and an even lower proportion at school 3 (i.e., 7.92% [8/101], 5.19% [4/77], and 0.56% [1/177], respectively), with 4.4% (13/295) cases of T3 (goiter) in the study as a whole (Tables 5 and 6).
Percentage of Thyroid Volume Cases at each School
T1, thyroid not visible, not palpable; T2, thyroid not visible but palpable; T3, thyroid visible and palpable.
Mean and Median Ioduria Values (μg/L) and Thyroid Volume of Schoolchildren at the Three Schools (2015)
Mean Iodine Concentration in Salt (2015) and Cases of Thyroid Volume in each School
Pearson's correlation coefficient revealed that an increase in ioduria resulted in a reduction of thyroid volume in T2 and T3 cases in 2015 (r = 0.78 for volume T1, r = 0.90 for volume T2, and r = 0.99 for volume T3). Pearson's correlation coefficients between iodine concentration in salt and iodine concentration in urine were r 2007 = 0.935 and r 2015 = 0.648, representing contradictory results. However, data regarding mean iodine concentration in salt were used for each school in 2007 and 2015 (Table 1), since individual values for each student were not available.
Discussion
In the present study conducted in 2015, all of the salt samples for domestic consumption delivered by the schoolchildren had iodine concentrations within the range recommended by ANVISA (Table 1). In the previous study, conducted in 2007, salt samples with irregular iodine contents were detected, either up to less than half or up to three times more than recommended by the ordinance valid at the time (Table 1). These data may have influenced the finding of lower mean/median iodine concentrations in the salt samples in 2007 compared to 2015. Salt, even when less iodized, may produce higher ioduria levels if consumed in greater quantities. Kitchen salt iodization is considered to be adequate when >90% of the samples are close to the minimally recommended levels (22,23).
The ioduria levels detected in 2015 were significantly lower than those detected in 2007 (Tables 2 and 3). Approximately 12 samples from school 1, seven from school 2, and 13 from school 3 (10.9% of the total) had ioduria levels lower than the WHO recommendations (100 μg iodine/L urine; Figs. 1 –4) Most countries in the world today have iodization programs for domestic salt, water consumed, or bread offered in a determined region, which include iodinated oil. The Brazilian government adopted a program in 1956 regarding iodination of kitchen salt, which has yielded positive results (Tables 2 and 3) (24 –31).
In the 2007 study, a tendency toward higher ioduria levels at school 3 (higher social economic status) and lower ioduria levels at the school 1 (lower social economic status) was found, which had been previously observed in other Brazilian studies (12,32 –34). These data were interpreted as the consequence of a greater food intake, including industrialized foods, which in Brazil are prepared with iodized salt, by the children from higher social classes. The lower ioduria levels found in 2015 may also have been due to a reduced intake of iodinated salt used for the preparation of home meals, or to a reduced intake of industrialized foods prepared with iodinated salt. These trends may have occurred in response to governmental campaigns encouraging reduced intake of industrialized products, or perhaps due to a fall in the acquisitive power of the population regarding industrialized products as a function of governmental policies. Another possible explanation for this reduction could be inadequate home storage of salt, which may have reduced the iodine concentration in the salt samples.
The quantity of iodide in household salt samples reflects the quantity of iodide available for human consumption, and appropriate intake depends on the quantity of salt consumed. In these studies, collection samples were properly stored in a place under controlled temperature and humidity. Additionally, potassium iodide is used in Brazil to fortify salt and is considered to be a more stable chemical form. Another aspect to consider is that in Brazil, salt is commercially sold in 1 kg packages, so that families will routinely buy the product when needed without storing large amounts at home. Consequently, salt will be less exposed to changes during home storage.
Both deficient and excessive iodine consumption is harmful for the thyroid. Thus, a program promoting balanced iodization is necessary for each region in the country considering natural iodine resources (being located near the ocean or far from it or on a mountain) (35 –38).
The present study found a uniform iodide content of salt and a reduction of iodide content in the salt samples in 2015, indicating success of the governmental program. In 2007, the concentration of iodide in salt used for food preparation had a greater tolerance range (−20 to 60 mg iodine/kg salt) compared to 2015 (−15 to 45 mg iodine/kg salt). However, the mean iodide concentrations in the salt samples were lower in 2007. It is possible that the discrepant values in the salt samples can explain these results, since ioduria values were higher in 2007.
In 2007, the differences in mean iodide concentrations in the salt samples across the three schools were not significant. However, in 2015, the mean values for each school were significantly different. Mean values were calculated because the salt samples were not identified individually (Table 1). In 2015, the iodide concentration in the domestic samples was lower in school 1, which was frequented by children from families of lower social economic status. These households may have used a more economic salt brand with lower iodination quality, although the mean iodide concentration was within the stipulated range. The children who attend school 1 may consume less industrialized foods or home-prepared food, therefore consuming less salt and consequently less iodide, possibly contributing to the lower ioduria detected at school 1(Tables 1 and 2).
Several studies have correlated thyroid volume and iodine concentration in salt ingested by children, as well as thyroid volume and ioduria, and found an increased gland volume with a lower supply of ingested and excreted iodine (39 –42).
Findings from two studies comparing thyroid changes before and after the reduction of iodine concentration in salt for the population of Brazil have now been supported. The first study showed a reduced prevalence of autoimmune thyroiditis (43), and the present one showed a discrete increase in thyroid volume among schoolchildren, with a goiter prevalence (T3) of 7.92% at school 1, 5.19% at school 2, and 0.85% at school 3 (Tables 4 –6). These data call attention to the onset of urinary iodine levels <100 μg/L in some children in this group, and a tendency toward an increased thyroid volume, more clearly so at school 1, with a lower mean iodide concentration in the salt samples, with lower mean ioduria and larger thyroid volumes.
It was not possible to calculate the correlation between iodide concentration in the salt samples and thyroid volume (only the mean values for each school were available) or the correlation between ioduria and thyroid volume due to the small number of cases of increased thyroid volume (T3; Tables 4 –6).
The present study, conducted in 2015, has some limitations. The sample size, which was smaller than the recommended number (125 children per school studied) (44), although this sample is representative of the city and region of Ribeirão Preto, São Paulo. A further limitation is the assessment of thyroid volume by palpation (in 2015), with is much less precise compared to assessment by ultrasound (in 2007). An attempt was made to compensate for this drawback by using a single experienced examiner trained in thyroid examination by palpation.
Conclusion
The Brazilian government ordinance of 2013 reduced the quantity of iodine in salt for domestic consumption, leading to consistency in iodine content across different brands of salt. Measuring iodine levels in 2007 and 2015 in Ribeirão Preto revealed a reduction in ioduria levels in schoolchildren.
In the present sample from 2015, which is smaller than the recommended number of 125 children per school (44), the general iodine intake of the students was satisfactory, although individual iodine health was compromised, with cases of urinary iodine <100 μg/L and with increased thyroid volumes in some children.
The present study suggests a decrease of iodine intake in Brazil when comparing data from 2015 and 2007, and indicates a need for similar studies in other regions of the country and the adjustment of salt iodization level if necessary.
Footnotes
Acknowledgments
We wish to thank UNAERP for its support and the following UNAERP students for helping with sample collection: Ada Alexandrina Bron dos Santos Soares, Ana Carolina de Carvalho Dib, Ana Carolina Ramos Rezende, Anna Luiza Flôres Saab, Barbare Freitas Oliveira, Bruna Saiuri Oyadman, Camila Gomes de Assis, Carina Curti, Carlos Antonio Teodoro Rossignolo, Carolina Salvi Scomparin, Caroline Georgea Menezes de Pauli, Deborah Barcelos Victoy, Fabiano Carmanhan Fernandes, Gabriela Barcelos Victoy, Gabriela Guilmo de Oliveira, Gabriela Oliveira Caramano, Glauber Cerizza Silveira, Gustavo Ferreira Pacheco, Hellen Sanches Pitaluga, Jacqueline Fernandes Benatti João Vitor Moraes Oliveira, Martins, Karen Takeda Monwake, Laisa Fernandes Brioni, Layse Adormeces Saud, Letícia Dias Franco da Silva, Lorena Guimarães Mesquita, Lorena Pagliani Cypriano, Lucas Kajirari, Marcela Cristina Marquezani França Gomes, Marcela Destre Andreazzi, Mariana Cabral de Jesus, Mariana Morato O. Dias, Mariani Pereira Guilhen, Matheus Spricido, Nathália Rodrigues Aura, Paula Virginia Bron dos Santos Soares, Raphael Silva Martins, Ricardo Maturano Zaneti, Rodrigo Mistil Regalieri, Rodrigo Almeida Luz, Rômulo Nascimento Mundin, Samuel Antonio Biojo Souza, Simone Plaza Maranzato, Thaissa Souza Leonardo, and Vinicius Fernandes Nowicki.
Author Disclosure Statement
The authors declare that they had no conflicts of interest in this study.