
Abstract

Introduction
F
Methods
This retrospective study was approved by the Duke University Institutional Review Board (Pro00102053) with waived informed consent. Our dataset comprises all diagnostic FNABs with surgical follow-up collected at Duke Health between 2013 and 2019 (n = 1940). A WSI was generated from one representative, Papanicolaou-stained, direct smear from each FNAB. We excluded 363 WSI with poor scan quality. The remaining 1577 cases were divided into a training set and a test set. The test set comprised all ITNs (TBS-3, TBS-4) with molecular results: ThyroSeq group (n = 59), Afirma group (n = 48). At Duke, MTs are typically performed on atypical FNABs with variable use for cases diagnosed as follicular neoplasm. We expanded the test set to include a comparable number of ITNs without MTs (cytology only group) from a consecutive 12-month period (n = 111). Patients overlapping with the training set (n = 61) and TBS-5 cases (n = 20) were excluded from the test set. The remaining cases were used for training (n = 1278).
We previously published details of the algorithm training, validation, and testing. 7 The algorithm comprises two parts: a region of interest (ROI) detector trained to identify thyroid follicular cells and a classifier trained to simultaneously predict TBS category and malignancy. For each WSI in the test set, the ROI detector identified the 20 most predictive ROIs to be used for the malignancy prediction. The classifier averaged malignancy predictions across the 20 ROIs to obtain a slide-level prediction between 0 (benign) and 1 (malignant). For ThyroSeq predictions, we used the probability of cancer provided in the report as a percentage. For Afirma, we used the binary result provided in the report: 1 = suspicious, 0 = benign. We multiplied each MT result by the algorithm's prediction to arrive at a combined prediction. This combined score assumes that the model and the MT results are independent predictors, thus the likelihood of malignancy is simply the product of the probabilistic estimates from each.
Performance was evaluated using the receiver operating characteristic (ROC), the area under the ROC curve (AUC), true positive rate (TPR), and false positive rate (FPR). For the AUC and FPR 95% confidence intervals, we used DeLong's method and Wilson intervals, respectively. Statistical comparisons between FPRs were done with a two-sided Wilcoxon signed-rank test with a p-value of p = 0.05. To aid in comparison, we binarized the electronic medical record TBS categories into benign and malignant at three thresholds (TBS ≥2, ≥ 3, and ≥4), then compared the binary predictions with the final pathology, to obtain FPR and TPR. We added the FPR/TPR pairs as points on the ROC curves; for example, a point designated as “ ≥ 4” shows the FPR/TPR if any FNAB with TBS ≥4 considered malignant/positive.
Results
Table 1 summarizes the TBS categories for all three groups with ROM and cancer subtypes. Figure 1a compares the performance of ThyroSeq (n = 59) to the algorithm using ROC curves with AUCs of 0.821 and 0.832, respectively. The combined prediction of the algorithm and ThyroSeq yielded a higher AUC of 0.876. The comparison of the algorithm's predictions for the Afirma group (n = 48) are shown in Figure 1b with AUCs for the algorithm and combined results at 0.615 and 0.687, respectively. Given the small size of each MT group, we wanted to see whether similar results would hold for the MT group as a whole (n = 107); a group for which positive MT results (n = 70, 65%) likely drive the decision for surgery. The performance of the algorithm, the MTs (black “x”), and the combined predictions for this MT group are represented in Figure 1c. Conversely, we combined the MT group with the cytology-only group in Figure 1d to evaluate the model's performance on all ITNs in the test set (AUC = 0.725). While we cannot statistically compare AUCs between different groups, we find that the model's performance for all ITNs is comparable to the MT group (AUC = 0.739).
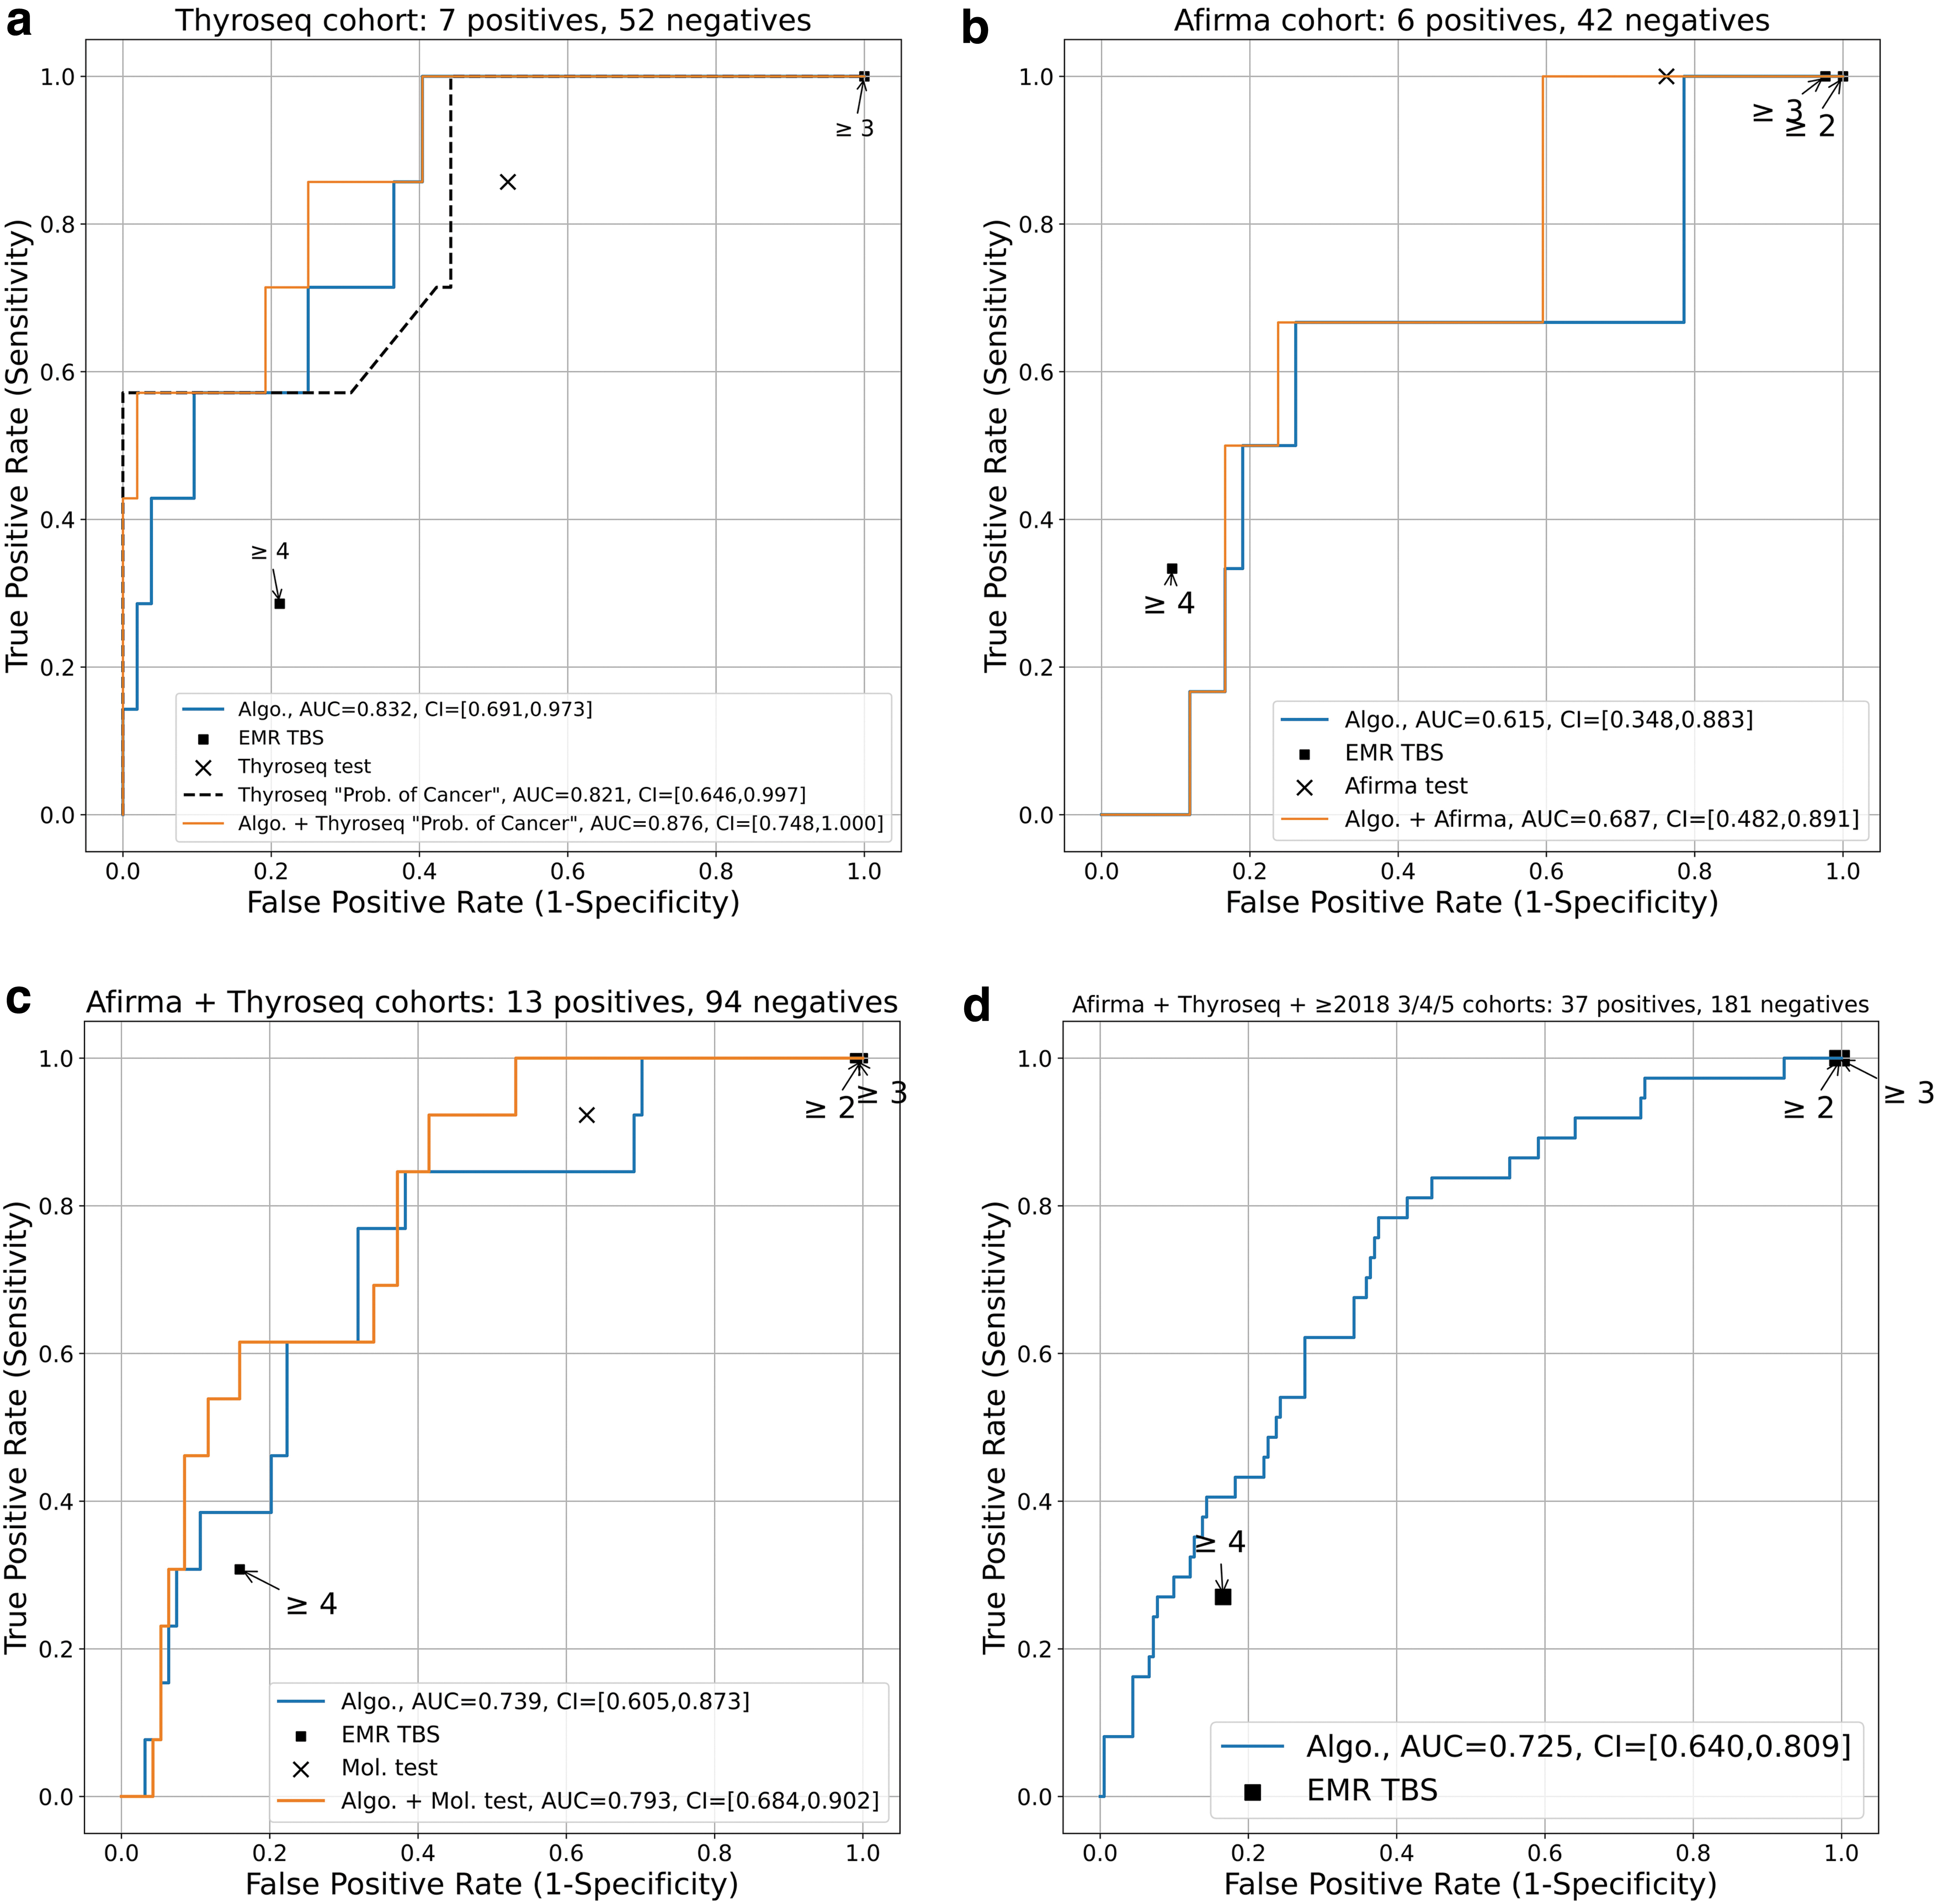
Receiver operating characteristic curves for all groups: (
Breakdown of Groups by Diagnostic Category with Final Pathology Diagnosis of Malignant Cases
FPR comparisons for the thyroseq, afirma, and MT groups (for the same TPR). The TBS-2 case is due to a repeat fine needle aspiration biopsy.
algo, algorithm; cPTC, classic PTC; FPR, false positive rate; FTC, follicular thyroid carcinoma; FV, follicular variant; HCC, Hurthle cell carcinoma; MT, molecular test; PTC, papillary thyroid carcinoma; sPTC, solid PTC; TBS, The Bethesda System for the Reporting of Thyroid Cytopathology; TPR, true positive rate.
Supplementary Figure S1 shows the confusion matrices for each group (columns) with outcomes for the MT, the algorithm, and the combined (molecular + algorithm) predictions represented in each row. For the algorithm and the combined predictions, we set the decision thresholds to equal the TPRs for the MT (ThyroSeq TPR = 85.7%, Afirma TPR = 100%). Supplementary Table S1 summarizes TPR and FPRs with statistical analysis.
Discussion
ThyroSeq v2 and ThyroSeq v3 are reported to have TPRs ranging from 90% to 98% and FPRs ranging from 7% to 18%. 5 Performance of our algorithm compared to ThyroSeq showed FPRs of 36.5% versus 51.9% (p = 0.088) and AUCs of 0.832 and 0.821, respectively. Supplementary Figure S1 highlights the algorithm's ability to place more cases into the benign category resulting in fewer false positives. The Afirma MT has reported TPRs of 80% and FPRs of 88%. 7 Again, the algorithm showed similar performance when compared to Afirma with FPRs of 77.2% and 75%, respectively (p = 0.796), and a TPR of 100% for both.
A secondary question we attempted to answer was whether the addition of the algorithm to the MT result would improve malignancy predictions. FPRs for the algorithm alone, versus algorithm+MT, were lower for both MT groups: Afirma: 77.2 versus 59.1% (p = 0.008) and ThyroSeq 36.5 versus 25% (p = 0002), suggesting a potential value add in improving MT predictions.
We believe this DL approach has potential as an ancillary test to help improve malignancy predictions in the same way that MTs are currently used. This approach is promising since image acquisition is relatively low cost and may prove more accessible in the form of smartphone-acquired images, as we've shown in our recently published work. 8
The primary limitation of our study is in both MT composition and sample size. Ideally, we would have a sufficient number of cases to compare algorithm performance as a rule-out test compared to Afirma and as a rule-in test compared with ThyroSeq. Despite the small dataset, the three test set groups have characteristics that are similar to larger studies. The ROM among ITNs was about 12% in both MT groups and 24% in the cytology-only group. The overall ROM for the entire test set is 17%, sitting at the low end of the published range for TBS-3 and TBS-4 (13–34%). 2 This may be the result of selection bias, in which an indeterminate FNAB result, even in a clinically benign nodule, triggers the ordering of an additional test for decision-making. The resultant positive MT then yields surgery on an otherwise benign nodule, decreasing the overall ROM for the test group. Additionally, 86.5% of the cancers were follicular-patterned lesions. These are the most difficult lesions to classify on cytologic examination and make up the bulk of ITNs. Our algorithm's ability to perform on par with such a diagnostically challenging group shows some promise. A future, larger, multi-institutional study would provide statistical power to draw more definitive conclusions about the algorithm performance in the setting of ITNs.
As with any retrospective study, there is inherent bias. Selecting surgically confirmed cases is needed to establish ground truth but creates bias in favor of benign-nodules that may have clinically worrisome features which were not studied (i.e., family history, exposures), leading to surgery and potentially higher FPRs in our test set. Similarly, evaluating only ITNs with MTs selects for clinically difficult management cases that may have a higher rate of surgery regardless of molecular result. We attempted to address this by adding a comparable number of ITN FNABs without MT. When the ITN group was evaluated as a whole, the algorithm predicted malignancy with a reasonable performance level (AUC = 0.725).
In this study, we compared the performance of a DL algorithm to predict malignancy on WSIs of FNABs of ITNs to predictions made by two MTs at a single institution. Our preliminary results presented here suggest that the algorithm performance is comparable to MTs in the prediction of malignancy in ITNs. In addition, the use of a DL algorithm with molecular testing showed slight improvements in malignancy predictions over molecular testing alone. Further study with a larger test set can serve to draw conclusions about the use of machine learning in the management of ITNs.
Footnotes
Disclaimer
The content is solely the responsibility of the authors and does not necessarily represent the official views of the National Institutes of Health.
Authors' Contributions
S.A.: Conceptualization (lead); data curation (lead); methodology (lead); software (lead); validation (lead), formal analysis (lead); investigation (lead); writing original draft (lead). D.D.: Conceptualization (equal); methodology (equal); software (supporting); writing, reviewing, editing (lead). C.P.: Data curation (supporting); writing, reviewing, editing (supporting). S.Z.K.: Conceptualization (supporting); writing, reviewing, editing (supporting). R.R.K.: Conceptualization (supporting); writing, reviewing, editing (supporting). D.J.R.: Conceptualization (supporting); writing, reviewing and editing (supporting). J.C.: Conceptualization (supporting); writing, reviewing, editing (supporting). A.W.-M.: Conceptualization (supporting); writing, reviewing and editing (supporting). R.H.: Conceptualization (supporting); writing, reviewing and editing (lead). W.T.L.: Data curation (supporting); formal analysis (supporting); writing, reviewing and editing (supporting); funding acquisition (lead). L.C.: Conceptualization (supporting); writing, reviewing and editing (supporting); supervision (lead). D.E.R.: Conceptualization (equal); resources (lead); data curation (supporting); writing, reviewing and editing (equal); supervision (equal).
Author Disclosure Statement
No competing financial interests exist.
Funding Information
W.T.L., D.D., D.E.R., D.J.R., J.C., and S.Z.K. are supported in part by a National Cancer Institute/Fogarty International Center Grant (1R21CA268428-01). No funding was received by S.A., C.P., R.R.K., A.W.-M., R.H., and L.C.
Supplementary Material
Supplementary Data
Supplementary Figure S1
Supplementary Table S1